
Houses for sale in The Chart, Kent
There are 41 results for The Chart, Kent. Property prices in The Chart range from £220k to £1.68M with an average price of £648k.

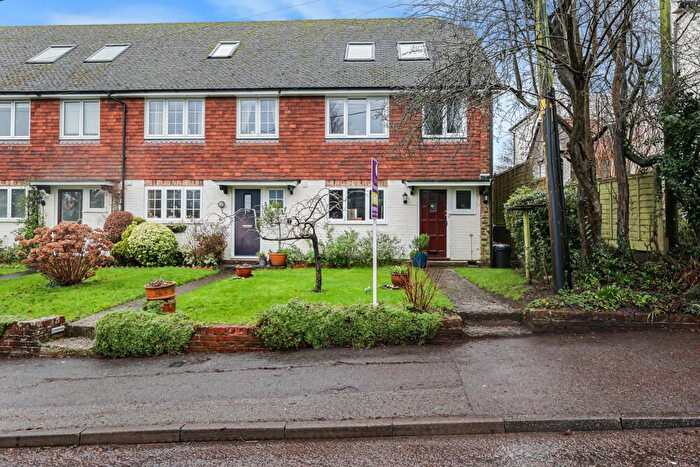
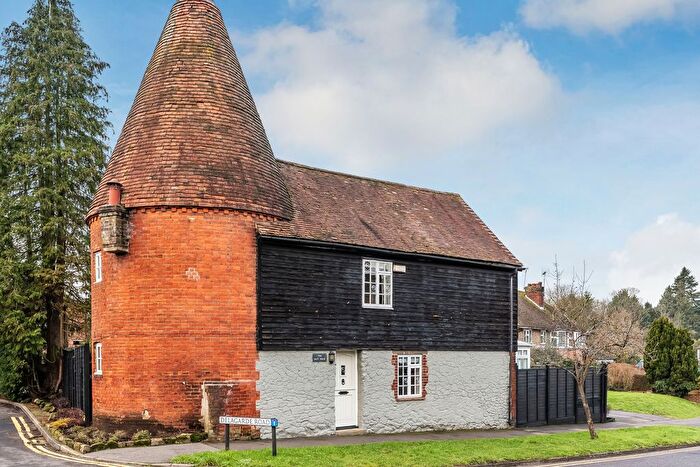
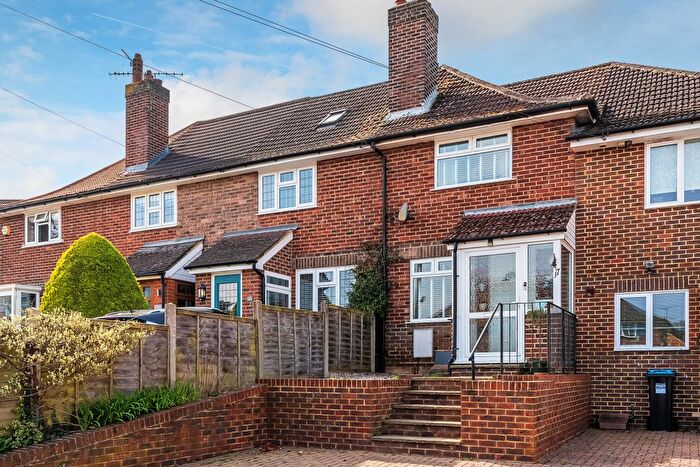
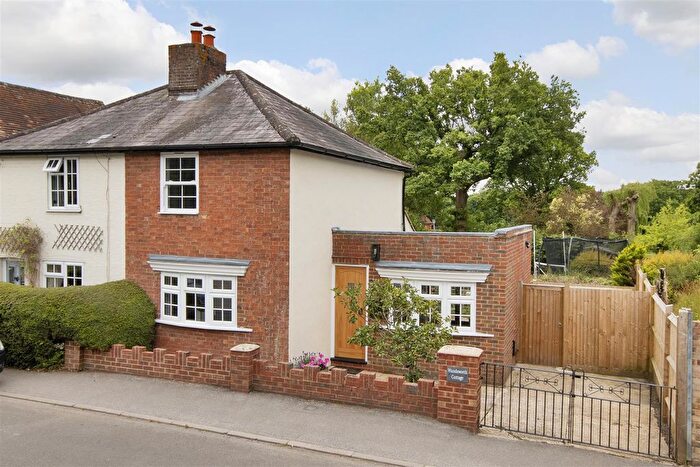
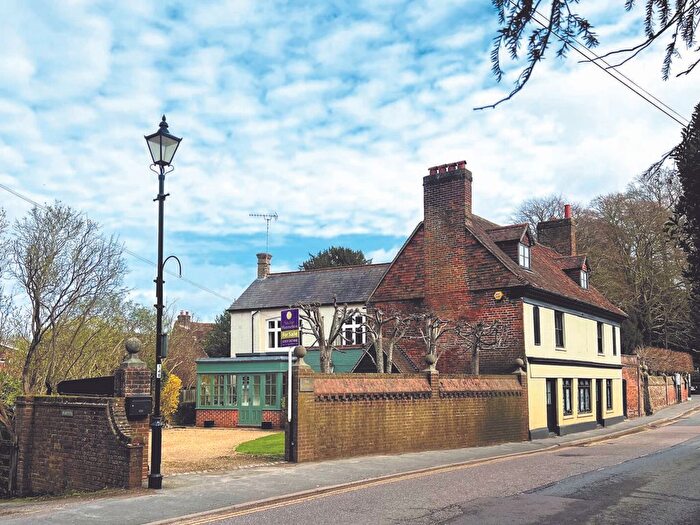
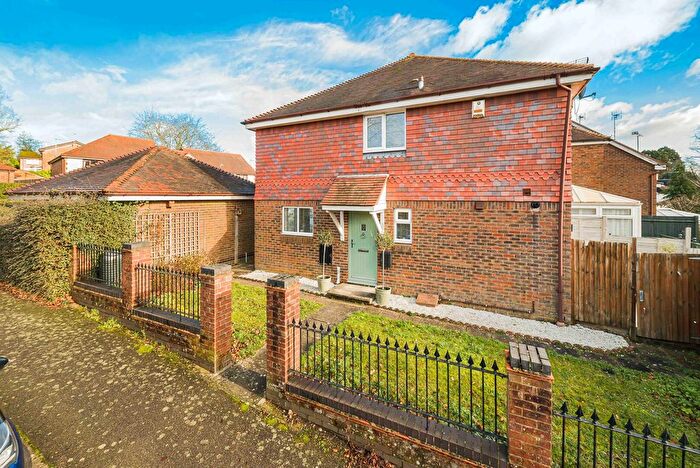
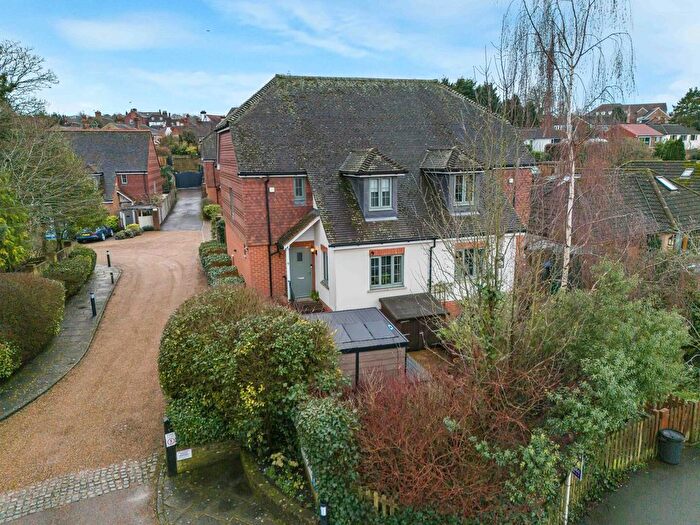
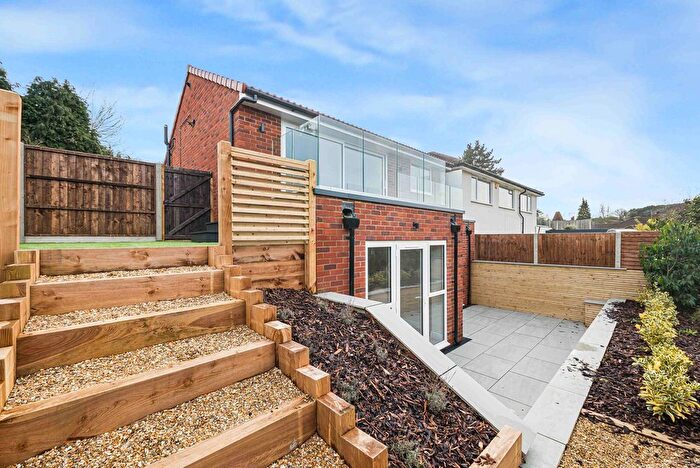
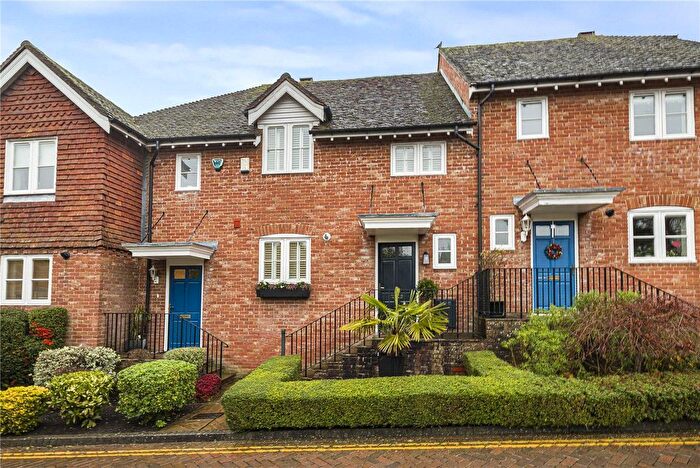
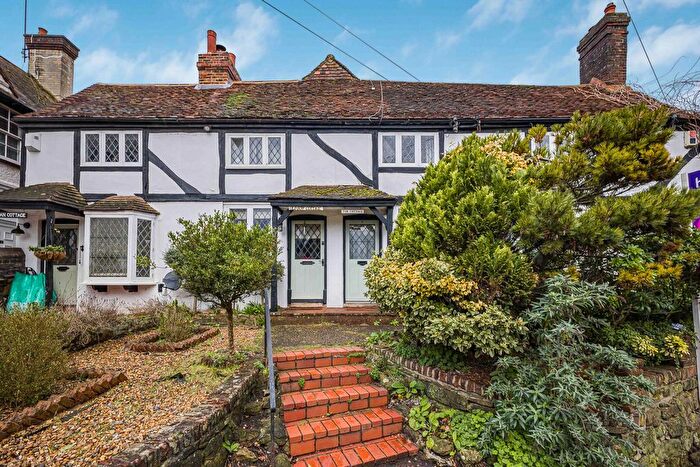
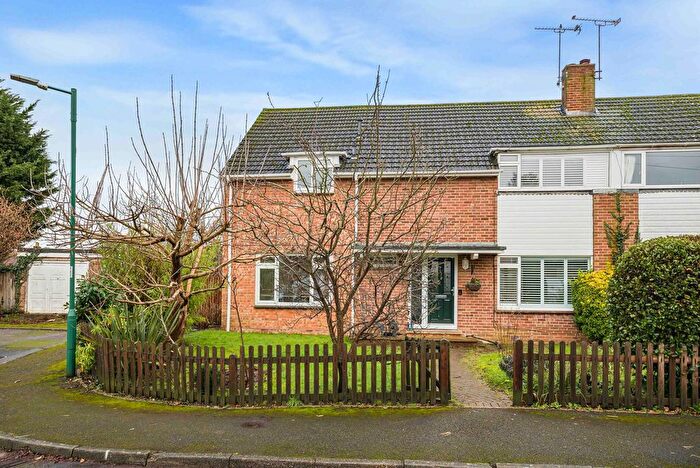
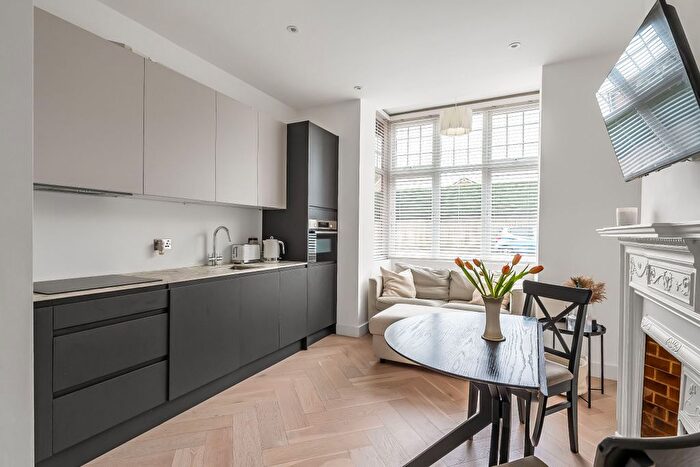
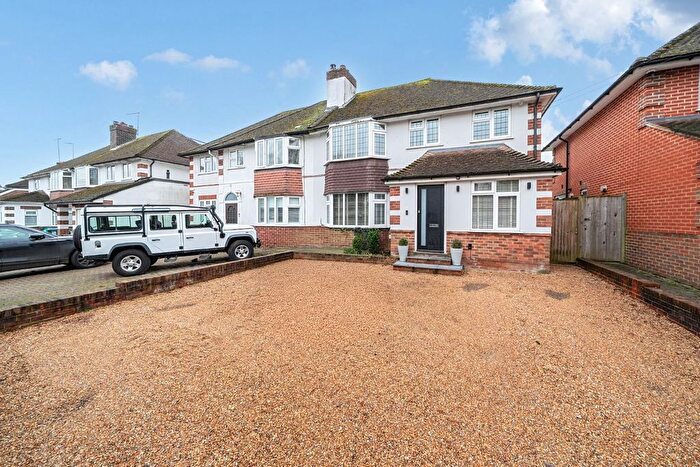
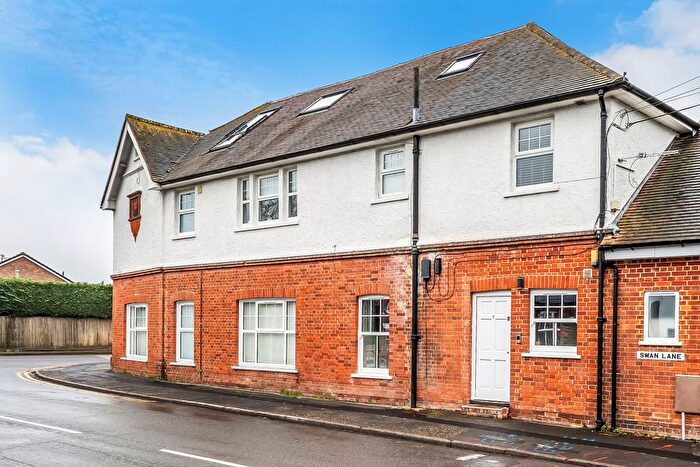
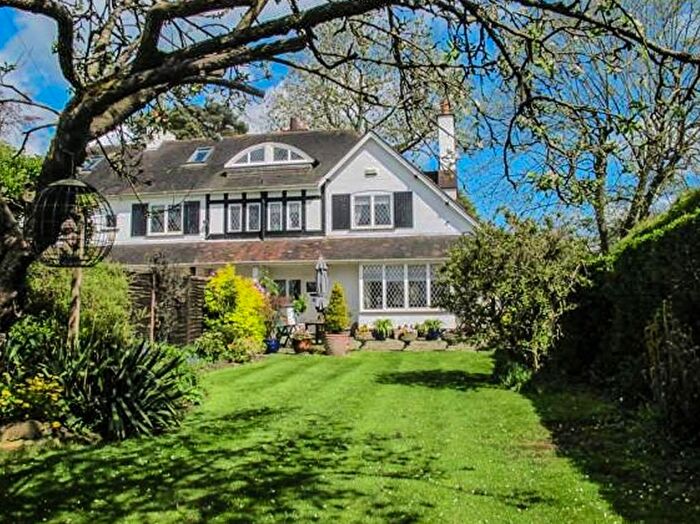
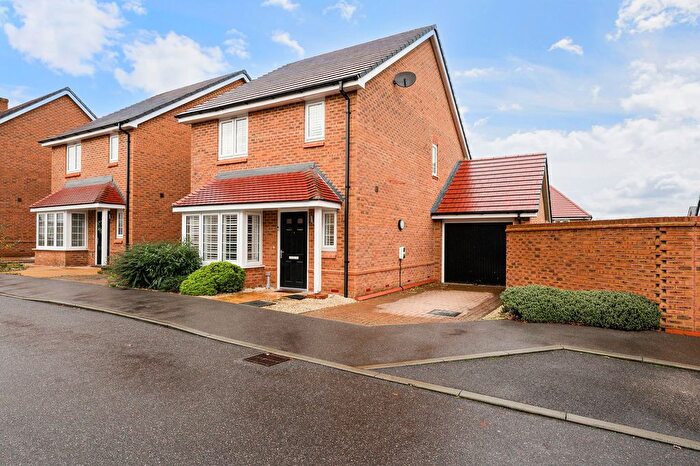
Properties for sale in The Chart, Kent
![]()
If you are looking to sell your house, let it out, or receive a property valuation, an expert can help you.
Click the button below to get started.

Frequently Asked Questions about Properties in The Chart
What is the average price for a property for sale in The Chart?
The average price for a property for sale in The Chart is approximately £647,500.
How many properties are currently available for sale in The Chart?
There are 41 properties currently available for sale in The Chart.
What is the price range for a property in The Chart?
The price range for a property in The Chart ranges from £220,000 to £1,675,000.
What is the most common property type in The Chart?
The most common property type in The Chart is a 3 bedroom semi-detached house.
What is the average price for a 3 bedroom semi-detached house in The Chart?
The average price for a 3 bedroom semi-detached house in The Chart is approximately £651,500.