
Houses for sale & to rent in Bedfordshire, England
House Prices in Bedfordshire
Properties in Bedfordshire have
an average house price of
£371k
and had 18,351 Property Transactions
within the last 3 years.¹
Bedfordshire is a location in
England with
168,168 households², where the most expensive property was sold for £3.6M.
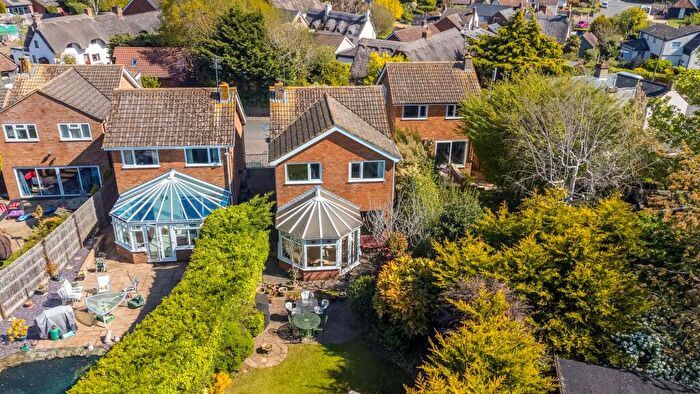
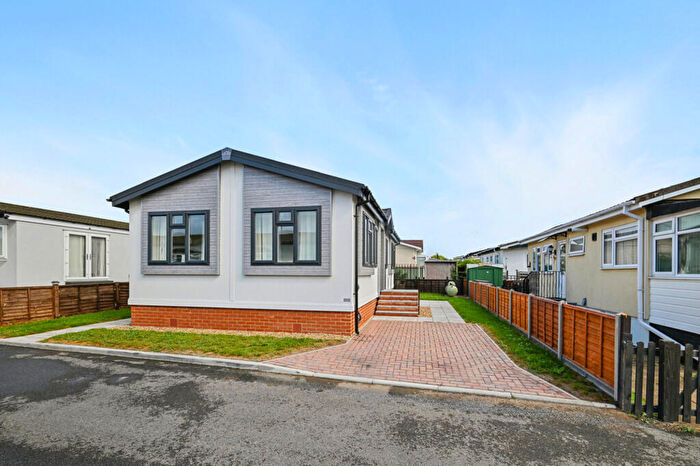
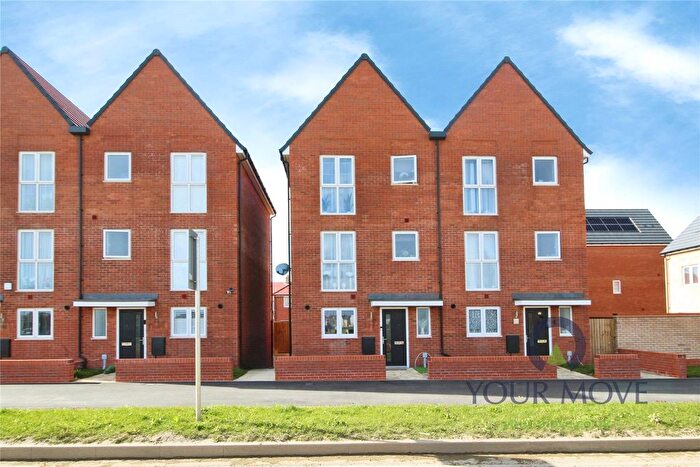
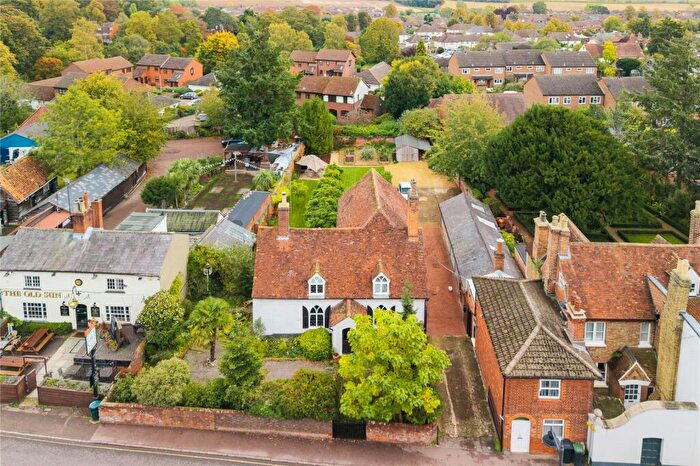
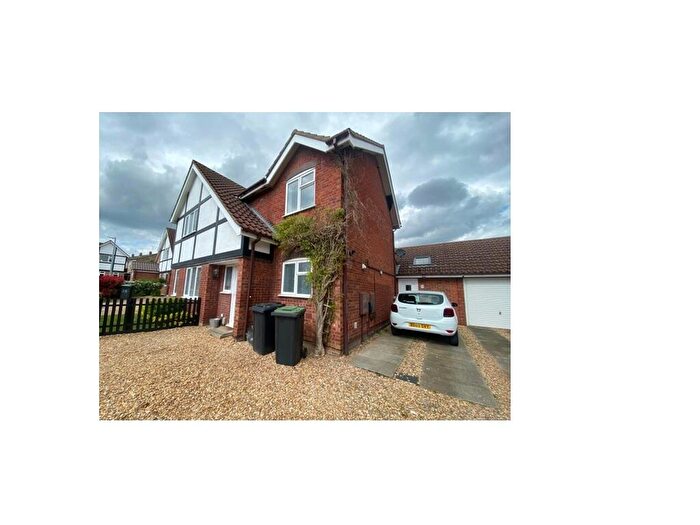
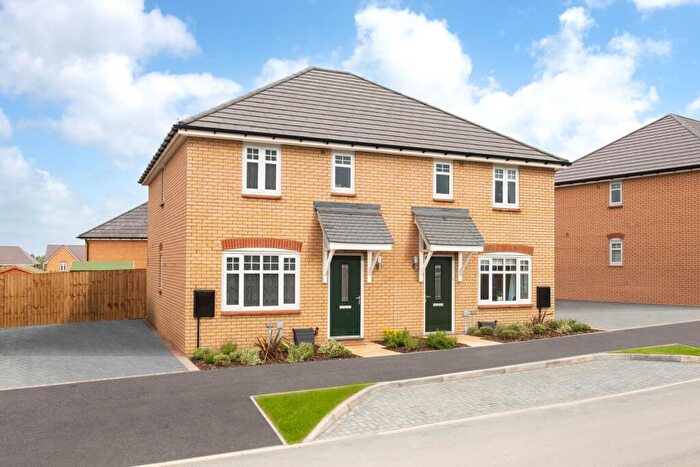
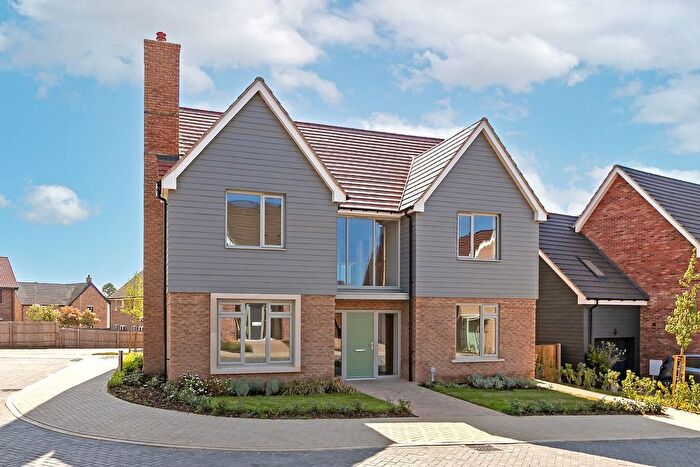
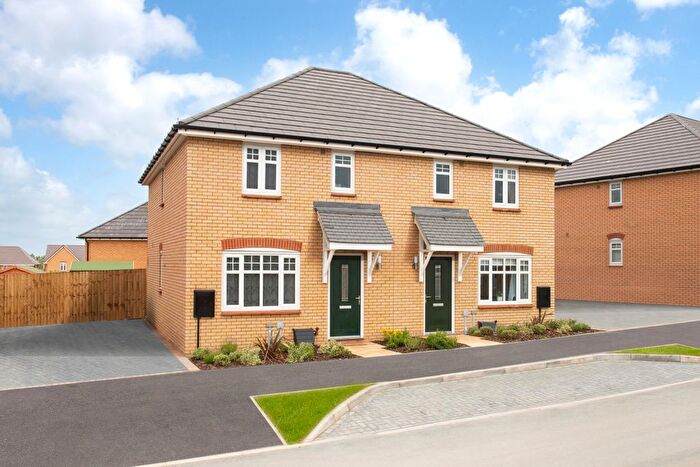
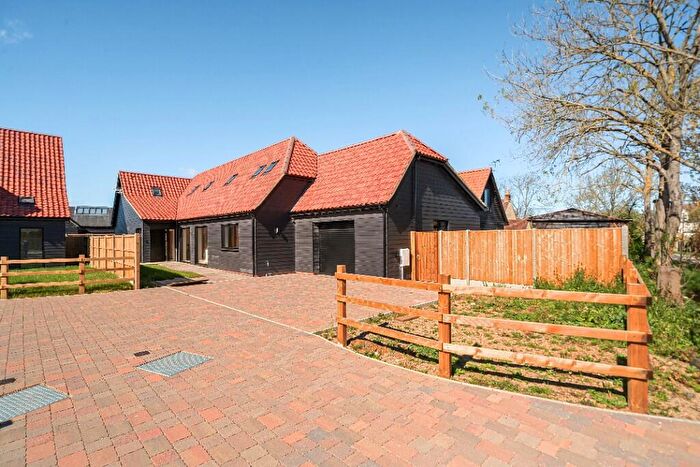
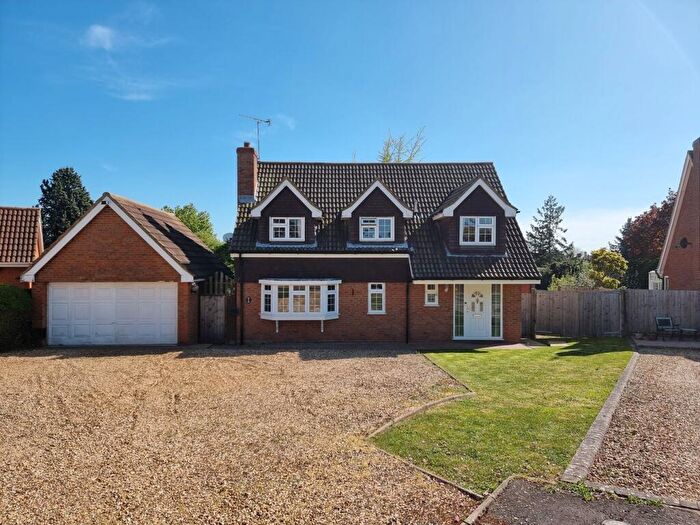
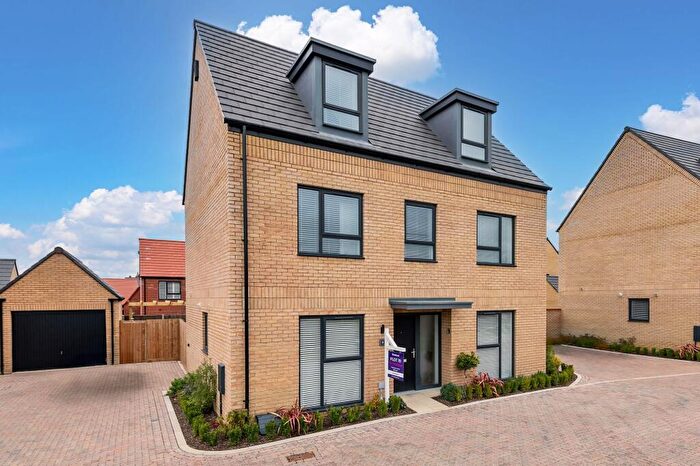
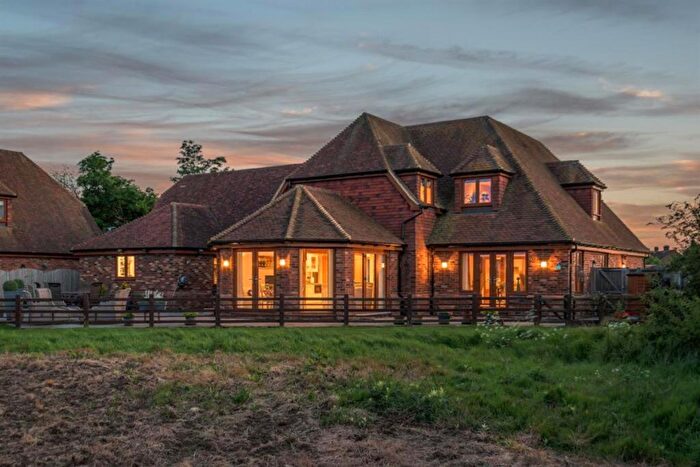
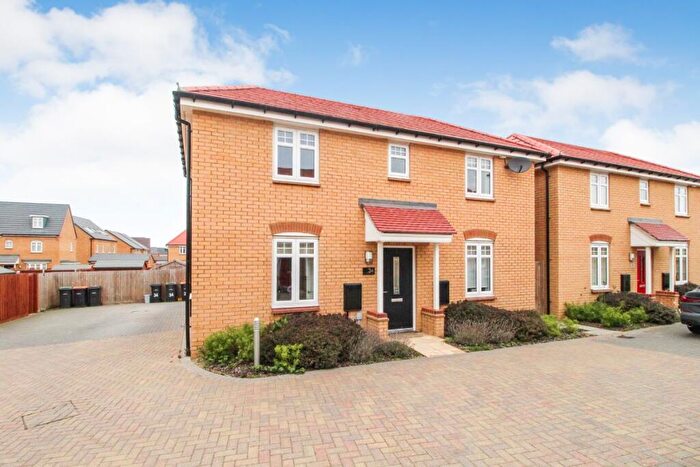
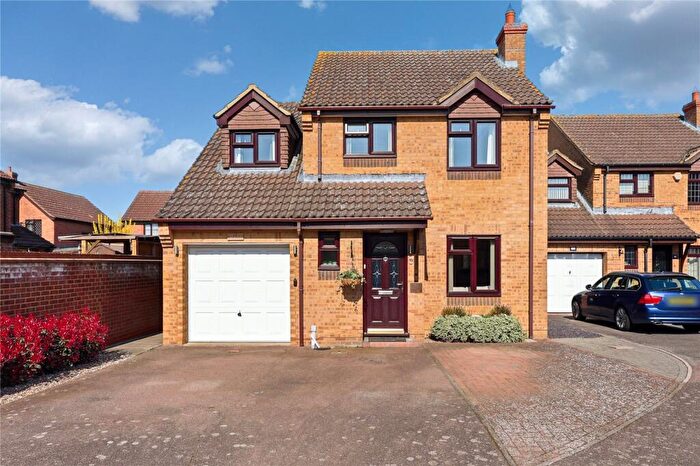
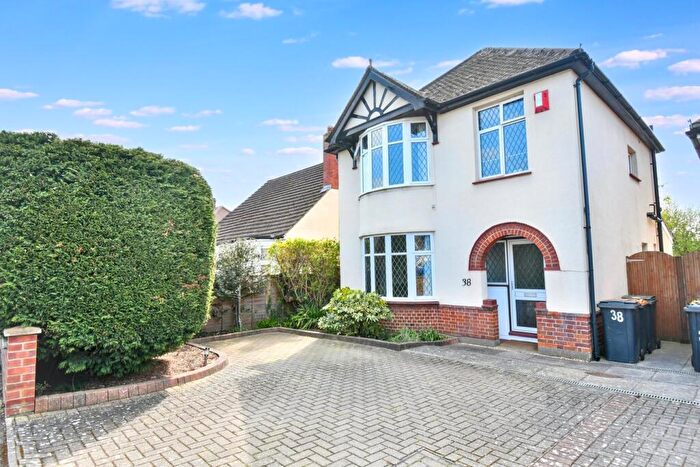
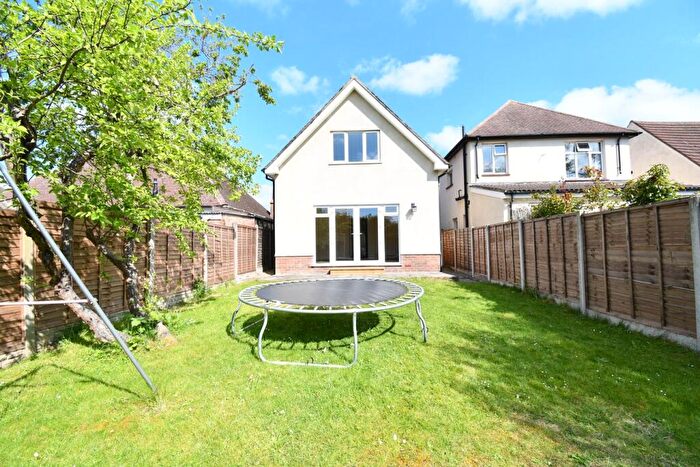
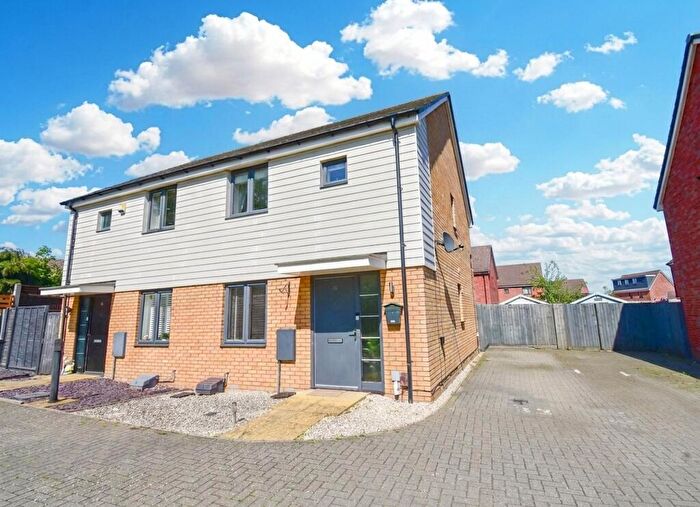
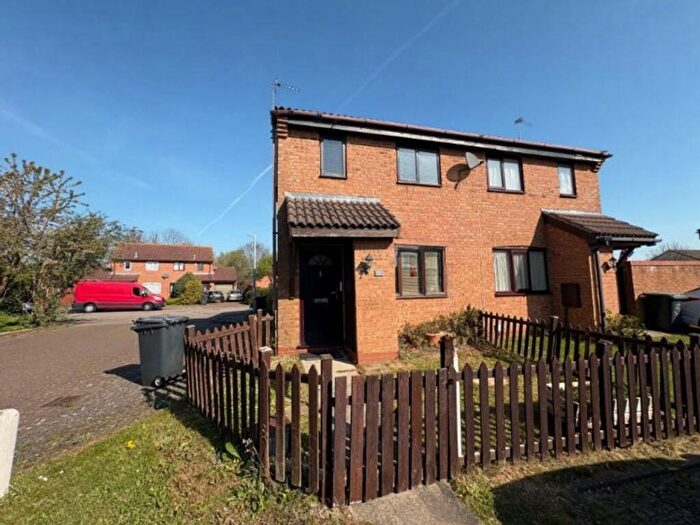
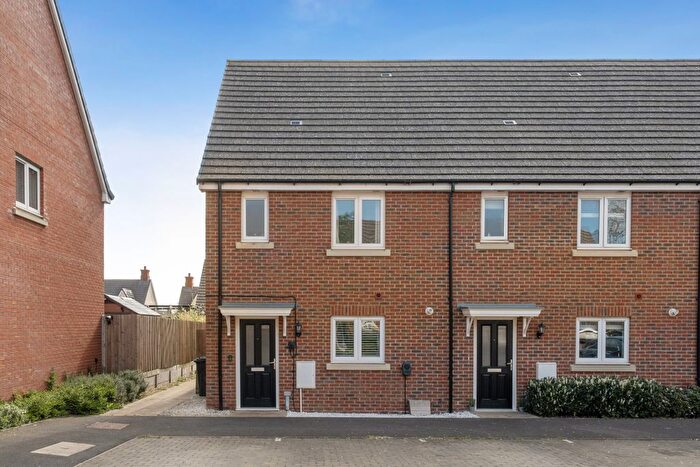
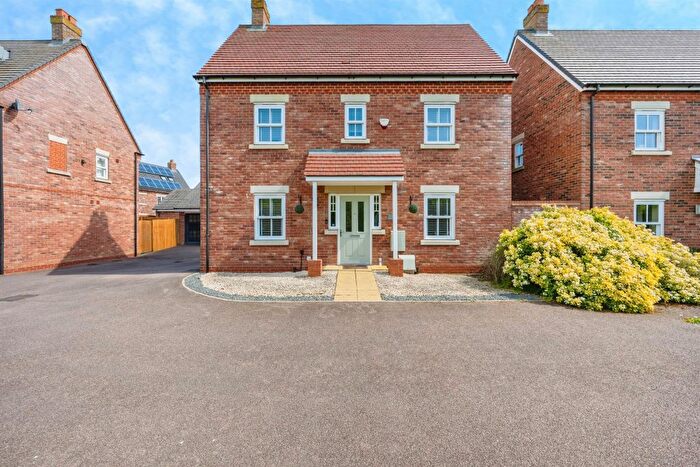
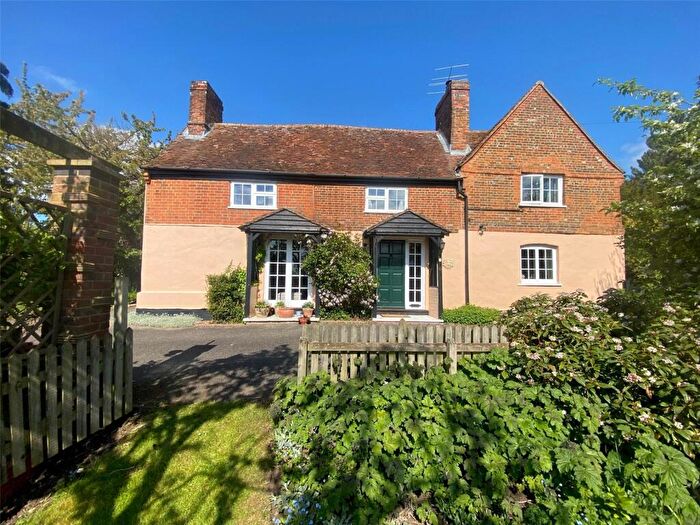
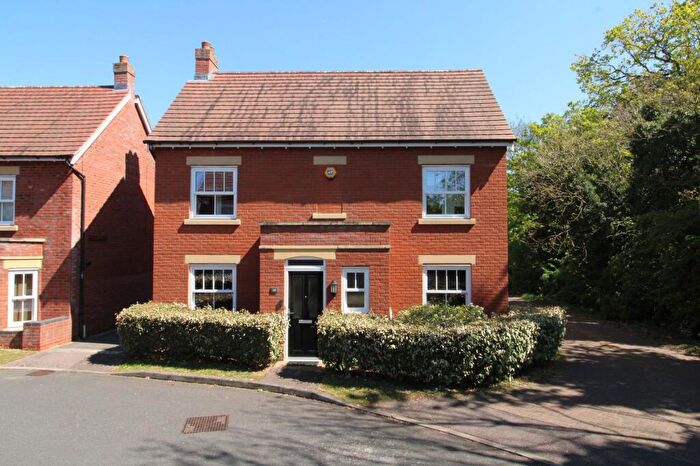
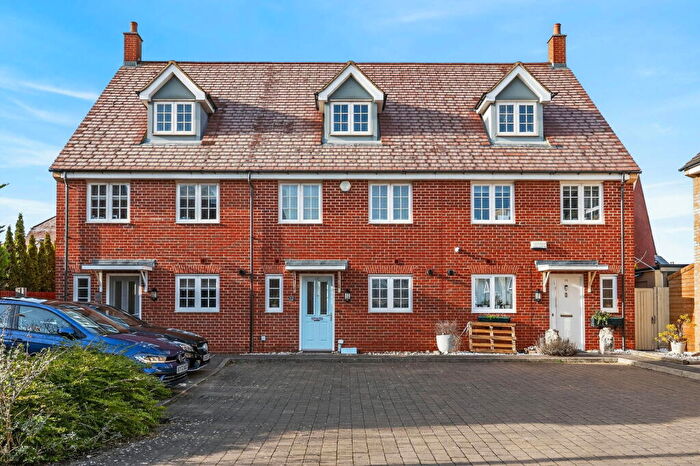
Properties for sale in Bedfordshire
![]()
If you are looking to sell your house, let it out, or receive a property valuation, an expert can help you.
Click the button below to get started.

Towns in Bedfordshire
Navigate through our locations to find the location of your next house in Bedfordshire, England for sale or to rent.
Transport in Bedfordshire
Please see below transportation links in this area:
-
 Stewartby Station
 -
Millbrook (Bedfordshire) Station
-
Kempston Hardwick Station
-
Flitwick Station
-
Lidlington Station
- FAQ
- Price Paid By Year
- Property Type Price
Frequently asked questions about Bedfordshire
What is the average price for a property for sale in Bedfordshire?
The average price for a property for sale in Bedfordshire is £370,856. This amount is 3% higher than the average price in England. There are more than 10,000 property listings for sale in Bedfordshire.
What locations have the most expensive properties for sale in Bedfordshire?
The locations with the most expensive properties for sale in Bedfordshire are Milton Keynes at an average of £643,029, Huntingdon at an average of £538,687 and Luton at an average of £438,575.
What locations have the most affordable properties for sale in Bedfordshire?
The locations with the most affordable properties for sale in Bedfordshire are Wellingborough at an average of £279,600, Rushden at an average of £306,181 and Arlesey at an average of £340,086.
Which train stations are available in or near Bedfordshire?
Some of the train stations available in or near Bedfordshire are Stewartby, Millbrook (Bedfordshire) and Kempston Hardwick.
Property Price Paid in Bedfordshire by Year
The average sold property price by year was:
| Year | Average Sold Price | Price Change |
Sold Properties
|
|---|---|---|---|
| 2026 | £383,483 | 2% |
133 Properties |
| 2025 | £375,854 | 1% |
6,116 Properties |
| 2024 | £371,875 | 2% |
6,508 Properties |
| 2023 | £363,905 | -2% |
5,594 Properties |
| 2022 | £371,647 | 5% |
7,598 Properties |
| 2021 | £354,124 | 5% |
10,489 Properties |
| 2020 | £337,288 | 4% |
7,825 Properties |
| 2019 | £324,848 | 0,4% |
8,764 Properties |
| 2018 | £323,697 | 3% |
8,710 Properties |
| 2017 | £314,256 | 9% |
9,072 Properties |
| 2016 | £284,592 | 8% |
9,450 Properties |
| 2015 | £263,185 | 8% |
9,488 Properties |
| 2014 | £242,721 | 8% |
9,201 Properties |
| 2013 | £224,127 | 2% |
7,524 Properties |
| 2012 | £220,534 | 2% |
6,024 Properties |
| 2011 | £216,592 | -2% |
5,962 Properties |
| 2010 | £221,576 | 9% |
5,865 Properties |
| 2009 | £202,361 | -6% |
5,507 Properties |
| 2008 | £214,875 | -1% |
4,885 Properties |
| 2007 | £216,562 | 6% |
9,998 Properties |
| 2006 | £203,378 | 5% |
10,880 Properties |
| 2005 | £192,489 | 6% |
8,484 Properties |
| 2004 | £181,711 | 8% |
10,149 Properties |
| 2003 | £167,309 | 14% |
9,813 Properties |
| 2002 | £144,524 | 15% |
11,340 Properties |
| 2001 | £122,383 | 11% |
10,628 Properties |
| 2000 | £108,599 | 14% |
9,368 Properties |
| 1999 | £92,927 | 11% |
10,676 Properties |
| 1998 | £82,778 | 9% |
9,231 Properties |
| 1997 | £75,229 | 9% |
9,634 Properties |
| 1996 | £68,487 | 2% |
8,348 Properties |
| 1995 | £67,426 | - |
7,033 Properties |
Property Price per Property Type in Bedfordshire
Here you can find historic sold price data in order to help with your property search.
The average Property Paid Price for specific property types in the last three years are:
| Property Type | Average Sold Price | Sold Properties |
|---|---|---|
| Semi Detached House | £361,687.00 | 5,898 Semi Detached Houses |
| Terraced House | £299,191.00 | 5,223 Terraced Houses |
| Detached House | £555,578.00 | 4,781 Detached Houses |
| Flat | £185,156.00 | 2,449 Flats |