
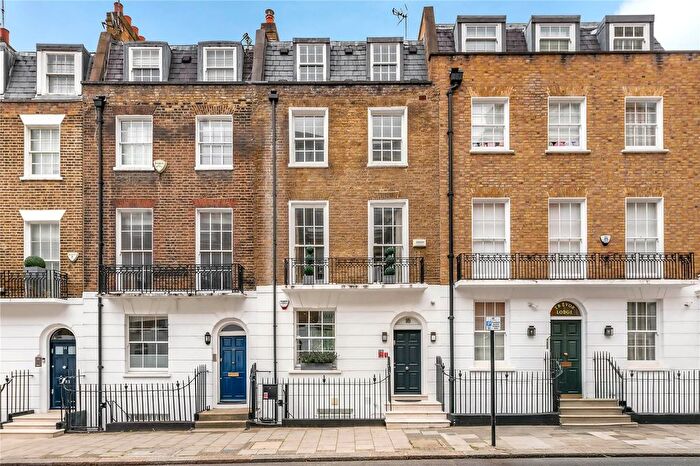
Houses for sale & to rent in City of Westminster London Borough, England
House Prices in City of Westminster London Borough
Properties in City of Westminster London Borough have
an average house price of
£1.82M
and had 7,571 Property Transactions
within the last 3 years.¹
City of Westminster London Borough is a location in
England with
105,056 households², where the most expensive property was sold for £82M.
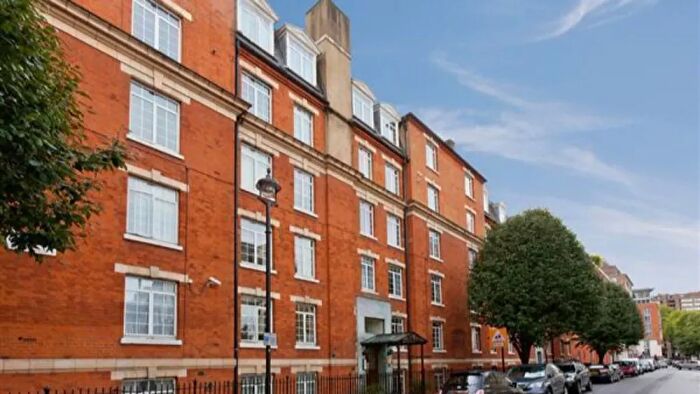
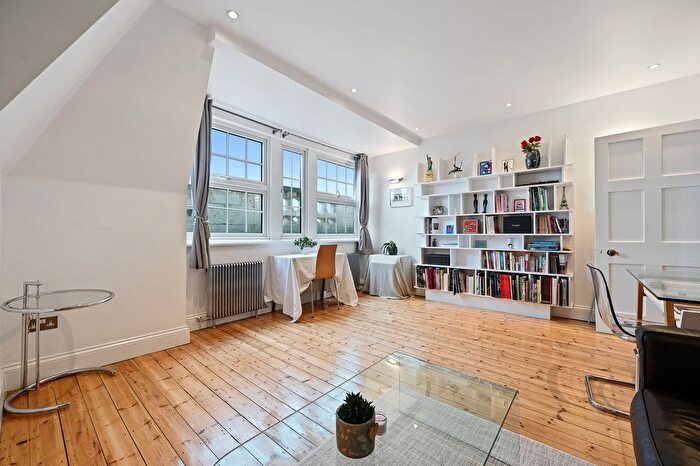
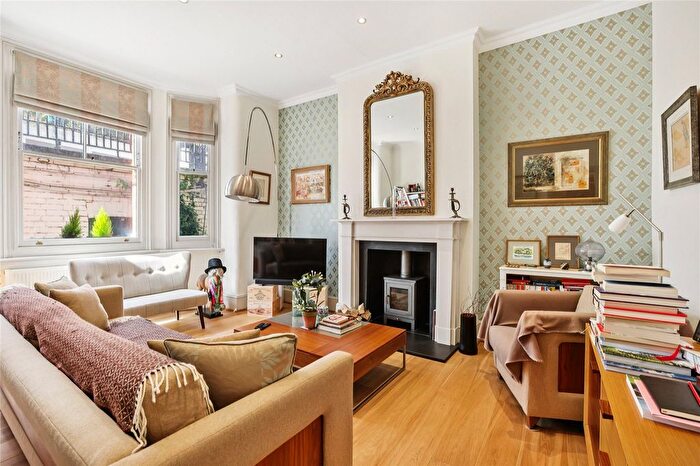
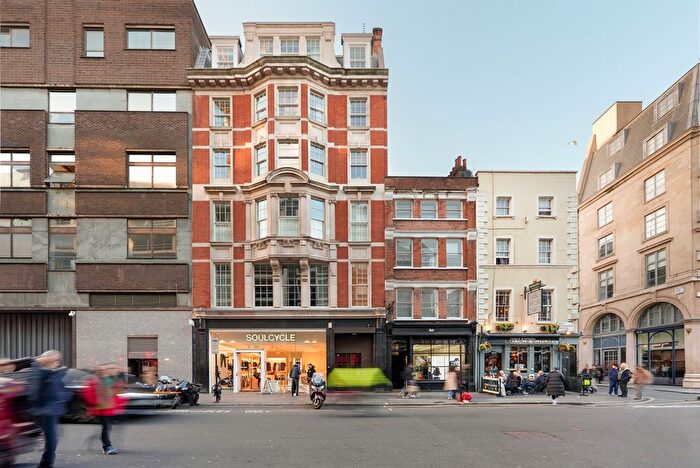
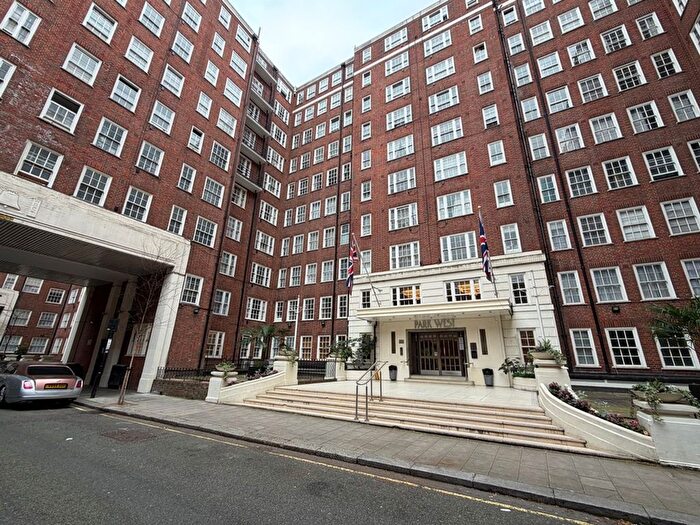
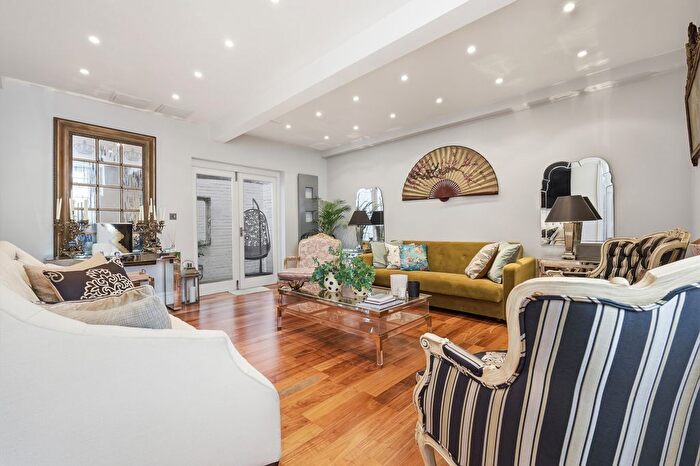
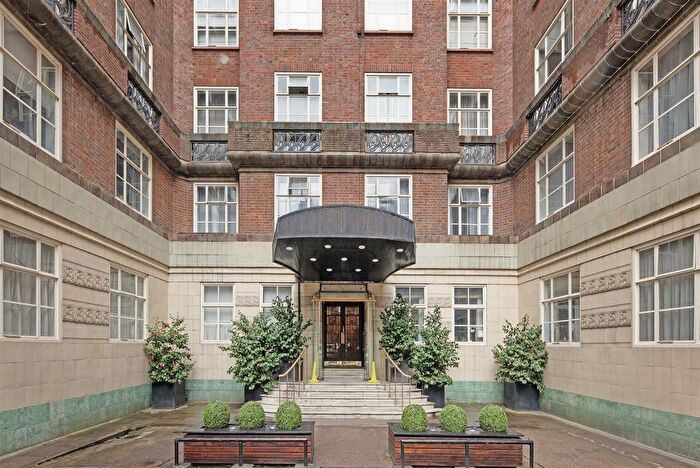
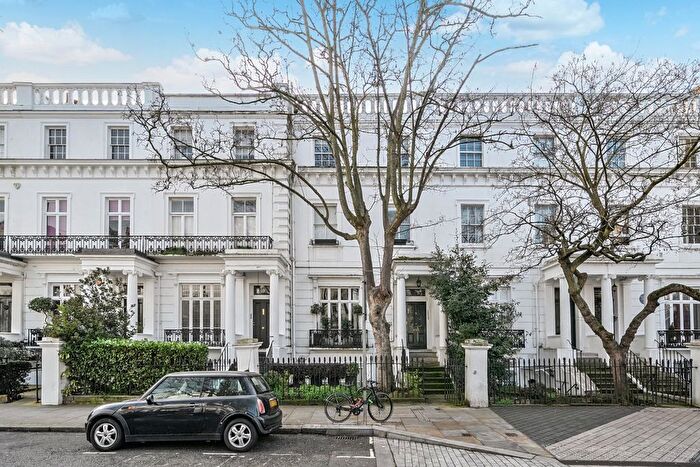
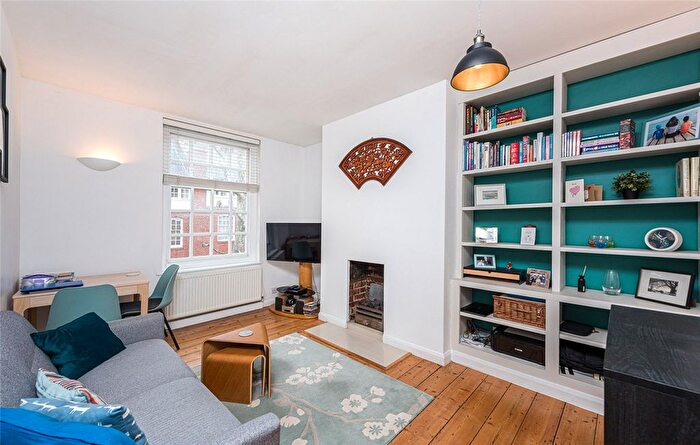
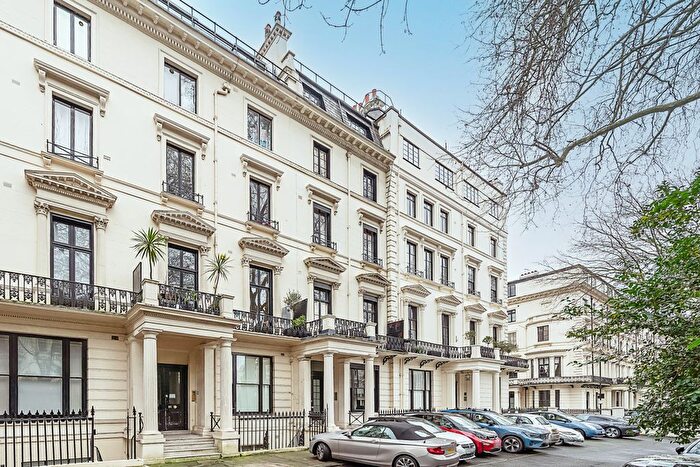
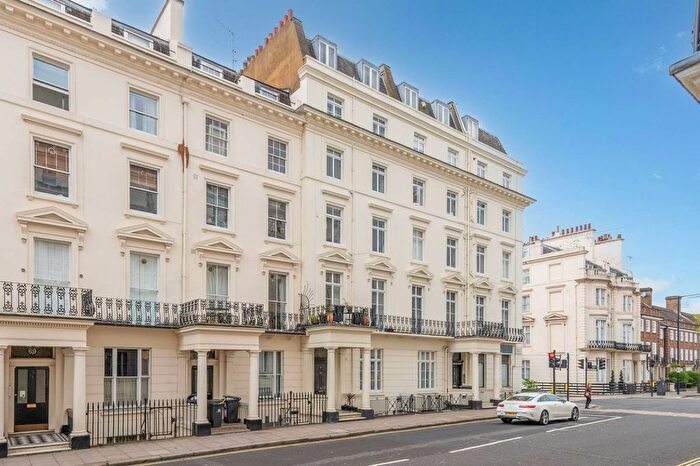
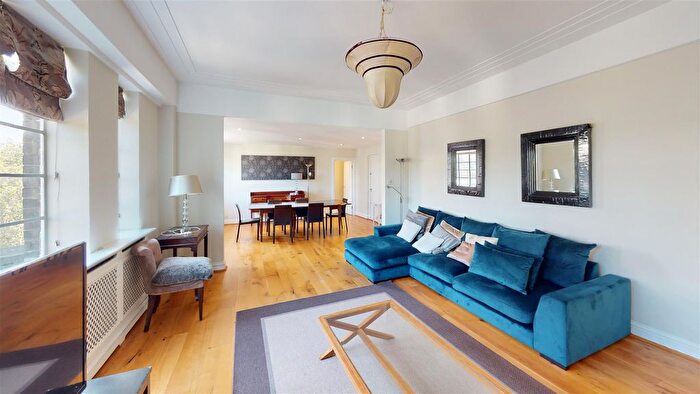
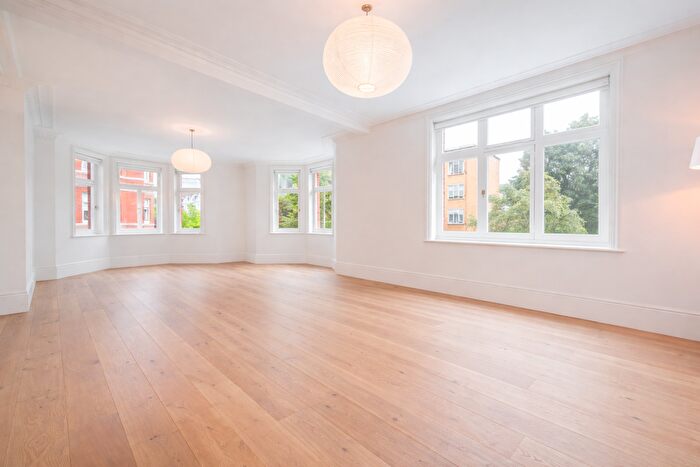
Properties for sale in City of Westminster London Borough
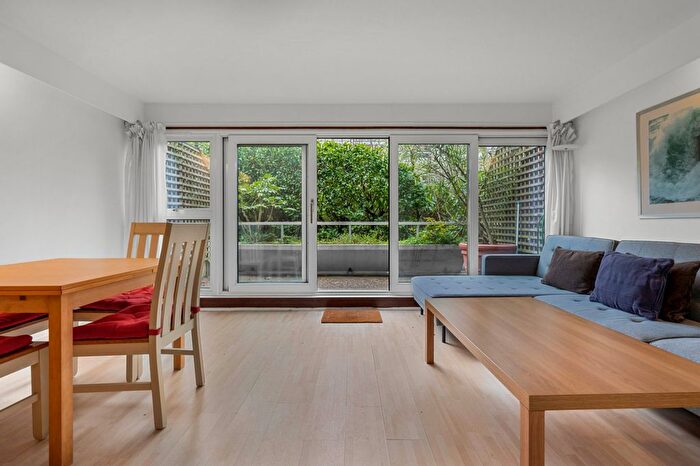
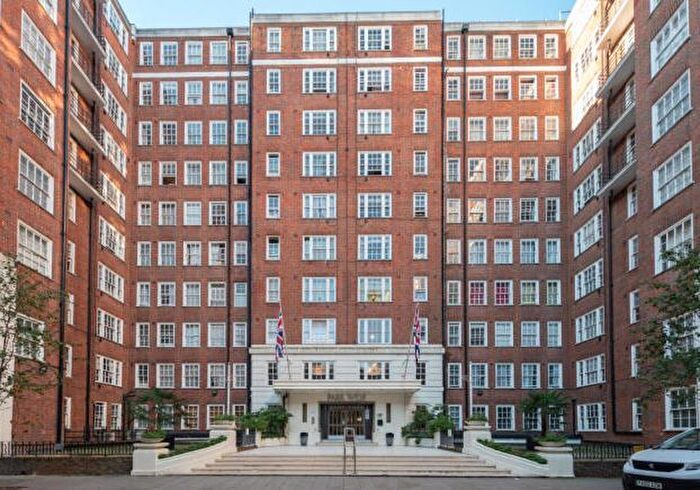
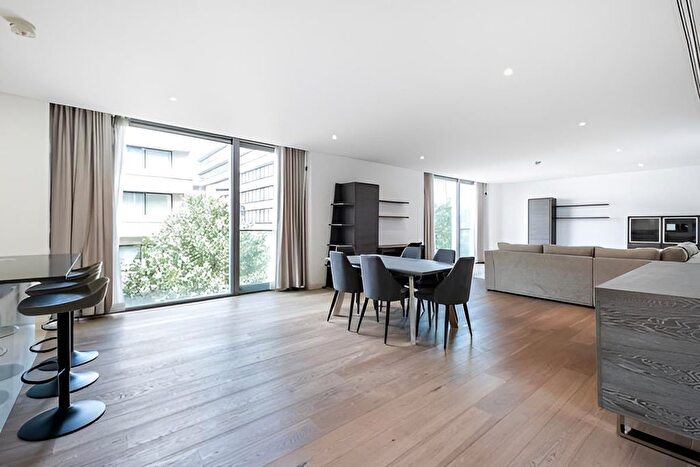
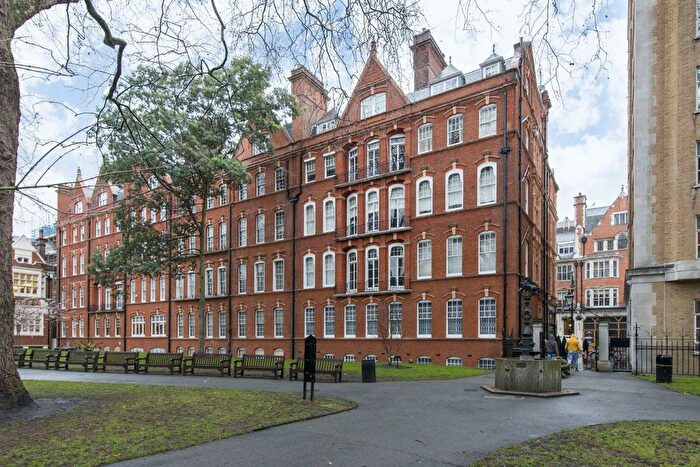
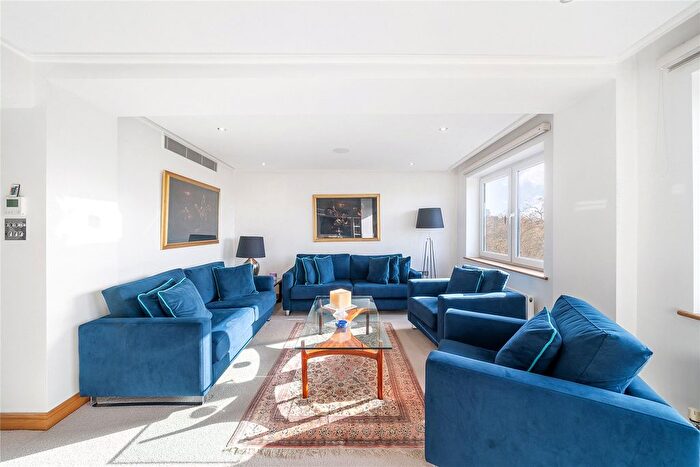
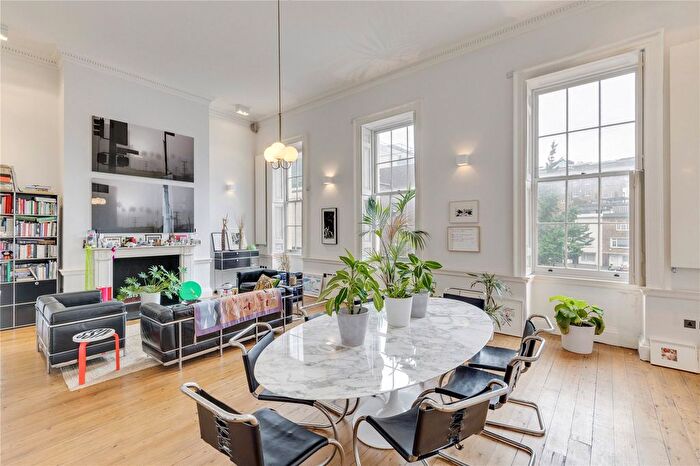
![]()
If you are looking to sell your house, let it out, or receive a property valuation, an expert can help you.
Click the button below to get started.
Towns in City of Westminster London Borough
Navigate through our locations to find the location of your next house in City of Westminster, England for sale or to rent.
Transport in City of Westminster London Borough
Please see below transportation links in this area:
-

 Bond Street Station
 -
Marble Arch Station
-
Oxford Circus Station
-
Green Park Station
-
Baker Street Station
-
Hyde Park Corner Station
-
Regents Park Station
-
Great Portland Street Station
-
 Marylebone Station
 -
Piccadilly Circus Station
- FAQ
- Price Paid By Year
- Property Type Price
Frequently asked questions about City of Westminster London Borough
What is the average price for a property for sale in City of Westminster London Borough?
The average price for a property for sale in City of Westminster London Borough is £1,815,862. This amount is 406% higher than the average price in England. There are more than 10,000 property listings for sale in City of Westminster London Borough.
Which train stations are available in or near City of Westminster London Borough?
The train station available in or near City of Westminster London Borough is Marylebone.
Which tube stations are available in or near City of Westminster London Borough?
Some of the tube stations available in or near City of Westminster London Borough are Bond Street, Marble Arch and Oxford Circus.
Property Price Paid in City of Westminster London Borough by Year
The average sold property price by year was:
| Year | Average Sold Price | Price Change |
Sold Properties
|
|---|---|---|---|
| 2026 | £1,469,401 | 5% |
43 Properties |
| 2025 | £1,401,004 | -35% |
1,873 Properties |
| 2024 | £1,889,832 | -7% |
2,889 Properties |
| 2023 | £2,024,910 | 2% |
2,766 Properties |
| 2022 | £1,987,307 | 12% |
3,183 Properties |
| 2021 | £1,749,913 | -14% |
3,359 Properties |
| 2020 | £2,002,641 | 6% |
2,413 Properties |
| 2019 | £1,876,242 | 0,3% |
2,781 Properties |
| 2018 | £1,870,097 | 6% |
2,702 Properties |
| 2017 | £1,756,110 | 8% |
3,284 Properties |
| 2016 | £1,615,055 | 10% |
3,439 Properties |
| 2015 | £1,452,693 | -3% |
3,669 Properties |
| 2014 | £1,498,169 | 13% |
4,059 Properties |
| 2013 | £1,299,972 | 12% |
3,817 Properties |
| 2012 | £1,146,095 | 16% |
3,249 Properties |
| 2011 | £957,578 | 14% |
3,295 Properties |
| 2010 | £822,954 | 10% |
3,594 Properties |
| 2009 | £740,055 | -4% |
2,884 Properties |
| 2008 | £771,781 | 10% |
2,777 Properties |
| 2007 | £692,005 | 15% |
5,439 Properties |
| 2006 | £591,412 | 8% |
6,356 Properties |
| 2005 | £545,273 | 8% |
4,997 Properties |
| 2004 | £500,701 | 9% |
5,092 Properties |
| 2003 | £458,094 | 4% |
5,117 Properties |
| 2002 | £440,758 | 7% |
6,403 Properties |
| 2001 | £409,616 | 9% |
5,890 Properties |
| 2000 | £374,336 | 18% |
6,377 Properties |
| 1999 | £308,183 | 9% |
6,772 Properties |
| 1998 | £281,725 | 19% |
5,518 Properties |
| 1997 | £228,472 | 17% |
6,535 Properties |
| 1996 | £190,455 | 4% |
4,825 Properties |
| 1995 | £183,284 | - |
4,027 Properties |
Property Price per Property Type in City of Westminster London Borough
Here you can find historic sold price data in order to help with your property search.
The average Property Paid Price for specific property types in the last three years are:
| Property Type | Average Sold Price | Sold Properties |
|---|---|---|
| Semi Detached House | £6,007,429.00 | 72 Semi Detached Houses |
| Terraced House | £3,550,925.00 | 832 Terraced Houses |
| Detached House | £7,641,267.00 | 50 Detached Houses |
| Flat | £1,508,073.00 | 6,617 Flats |