
Houses for sale & to rent in County of Herefordshire, England
House Prices in County of Herefordshire
Properties in County of Herefordshire have
an average house price of
£331k
and had 7,032 Property Transactions
within the last 3 years.¹
County of Herefordshire is a location in
England with
78,206 households², where the most expensive property was sold for £2.45M.
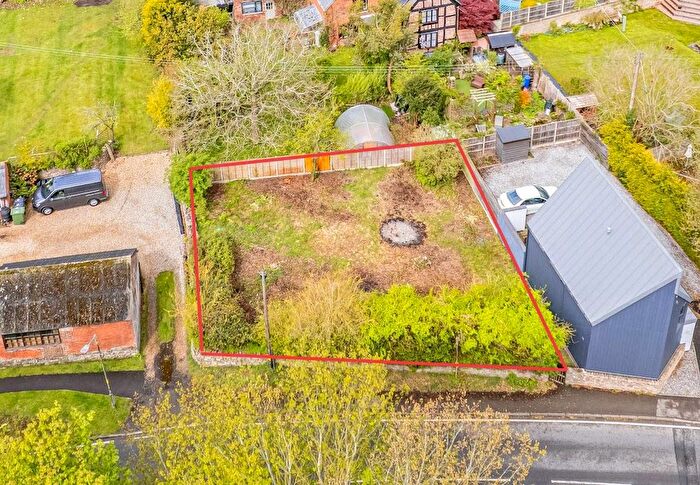
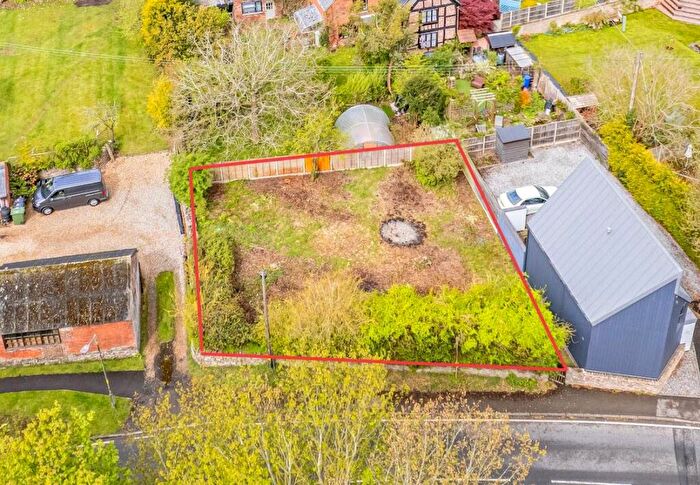
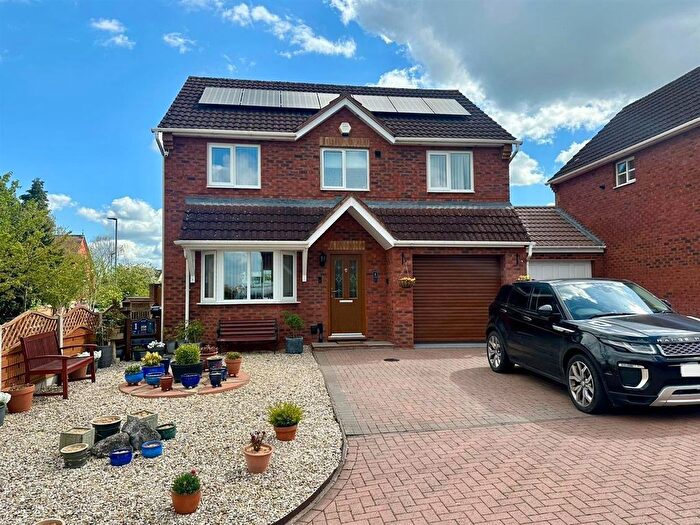
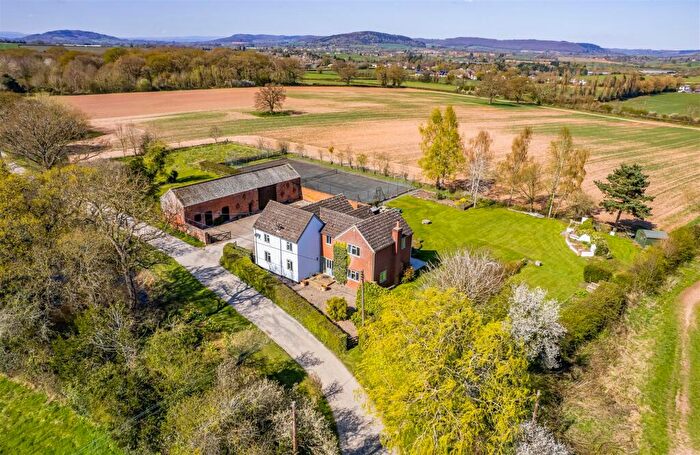
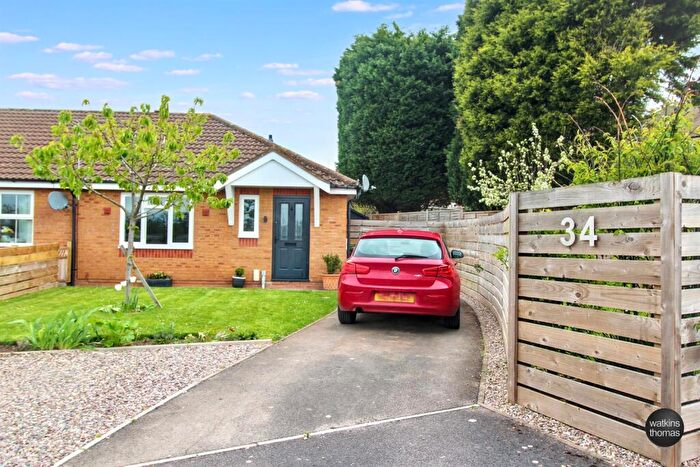
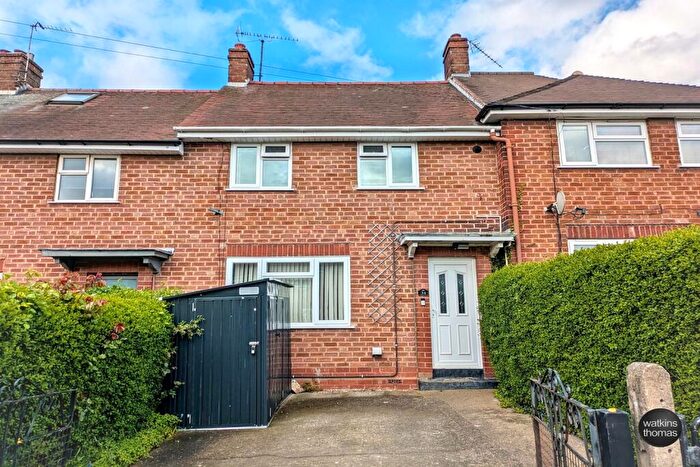
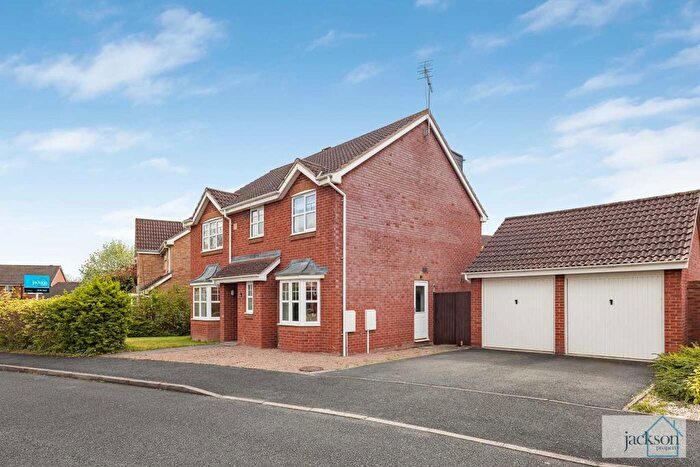
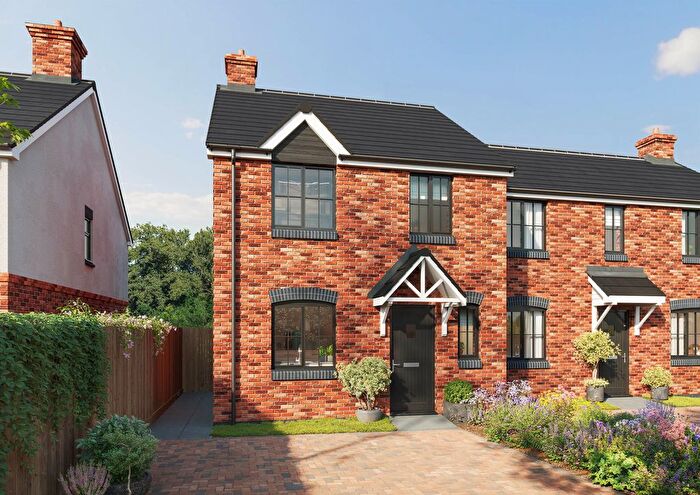
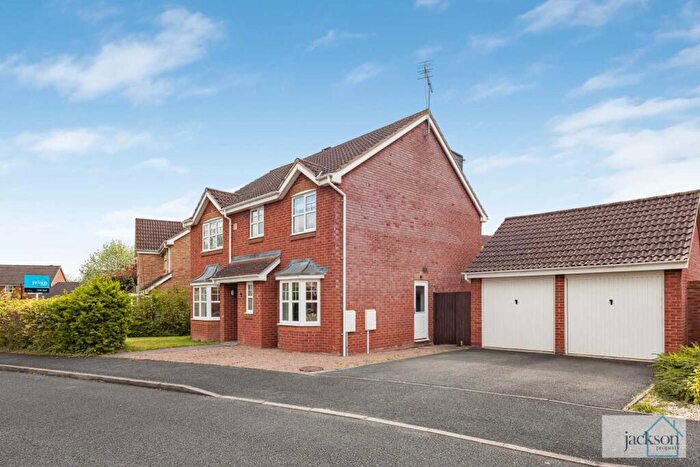
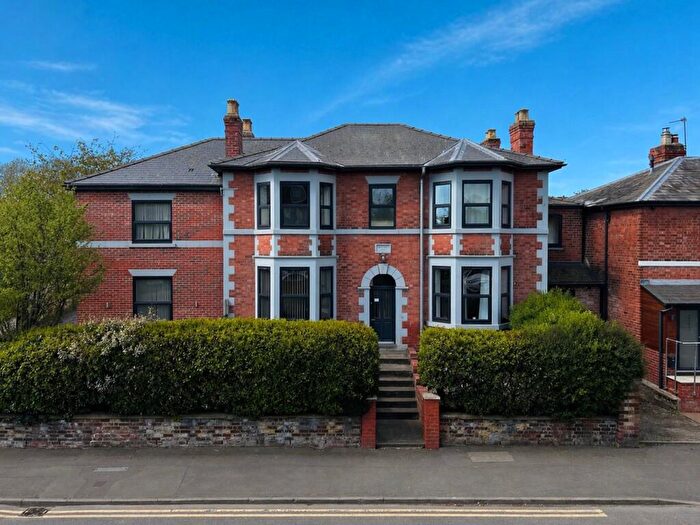
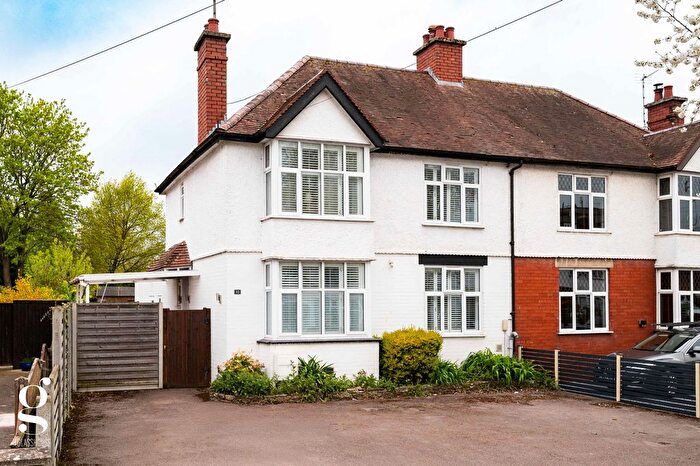
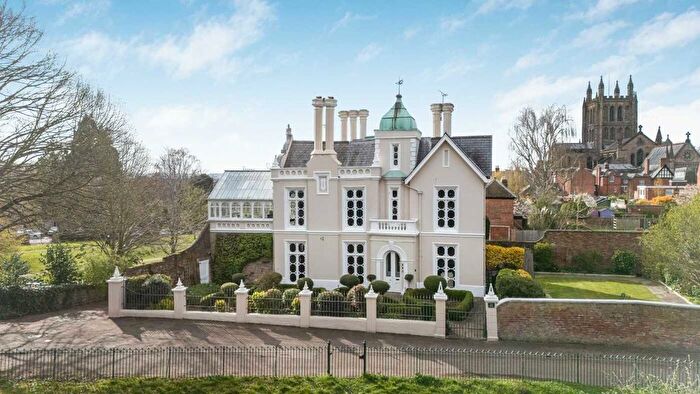
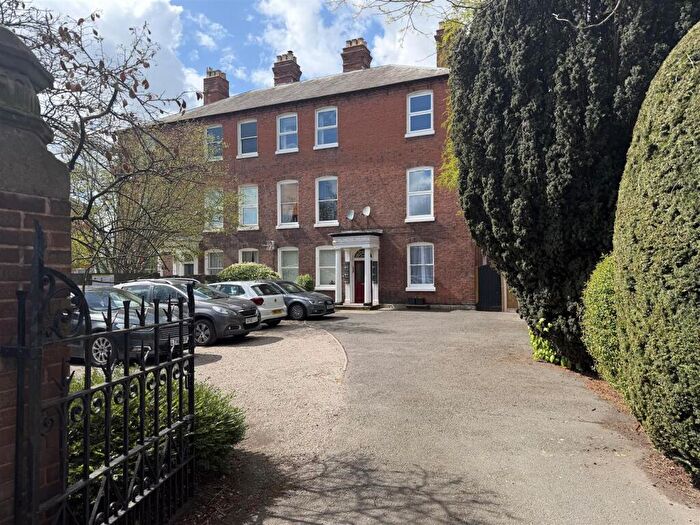
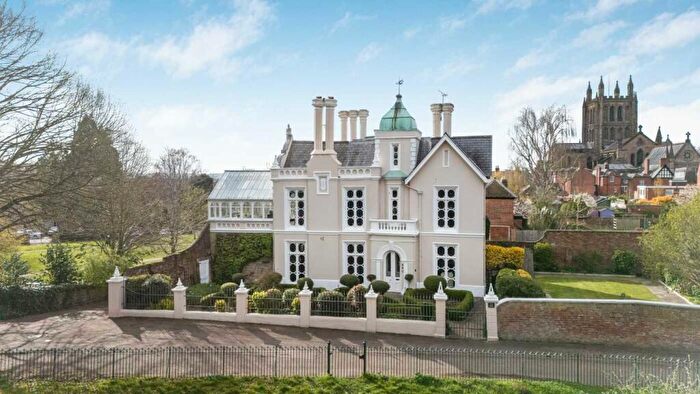
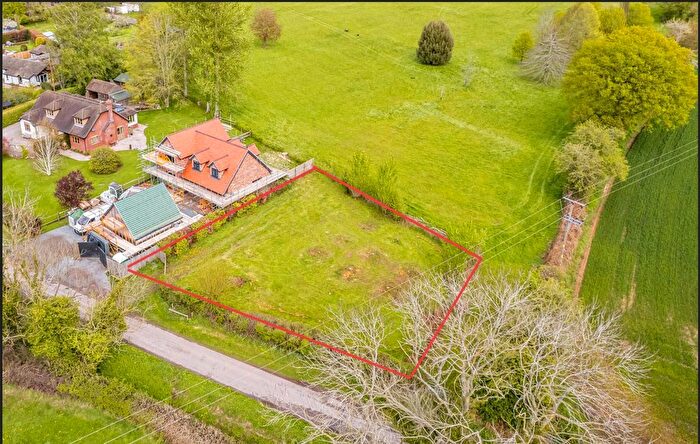
Properties for sale in County of Herefordshire
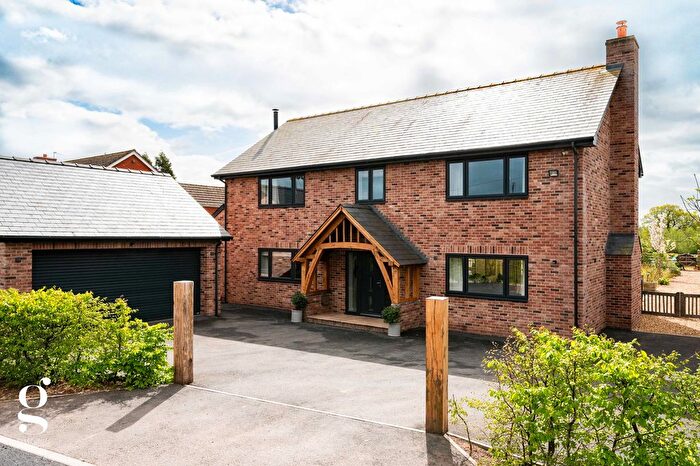
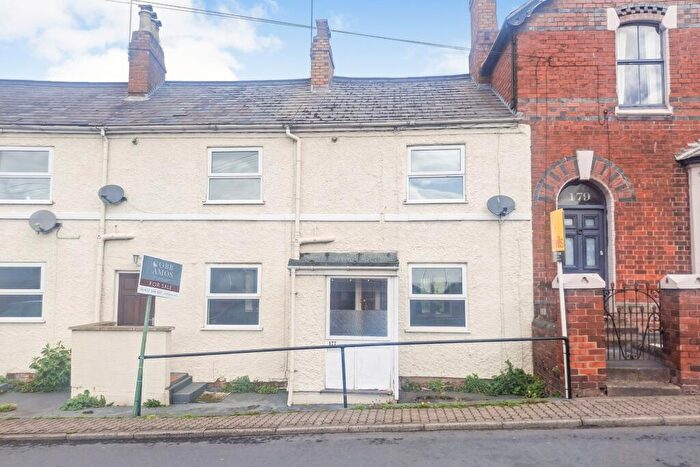
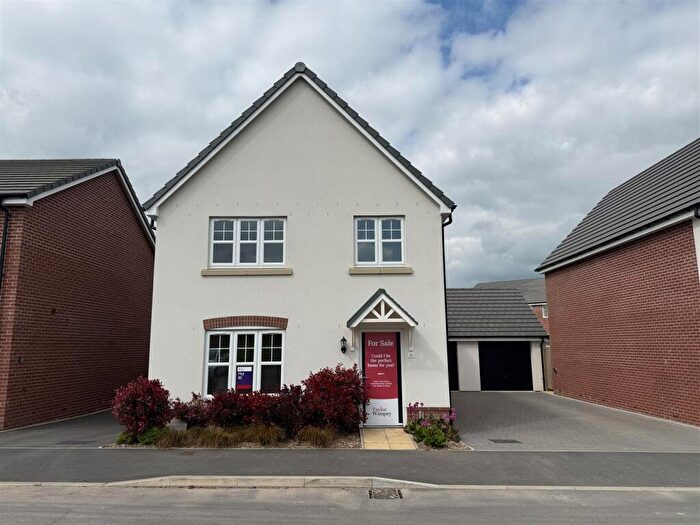
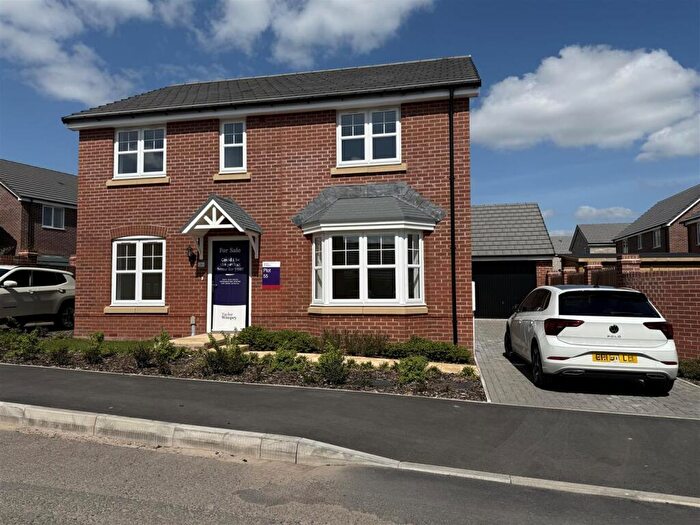
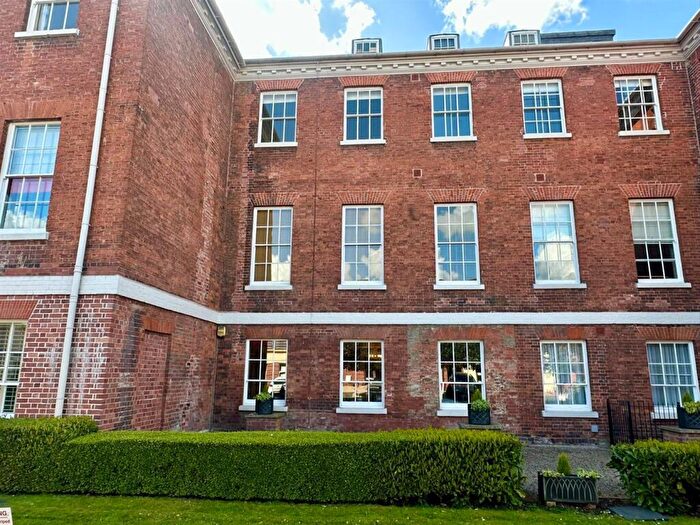
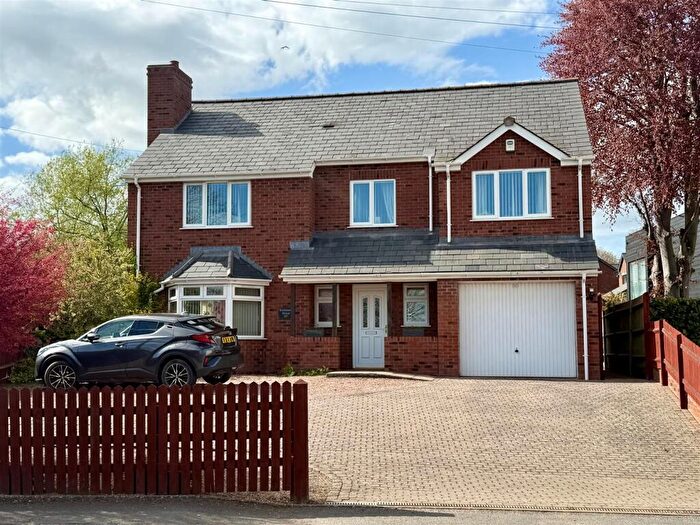
![]()
If you are looking to sell your house, let it out, or receive a property valuation, an expert can help you.
Click the button below to get started.
Towns in County of Herefordshire
Navigate through our locations to find the location of your next house in County of Herefordshire, England for sale or to rent.
Transport in County of Herefordshire
Please see below transportation links in this area:

- FAQ
- Price Paid By Year
- Property Type Price
Frequently asked questions about County of Herefordshire
What is the average price for a property for sale in County of Herefordshire?
The average price for a property for sale in County of Herefordshire is £331,364. This amount is 8% lower than the average price in England. There are more than 10,000 property listings for sale in County of Herefordshire.
What locations have the most expensive properties for sale in County of Herefordshire?
The locations with the most expensive properties for sale in County of Herefordshire are Tenbury Wells at an average of £658,000, Newent at an average of £653,750 and Presteigne at an average of £579,245.
What locations have the most affordable properties for sale in County of Herefordshire?
The locations with the most affordable properties for sale in County of Herefordshire are Kington at an average of £284,653, Leominster at an average of £312,171 and Hereford at an average of £313,119.
Which train stations are available in or near County of Herefordshire?
Some of the train stations available in or near County of Herefordshire are Hereford, Leominster and Ledbury.
Property Price Paid in County of Herefordshire by Year
The average sold property price by year was:
| Year | Average Sold Price | Price Change |
Sold Properties
|
|---|---|---|---|
| 2026 | £303,741 | -6% |
56 Properties |
| 2025 | £322,401 | -5% |
2,257 Properties |
| 2024 | £339,644 | 2% |
2,488 Properties |
| 2023 | £331,890 | 0,2% |
2,231 Properties |
| 2022 | £331,385 | 7% |
2,814 Properties |
| 2021 | £307,227 | 4% |
3,861 Properties |
| 2020 | £294,253 | 11% |
2,677 Properties |
| 2019 | £262,746 | 0,4% |
3,055 Properties |
| 2018 | £261,697 | 5% |
3,109 Properties |
| 2017 | £248,303 | 5% |
3,172 Properties |
| 2016 | £235,953 | 1% |
3,158 Properties |
| 2015 | £233,756 | 5% |
2,950 Properties |
| 2014 | £221,651 | 2% |
2,990 Properties |
| 2013 | £216,824 | 2% |
2,429 Properties |
| 2012 | £212,933 | -2% |
2,208 Properties |
| 2011 | £216,313 | -4% |
2,102 Properties |
| 2010 | £224,574 | 8% |
2,111 Properties |
| 2009 | £207,122 | -8% |
2,207 Properties |
| 2008 | £224,593 | 1% |
1,873 Properties |
| 2007 | £221,335 | 5% |
3,836 Properties |
| 2006 | £211,325 | 7% |
4,012 Properties |
| 2005 | £197,573 | 3% |
3,170 Properties |
| 2004 | £190,816 | 15% |
3,590 Properties |
| 2003 | £162,336 | 16% |
3,857 Properties |
| 2002 | £136,705 | 15% |
4,266 Properties |
| 2001 | £115,822 | 11% |
4,275 Properties |
| 2000 | £103,065 | 11% |
3,843 Properties |
| 1999 | £91,446 | 9% |
4,196 Properties |
| 1998 | £82,992 | 9% |
3,583 Properties |
| 1997 | £75,241 | 7% |
3,459 Properties |
| 1996 | £69,754 | 3% |
3,186 Properties |
| 1995 | £67,343 | - |
2,471 Properties |
Property Price per Property Type in County of Herefordshire
Here you can find historic sold price data in order to help with your property search.
The average Property Paid Price for specific property types in the last three years are:
| Property Type | Average Sold Price | Sold Properties |
|---|---|---|
| Semi Detached House | £275,654.00 | 1,883 Semi Detached Houses |
| Terraced House | £221,105.00 | 1,561 Terraced Houses |
| Detached House | £465,760.00 | 2,939 Detached Houses |
| Flat | £149,584.00 | 649 Flats |