
Houses for sale & to rent in Derbyshire, England
House Prices in Derbyshire
Properties in Derbyshire have
an average house price of
£251k
and had 34,264 Property Transactions
within the last 3 years.¹
Derbyshire is a location in
England with
336,211 households², where the most expensive property was sold for £3.78M.
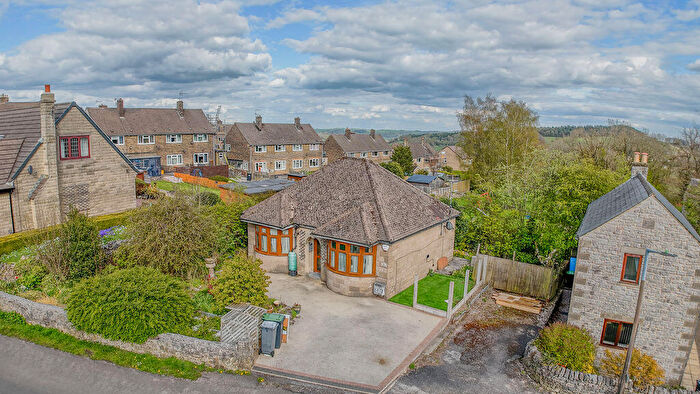
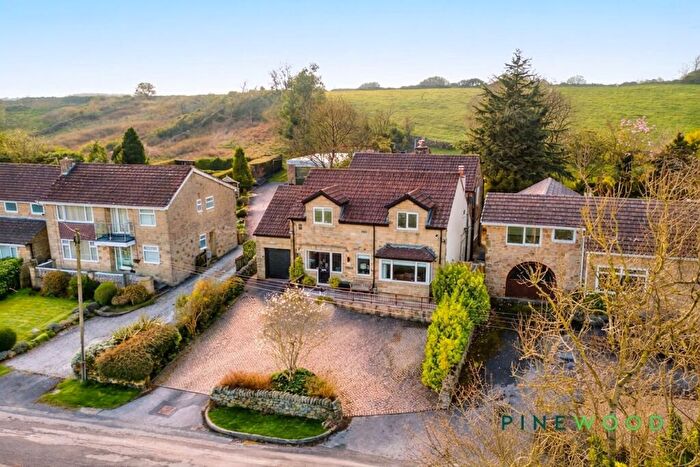
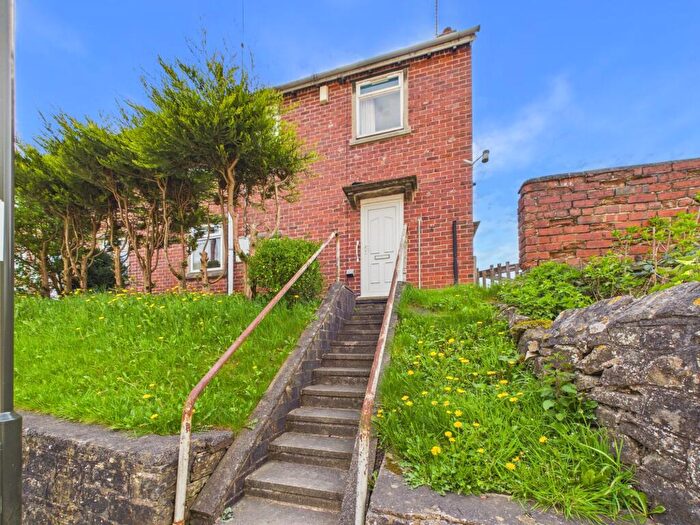
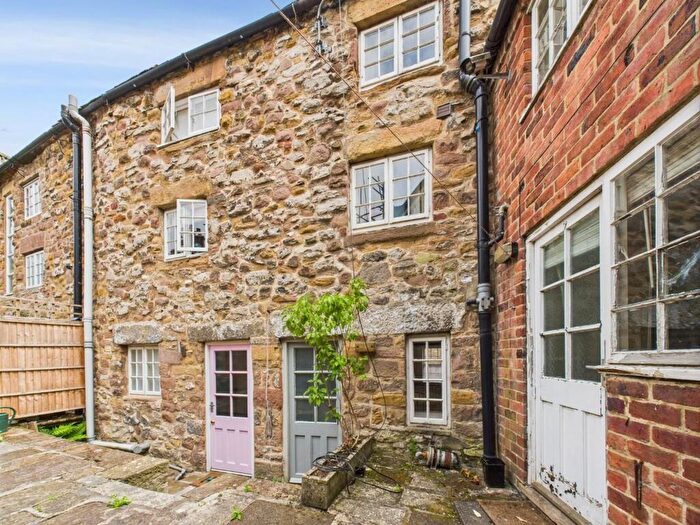
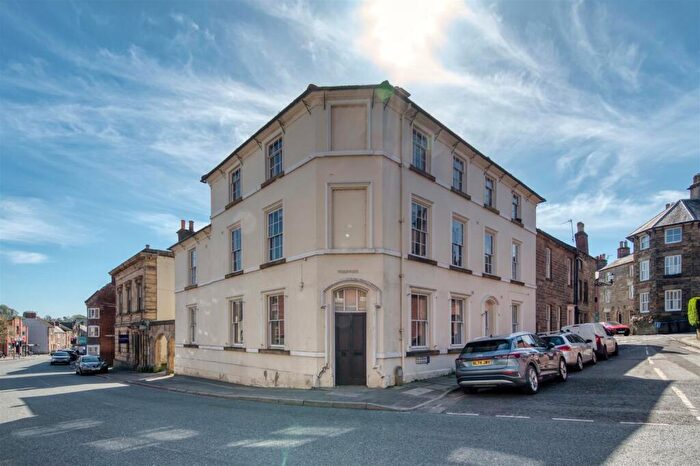
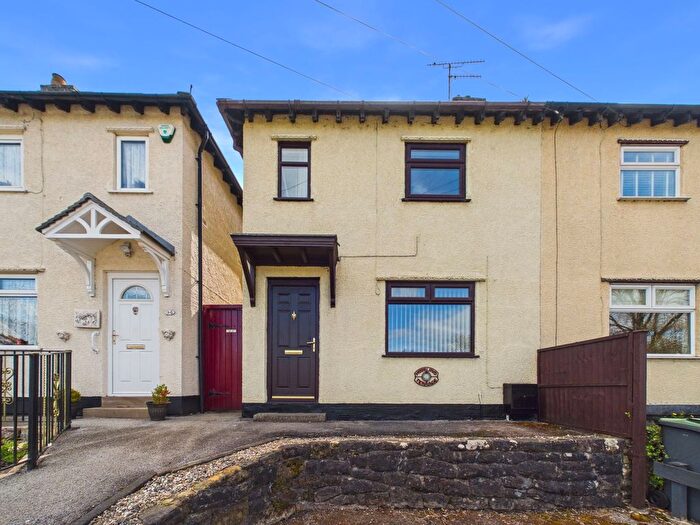
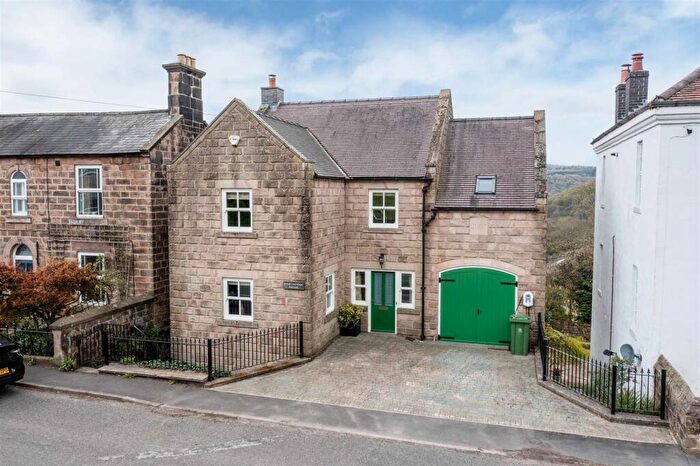
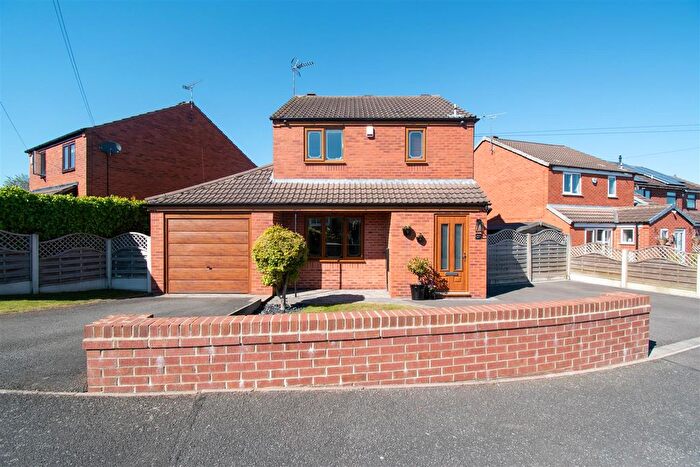
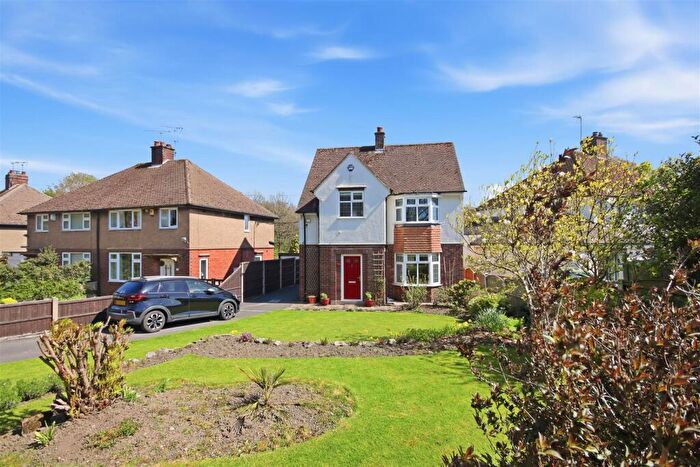
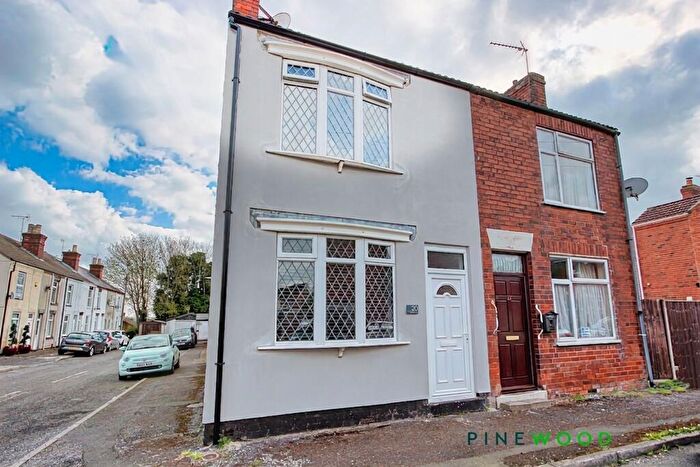
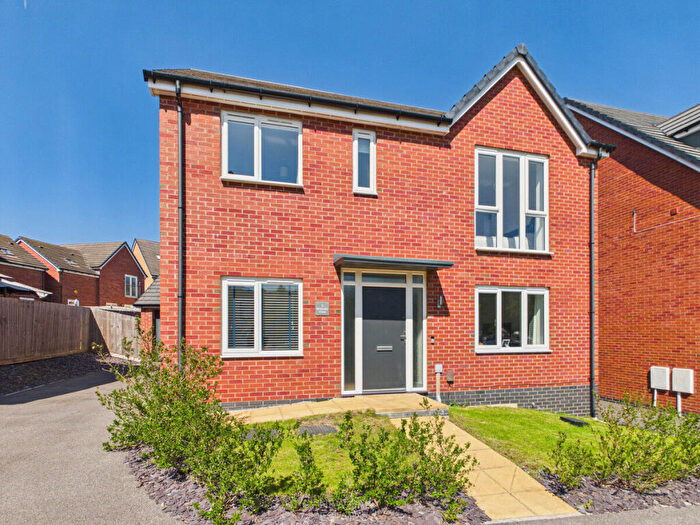
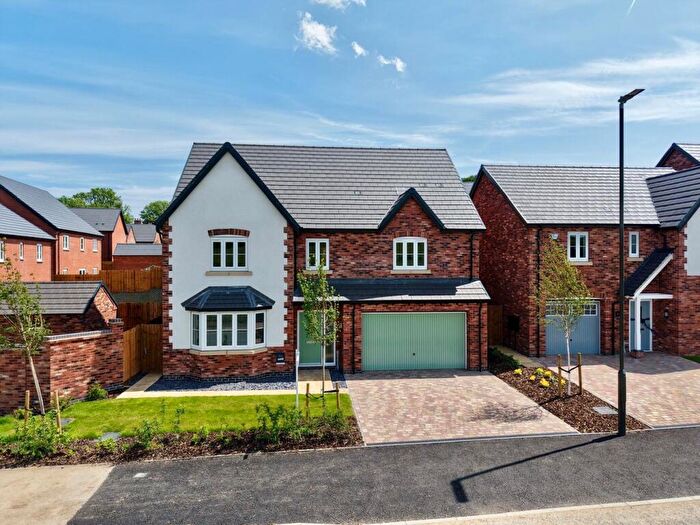
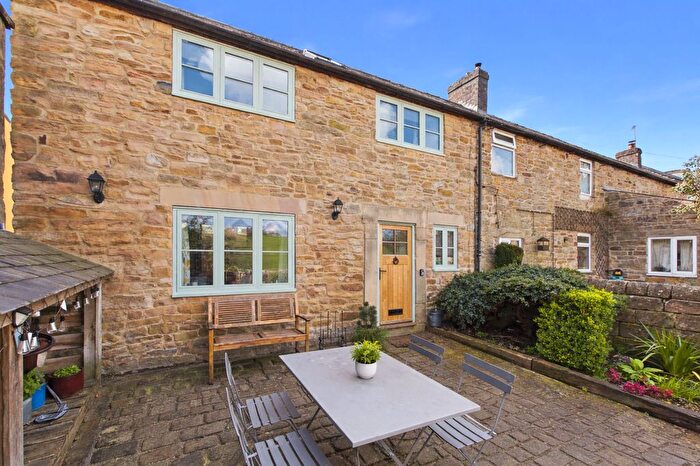
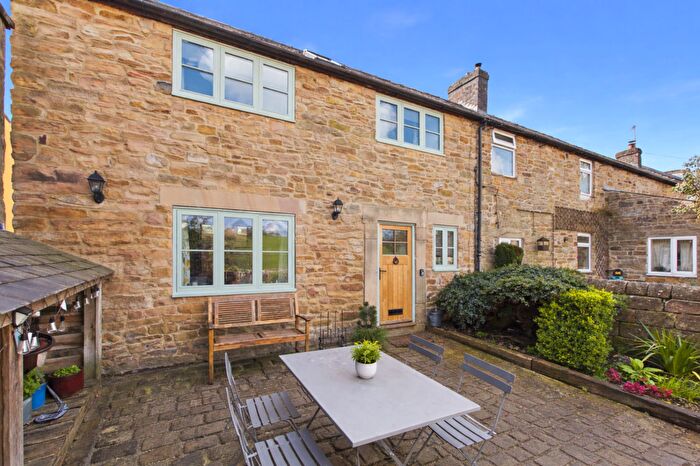
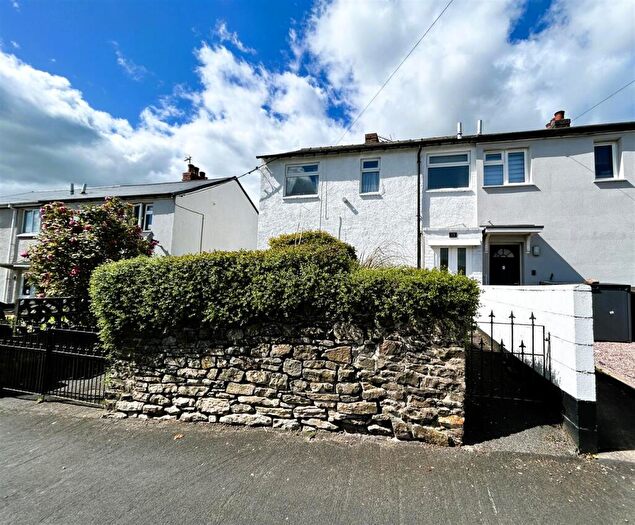
Properties for sale in Derbyshire
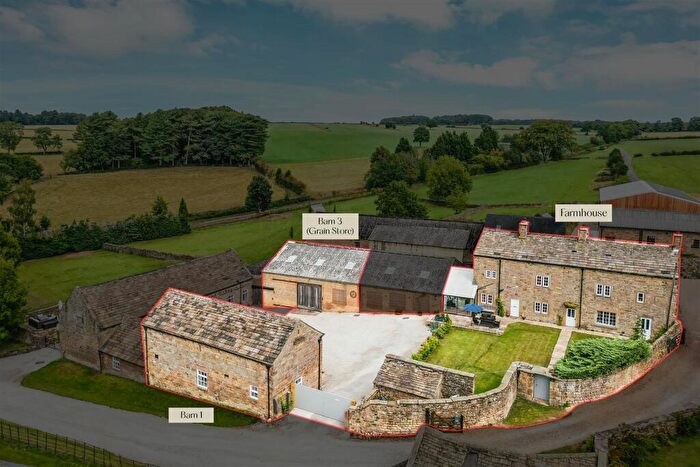
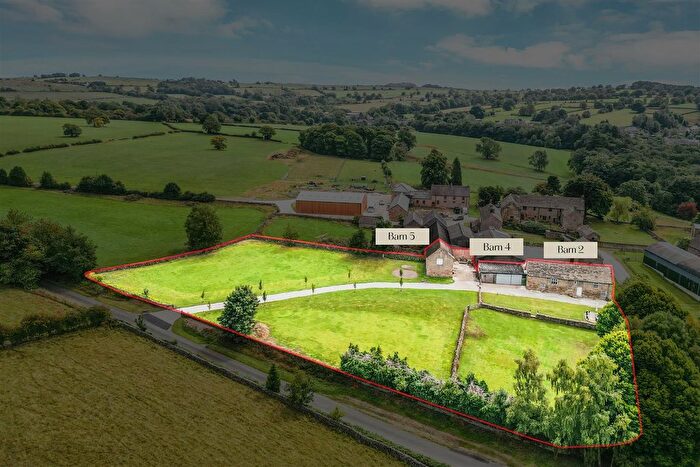
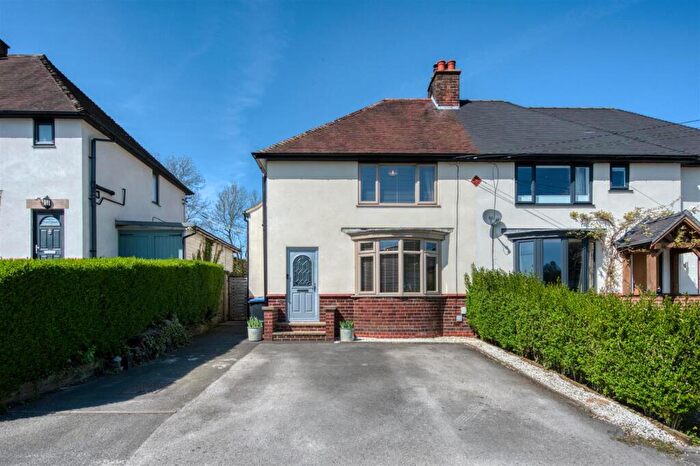

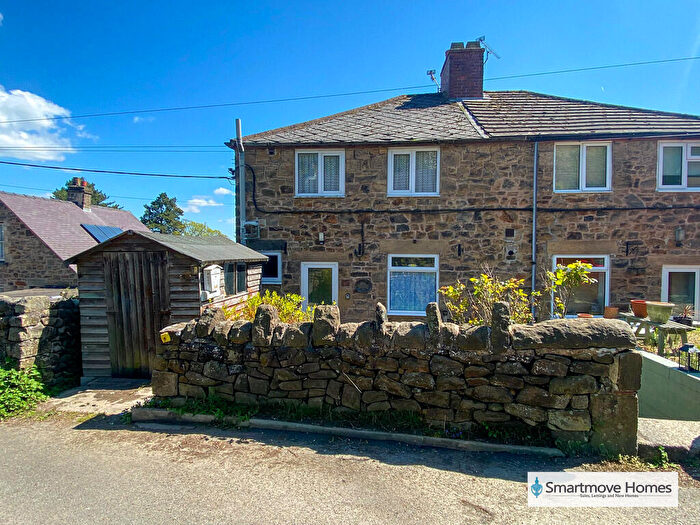
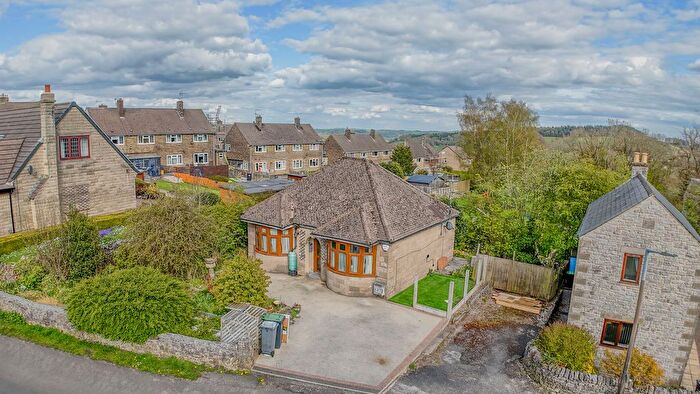
![]()
If you are looking to sell your house, let it out, or receive a property valuation, an expert can help you.
Click the button below to get started.


Towns in Derbyshire
Navigate through our locations to find the location of your next house in Derbyshire, England for sale or to rent.
Transport in Derbyshire
Please see below transportation links in this area:

- FAQ
- Price Paid By Year
- Property Type Price
Frequently asked questions about Derbyshire
What is the average price for a property for sale in Derbyshire?
The average price for a property for sale in Derbyshire is £251,261. This amount is 30% lower than the average price in England. There are more than 10,000 property listings for sale in Derbyshire.
What locations have the most expensive properties for sale in Derbyshire?
The locations with the most expensive properties for sale in Derbyshire are Uttoxeter at an average of £925,000, Hope Valley at an average of £463,375 and Bakewell at an average of £457,806.
What locations have the most affordable properties for sale in Derbyshire?
The locations with the most affordable properties for sale in Derbyshire are Mansfield at an average of £153,803, Worksop at an average of £164,174 and Heanor at an average of £199,252.
Which train stations are available in or near Derbyshire?
Some of the train stations available in or near Derbyshire are Cromford, Matlock Bath and Whatstandwell.
Property Price Paid in Derbyshire by Year
The average sold property price by year was:
| Year | Average Sold Price | Price Change |
Sold Properties
|
|---|---|---|---|
| 2026 | £239,047 | -7% |
808 Properties |
| 2025 | £255,274 | 2% |
11,173 Properties |
| 2024 | £251,107 | 1% |
11,707 Properties |
| 2023 | £248,125 | -0,4% |
10,576 Properties |
| 2022 | £249,124 | 5% |
13,724 Properties |
| 2021 | £237,095 | 7% |
16,999 Properties |
| 2020 | £220,510 | 6% |
13,270 Properties |
| 2019 | £208,191 | 2% |
15,321 Properties |
| 2018 | £203,559 | 5% |
15,087 Properties |
| 2017 | £193,536 | 5% |
14,940 Properties |
| 2016 | £184,823 | 4% |
14,869 Properties |
| 2015 | £178,169 | 6% |
14,087 Properties |
| 2014 | £168,020 | 3% |
13,346 Properties |
| 2013 | £162,419 | 0,5% |
11,014 Properties |
| 2012 | £161,681 | 3% |
9,097 Properties |
| 2011 | £156,767 | -5% |
8,816 Properties |
| 2010 | £164,094 | 4% |
9,093 Properties |
| 2009 | £158,255 | -2% |
8,509 Properties |
| 2008 | £161,673 | -3% |
8,746 Properties |
| 2007 | £167,277 | 6% |
16,566 Properties |
| 2006 | £157,866 | 5% |
17,480 Properties |
| 2005 | £149,478 | 7% |
14,138 Properties |
| 2004 | £139,240 | 16% |
16,282 Properties |
| 2003 | £116,881 | 20% |
16,761 Properties |
| 2002 | £93,282 | 16% |
18,625 Properties |
| 2001 | £78,738 | 9% |
16,752 Properties |
| 2000 | £71,607 | 6% |
15,265 Properties |
| 1999 | £67,506 | 7% |
15,704 Properties |
| 1998 | £62,762 | 5% |
13,637 Properties |
| 1997 | £59,897 | 6% |
13,976 Properties |
| 1996 | £56,072 | 4% |
12,671 Properties |
| 1995 | £53,679 | - |
10,580 Properties |
Property Price per Property Type in Derbyshire
Here you can find historic sold price data in order to help with your property search.
The average Property Paid Price for specific property types in the last three years are:
| Property Type | Average Sold Price | Sold Properties |
|---|---|---|
| Semi Detached House | £216,252.00 | 12,773 Semi Detached Houses |
| Terraced House | £174,564.00 | 9,288 Terraced Houses |
| Detached House | £379,711.00 | 10,420 Detached Houses |
| Flat | £150,917.00 | 1,783 Flats |