
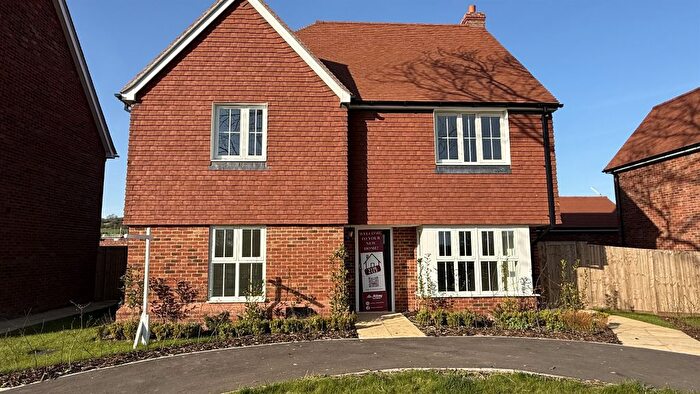
Houses for sale & to rent in Kent, England
House Prices in Kent
Properties in Kent have
an average house price of
£393k
and had 62,308 Property Transactions
within the last 3 years.¹
Kent is a location in
England with
604,861 households², where the most expensive property was sold for £10M.
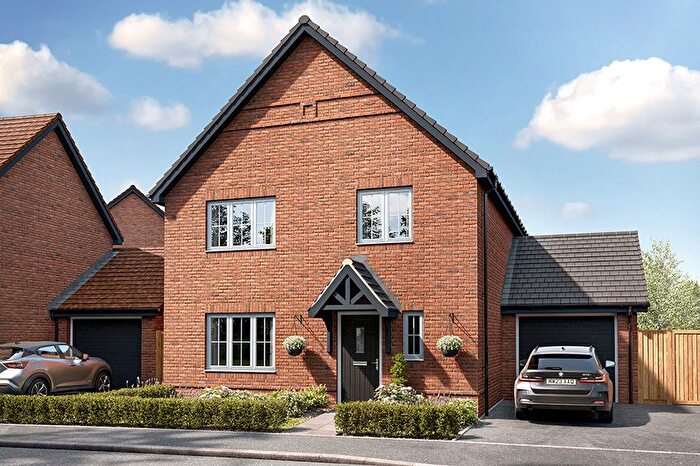
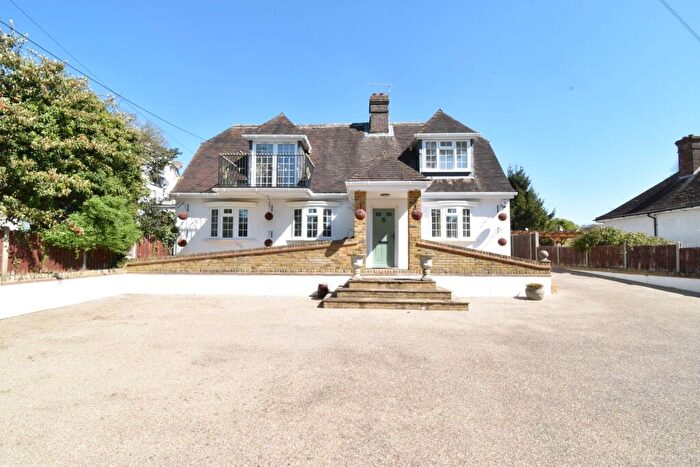
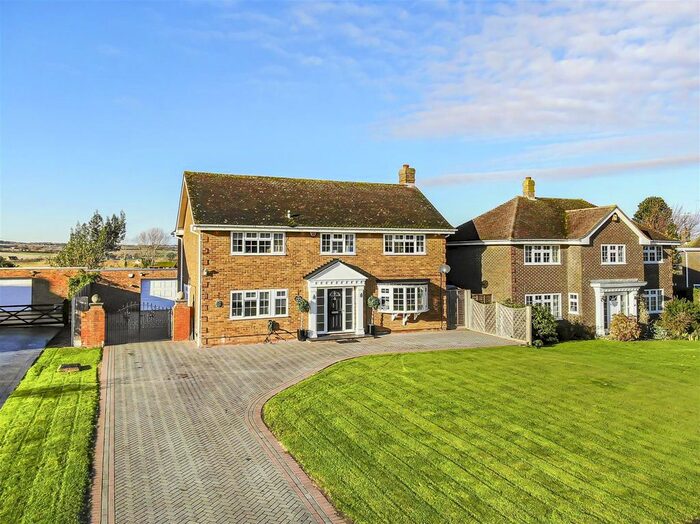
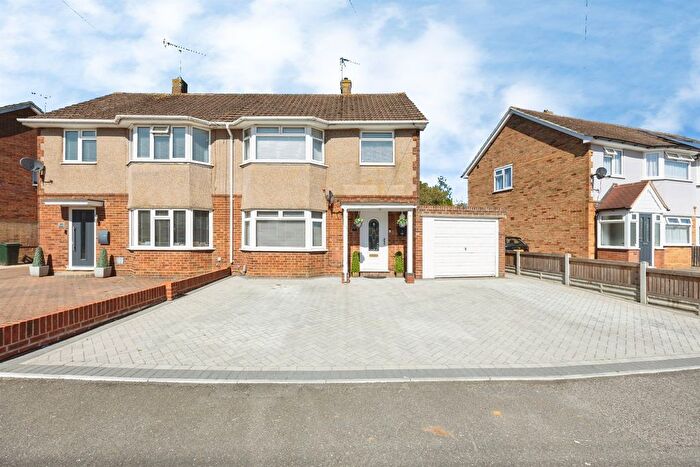
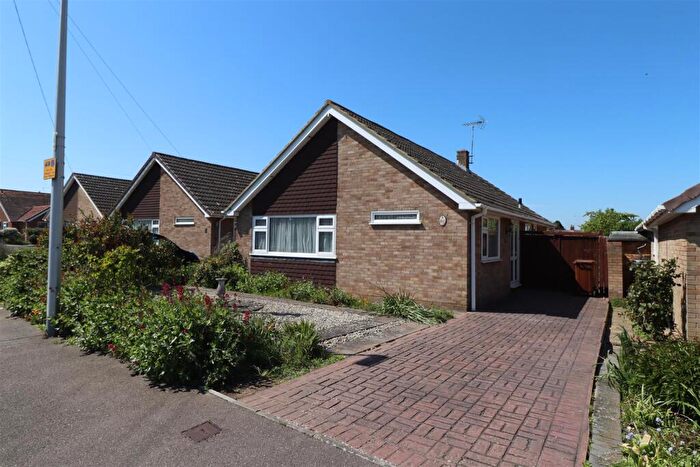
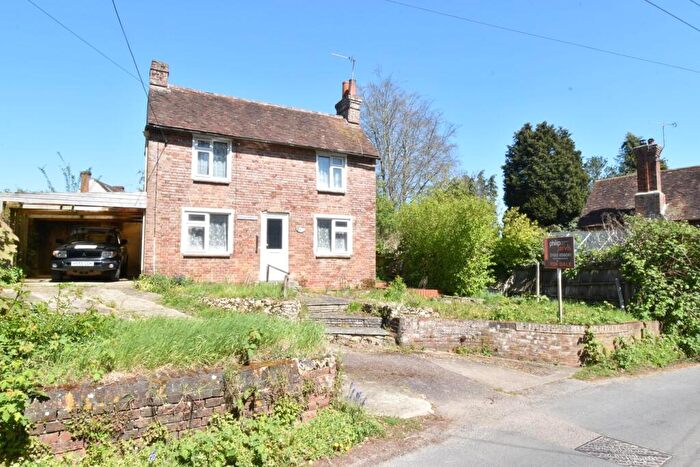
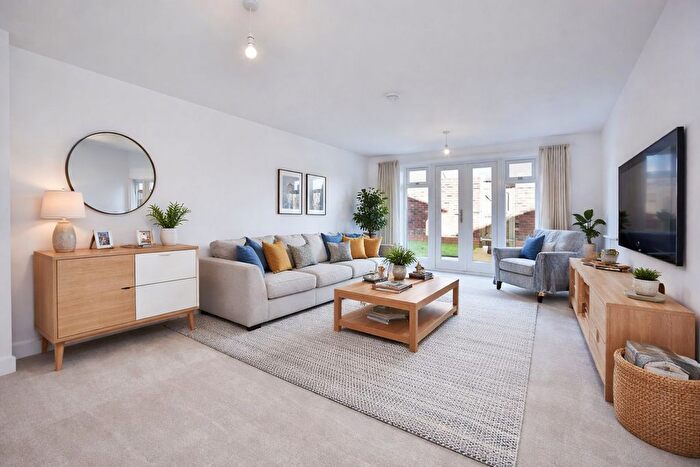
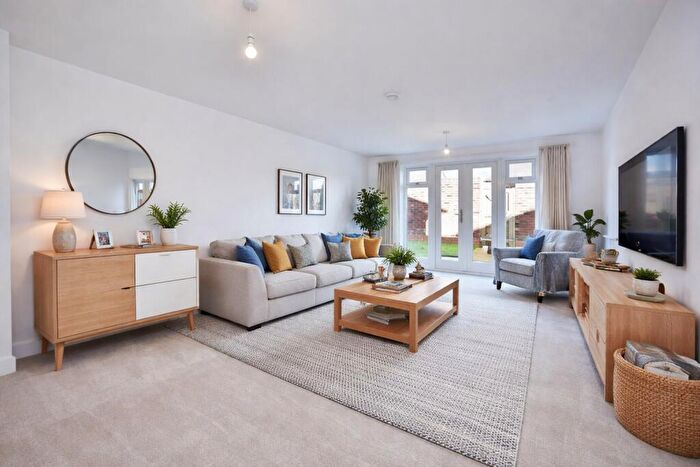
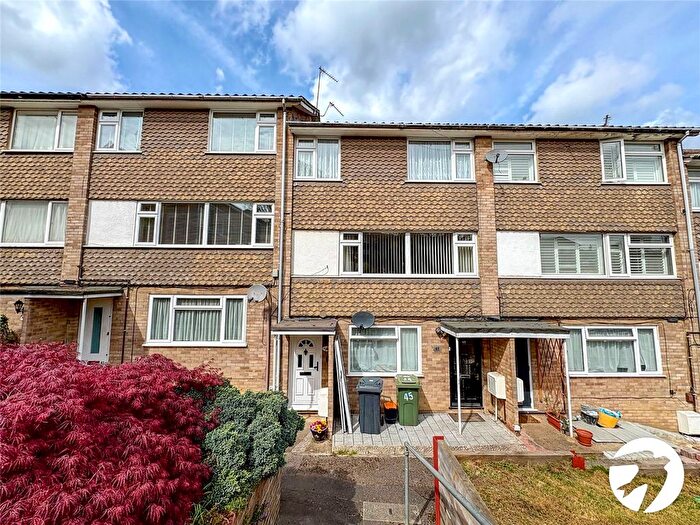
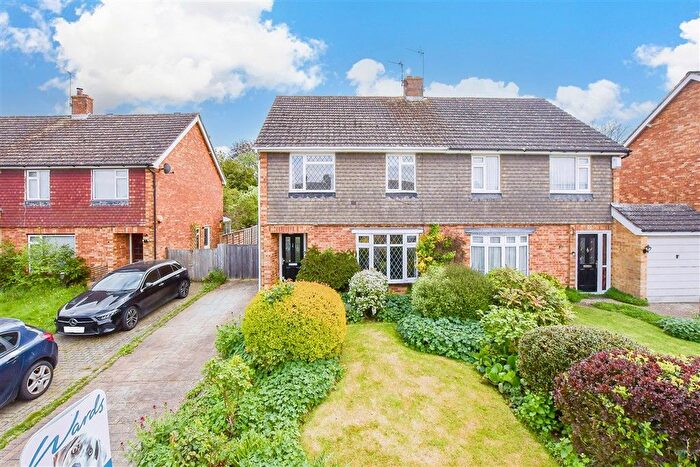
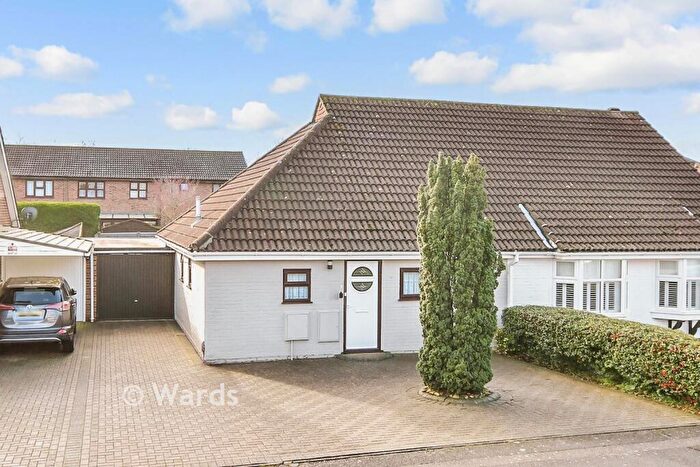
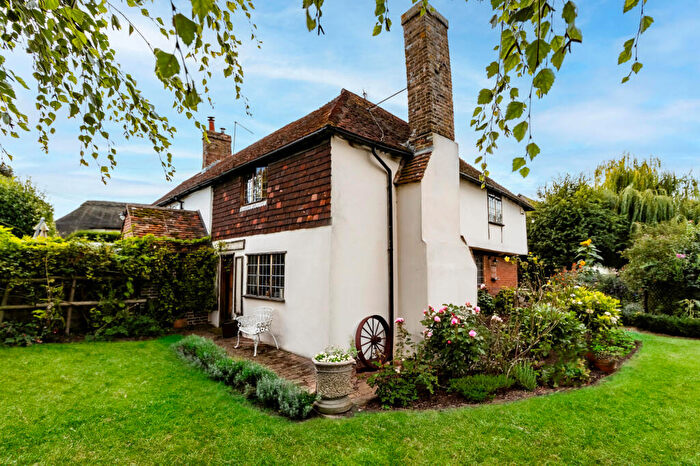
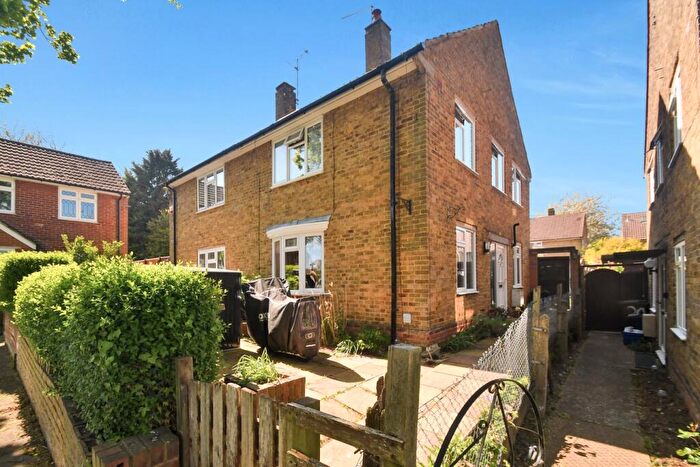
Properties for sale in Kent
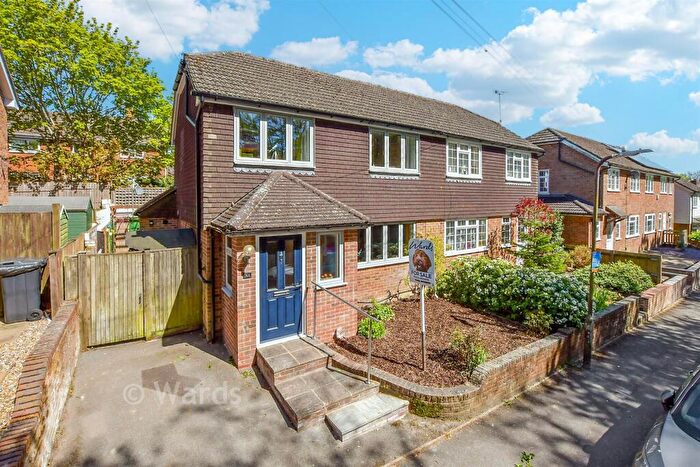
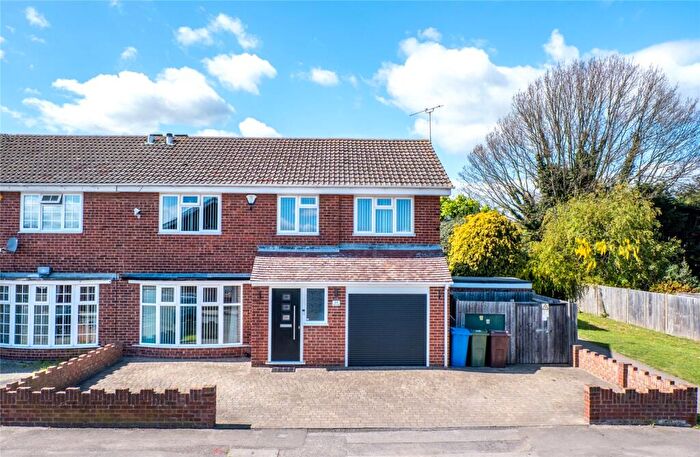
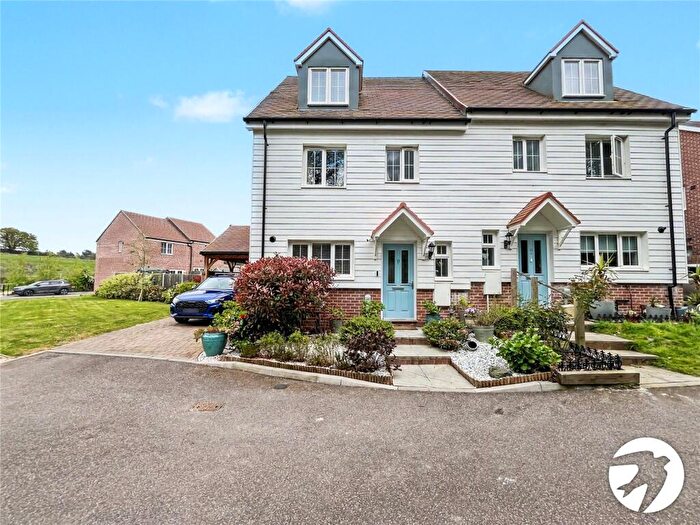
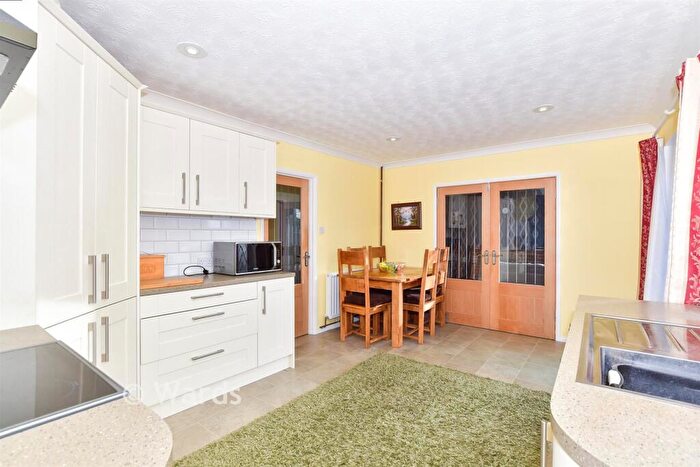
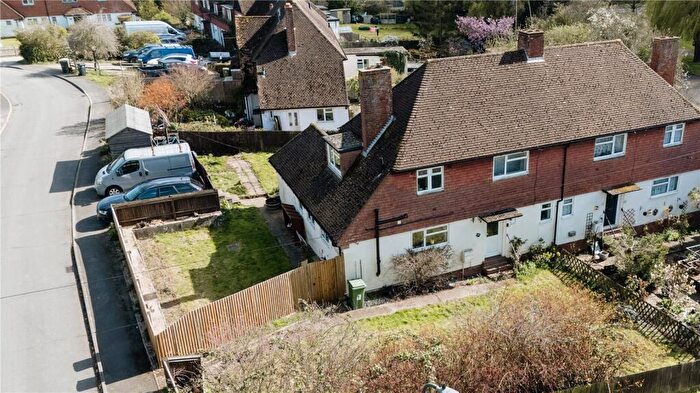
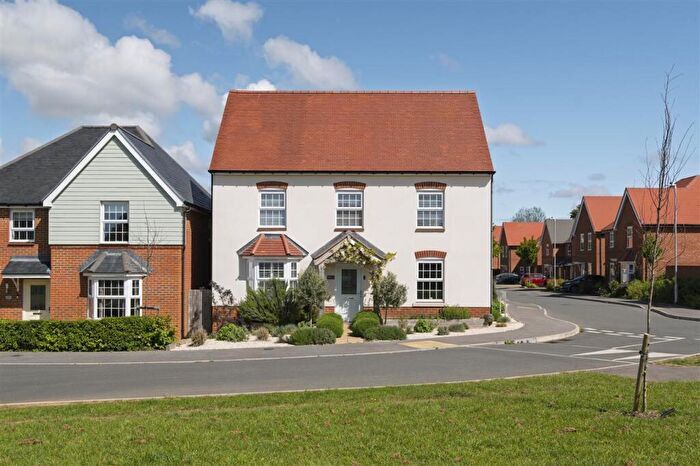
![]()
If you are looking to sell your house, let it out, or receive a property valuation, an expert can help you.
Click the button below to get started.

Towns in Kent
Navigate through our locations to find the location of your next house in Kent, England for sale or to rent.
- Ashford
- Aylesford
- Bexley
- Birchington
- Broadstairs
- Canterbury
- Chatham
- Cranbrook
- Dartford
- Deal
- Dover
- Edenbridge
- Faversham
- Folkestone
- Gillingham
- Gravesend
- Greenhithe
- Herne Bay
- Hythe
- Longfield
- Maidstone
- Margate
- New Romney
- Orpington
- Queenborough
- Ramsgate
- Rochester
- Romney Marsh
- Rye
- Sandwich
- Sevenoaks
- Sheerness
- Sidcup
- Sittingbourne
- Snodland
- Stone
- Swanley
- Swanscombe
- Tenterden
- Tonbridge
- Tunbridge Wells
- Wadhurst
- West Malling
- Westerham
- Westgate-on-sea
- Whitstable
- Belvedere
Transport in Kent
Please see below transportation links in this area:

- FAQ
- Price Paid By Year
- Property Type Price
Frequently asked questions about Kent
What is the average price for a property for sale in Kent?
The average price for a property for sale in Kent is £392,773. This amount is 9% higher than the average price in England. There are more than 10,000 property listings for sale in Kent.
What locations have the most expensive properties for sale in Kent?
The locations with the most expensive properties for sale in Kent are Orpington at an average of £824,011, Wadhurst at an average of £811,500 and Sevenoaks at an average of £732,210.
What locations have the most affordable properties for sale in Kent?
The locations with the most affordable properties for sale in Kent are Queenborough at an average of £235,173, Ramsgate at an average of £277,493 and Dover at an average of £278,406.
Which train stations are available in or near Kent?
Some of the train stations available in or near Kent are Lenham, Harrietsham and Charing.
Property Price Paid in Kent by Year
The average sold property price by year was:
| Year | Average Sold Price | Price Change |
Sold Properties
|
|---|---|---|---|
| 2026 | £386,340 | -2% |
1,528 Properties |
| 2025 | £395,427 | 2% |
20,817 Properties |
| 2024 | £388,818 | -2% |
21,229 Properties |
| 2023 | £394,830 | -3% |
18,734 Properties |
| 2022 | £406,390 | 5% |
25,361 Properties |
| 2021 | £384,068 | 7% |
33,692 Properties |
| 2020 | £359,061 | 6% |
23,568 Properties |
| 2019 | £337,173 | 1% |
25,475 Properties |
| 2018 | £334,352 | 4% |
27,242 Properties |
| 2017 | £319,826 | 6% |
29,540 Properties |
| 2016 | £300,511 | 7% |
29,977 Properties |
| 2015 | £278,737 | 7% |
29,839 Properties |
| 2014 | £259,978 | 6% |
29,315 Properties |
| 2013 | £244,945 | 2% |
23,750 Properties |
| 2012 | £239,034 | 2% |
20,208 Properties |
| 2011 | £235,074 | -3% |
19,878 Properties |
| 2010 | £242,531 | 10% |
19,725 Properties |
| 2009 | £218,747 | -6% |
18,775 Properties |
| 2008 | £232,876 | 0,4% |
18,563 Properties |
| 2007 | £231,919 | 6% |
36,734 Properties |
| 2006 | £217,944 | 6% |
37,164 Properties |
| 2005 | £204,270 | 4% |
28,434 Properties |
| 2004 | £196,940 | 11% |
34,078 Properties |
| 2003 | £174,746 | 13% |
32,709 Properties |
| 2002 | £152,500 | 14% |
37,203 Properties |
| 2001 | £130,444 | 12% |
32,236 Properties |
| 2000 | £115,166 | 15% |
28,022 Properties |
| 1999 | £98,285 | 8% |
30,058 Properties |
| 1998 | £90,415 | 9% |
26,546 Properties |
| 1997 | £82,014 | 8% |
29,133 Properties |
| 1996 | £75,188 | 5% |
24,254 Properties |
| 1995 | £71,248 | - |
21,074 Properties |
Property Price per Property Type in Kent
Here you can find historic sold price data in order to help with your property search.
The average Property Paid Price for specific property types in the last three years are:
| Property Type | Average Sold Price | Sold Properties |
|---|---|---|
| Semi Detached House | £392,843.00 | 18,040 Semi Detached Houses |
| Terraced House | £315,758.00 | 18,858 Terraced Houses |
| Detached House | £634,495.00 | 14,087 Detached Houses |
| Flat | £220,197.00 | 11,323 Flats |