
Houses for sale & to rent in Lancashire, England
House Prices in Lancashire
Properties in Lancashire have
an average house price of
£210k
and had 56,082 Property Transactions
within the last 3 years.¹
Lancashire is a location in
England with
495,971 households², where the most expensive property was sold for £3.5M.
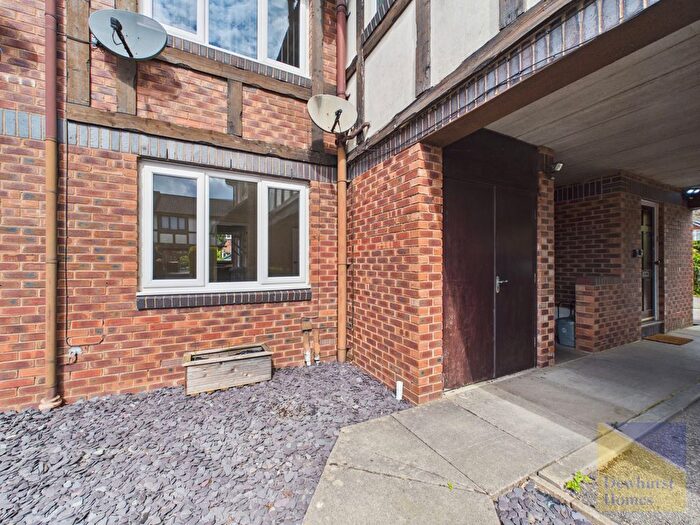
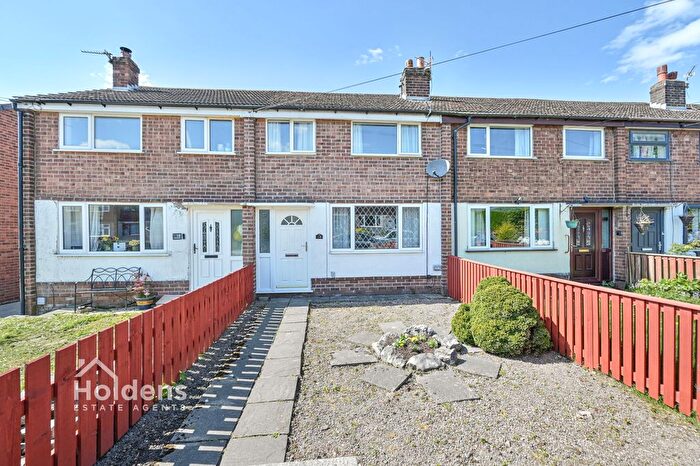
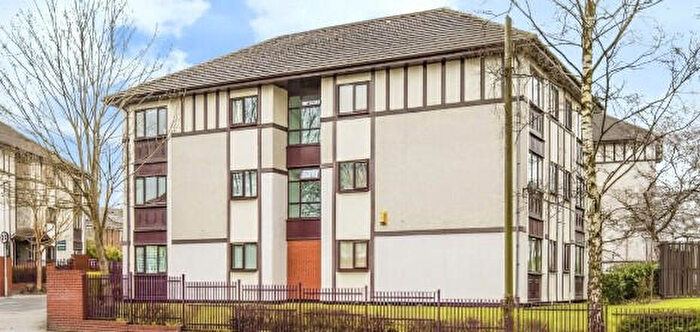
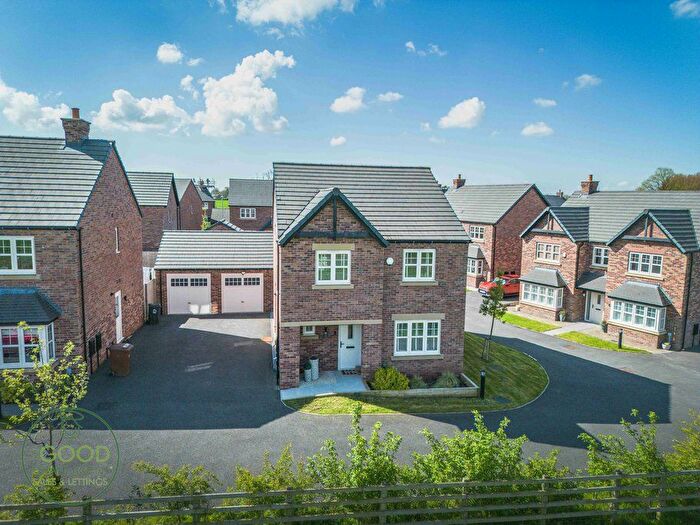
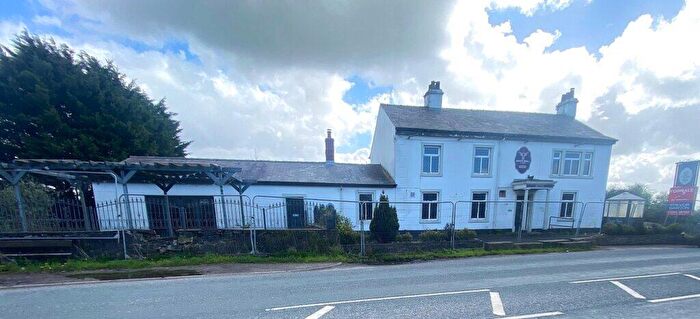
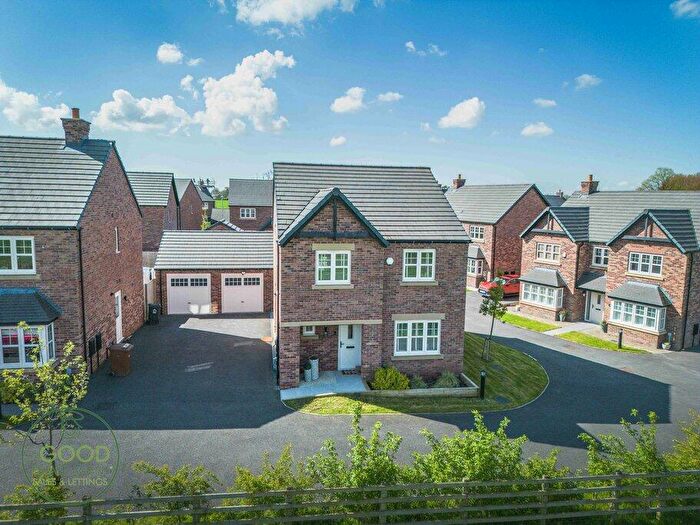
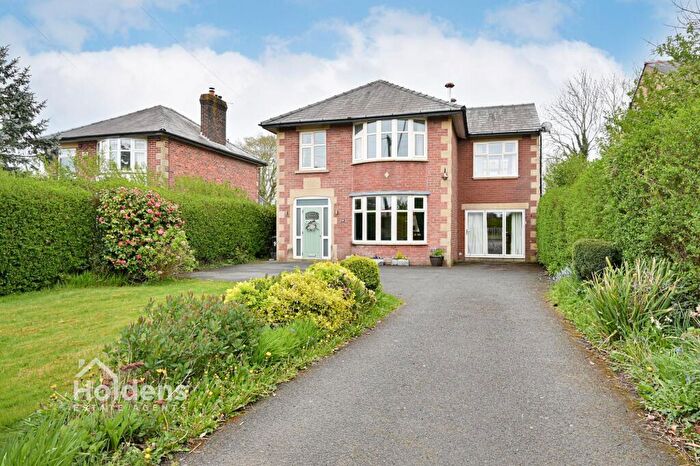
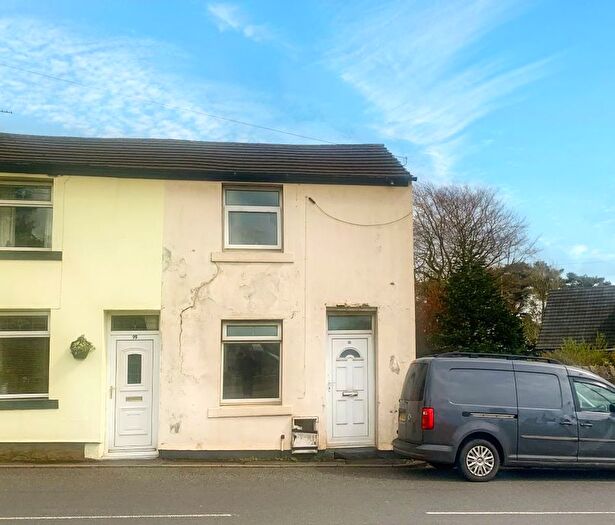
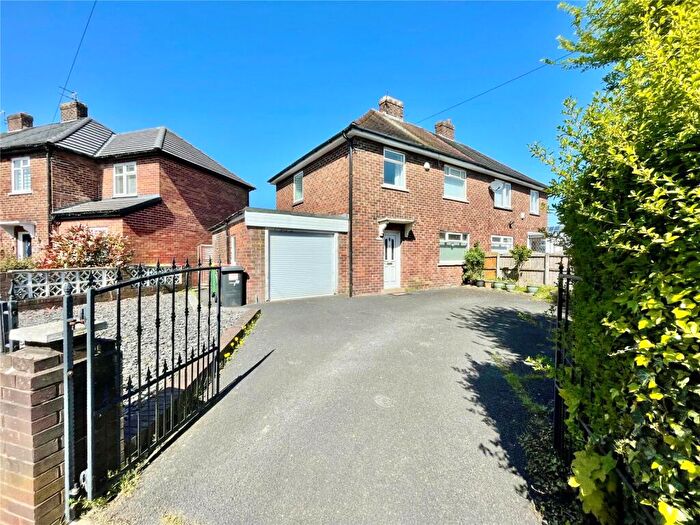
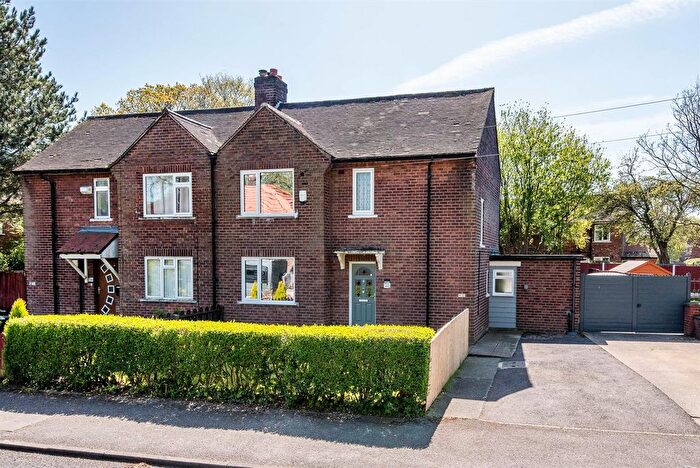
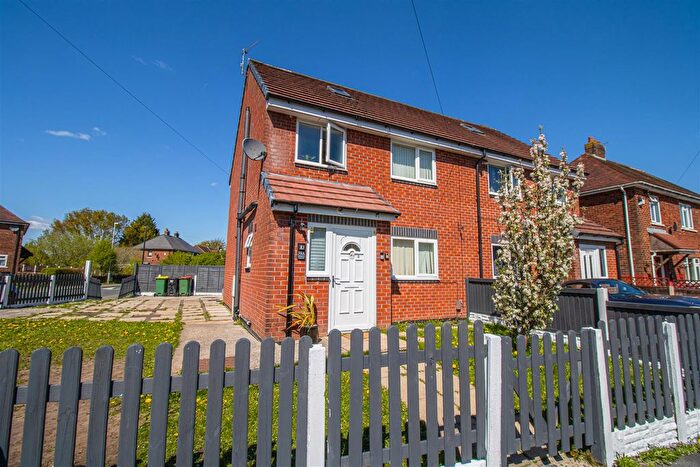
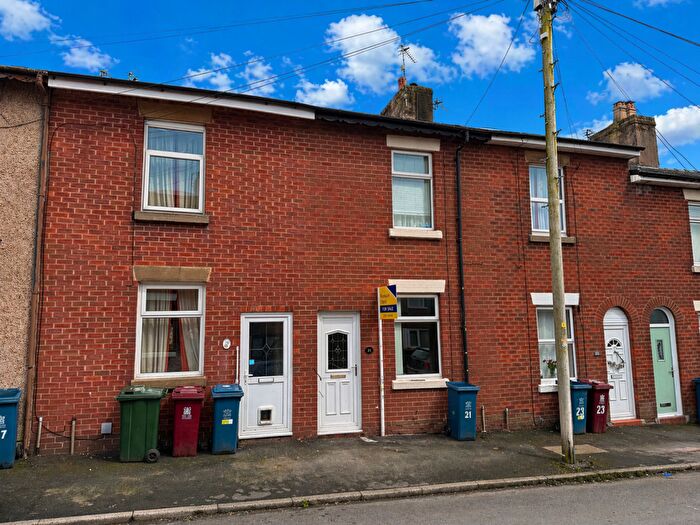
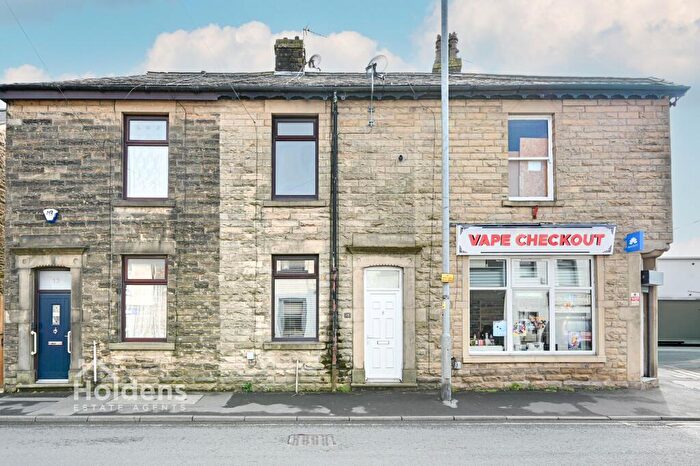
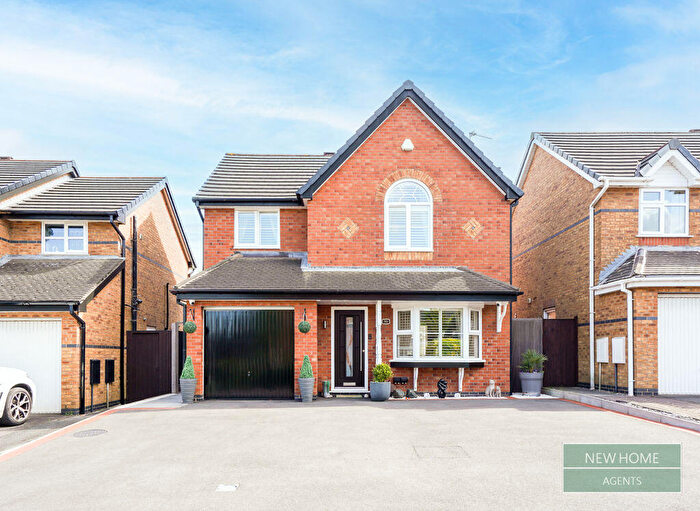
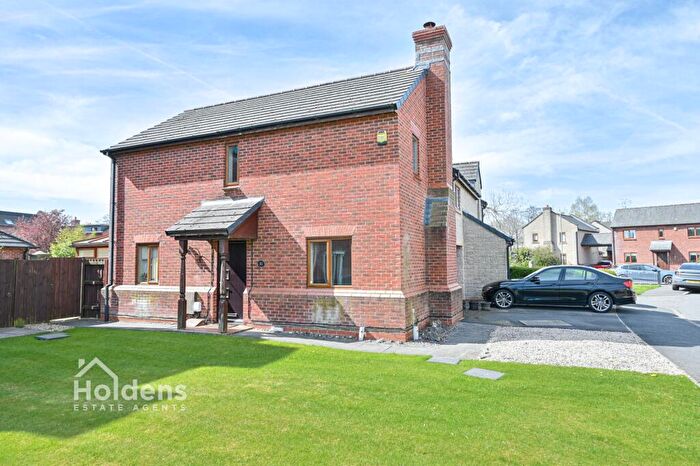
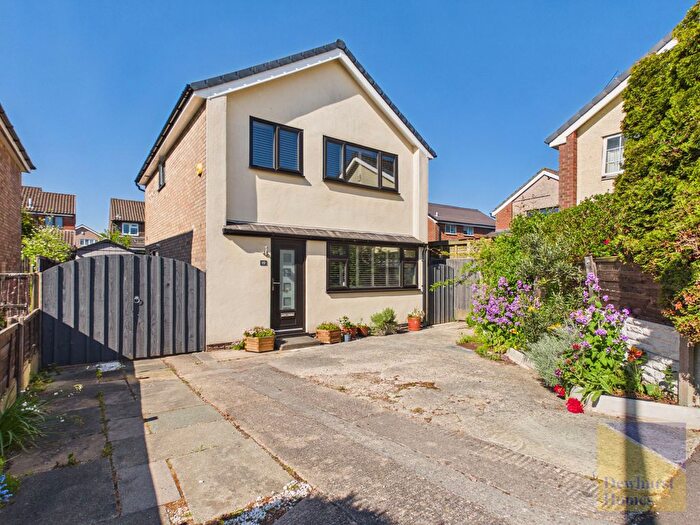
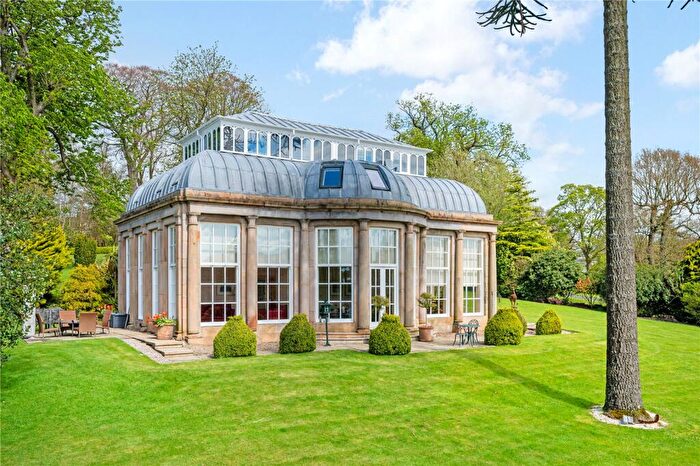
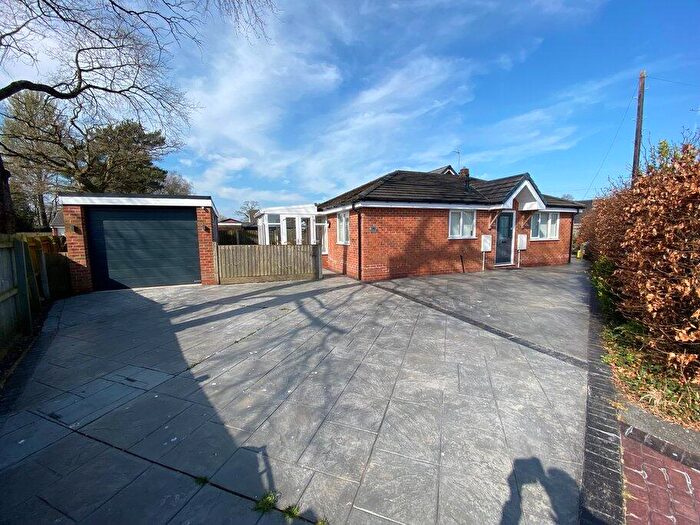
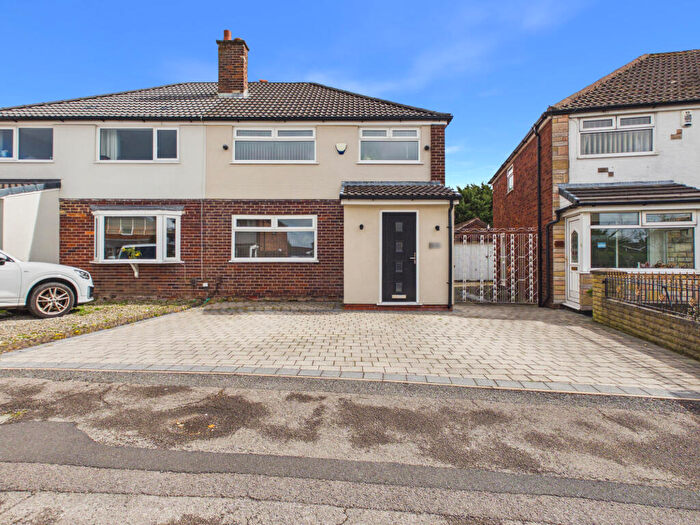
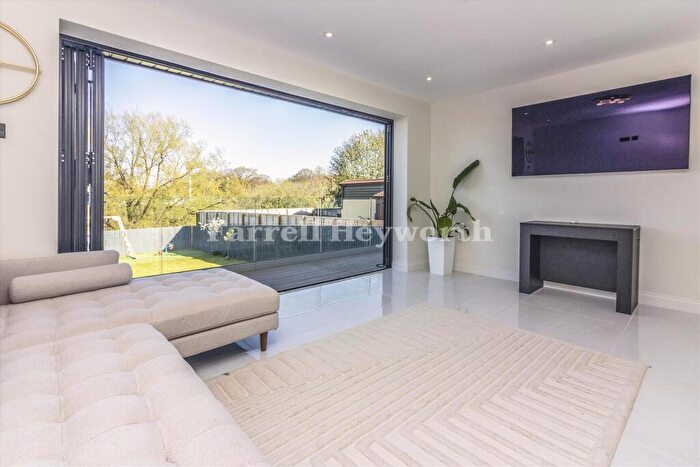
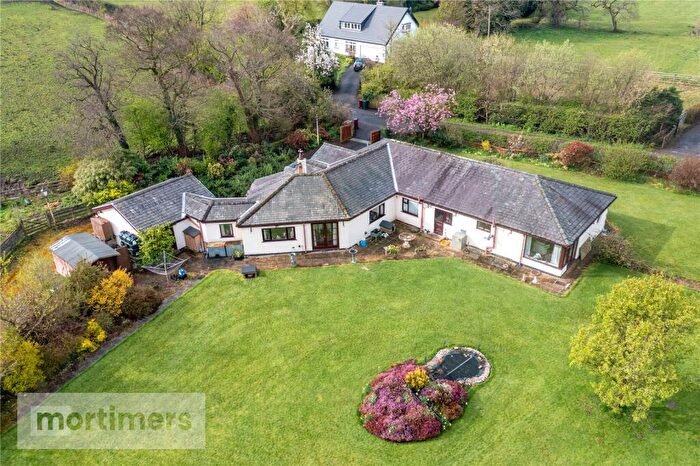
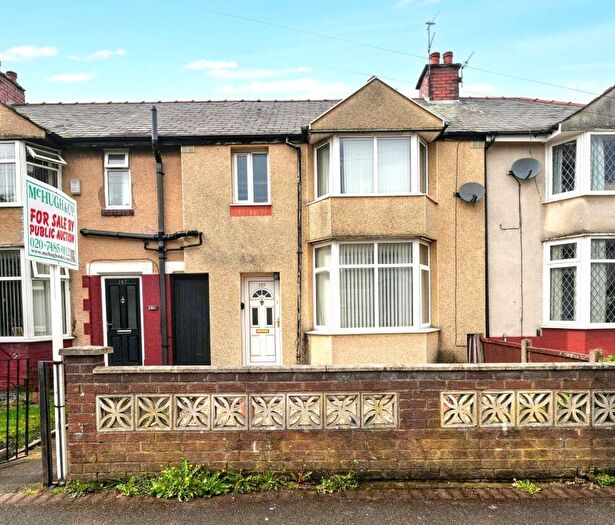
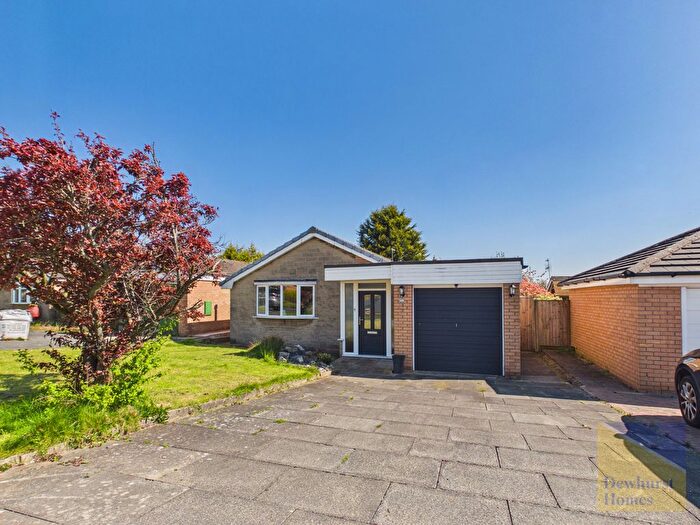
Properties for sale in Lancashire

![]()
If you are looking to sell your house, let it out, or receive a property valuation, an expert can help you.
Click the button below to get started.
Towns in Lancashire
Navigate through our locations to find the location of your next house in Lancashire, England for sale or to rent.
- Accrington
- Bacup
- Barnoldswick
- Blackburn
- Blackpool
- Bolton
- Burnley
- Bury
- Carnforth
- Chorley
- Clitheroe
- Colne
- Fleetwood
- Lancaster
- Leyland
- Liverpool
- Lytham St Annes
- Morecambe
- Nelson
- Ormskirk
- Poulton-le-fylde
- Preston
- Rochdale
- Rossendale
- Skelmersdale
- Skipton
- Southport
- St. Helens
- Thornton-cleveleys
- Todmorden
- Wigan
- Darwen
Transport in Lancashire
Please see below transportation links in this area:
-
 Preston Station
 -
Bamber Bridge Station
-
Pleasington Station
-
Lostock Hall Station
-
Ramsgreave and Wilpshire Station
-
Cherry Tree Station
-
Mill Hill (Lancashire) Station
-
Blackburn Station
-
Langho Station
-
Leyland Station
- FAQ
- Price Paid By Year
- Property Type Price
Frequently asked questions about Lancashire
What is the average price for a property for sale in Lancashire?
The average price for a property for sale in Lancashire is £209,556. This amount is 42% lower than the average price in England. There are more than 10,000 property listings for sale in Lancashire.
What locations have the most expensive properties for sale in Lancashire?
The locations with the most expensive properties for sale in Lancashire are Skipton at an average of £573,028, Bolton at an average of £437,333 and Liverpool at an average of £390,600.
What locations have the most affordable properties for sale in Lancashire?
The locations with the most affordable properties for sale in Lancashire are Nelson at an average of £132,794, Burnley at an average of £135,605 and Accrington at an average of £136,683.
Which train stations are available in or near Lancashire?
Some of the train stations available in or near Lancashire are Preston, Bamber Bridge and Pleasington.
Property Price Paid in Lancashire by Year
The average sold property price by year was:
| Year | Average Sold Price | Price Change |
Sold Properties
|
|---|---|---|---|
| 2026 | £217,851 | 1% |
1,209 Properties |
| 2025 | £215,313 | 3% |
18,105 Properties |
| 2024 | £209,694 | 3% |
19,108 Properties |
| 2023 | £202,935 | 0,1% |
17,660 Properties |
| 2022 | £202,719 | 2% |
22,274 Properties |
| 2021 | £198,915 | 6% |
26,762 Properties |
| 2020 | £186,027 | 6% |
20,164 Properties |
| 2019 | £174,961 | 2% |
22,620 Properties |
| 2018 | £171,901 | 2% |
22,526 Properties |
| 2017 | £168,376 | 2% |
22,794 Properties |
| 2016 | £164,759 | 3% |
21,807 Properties |
| 2015 | £159,272 | 4% |
20,527 Properties |
| 2014 | £153,185 | 1% |
19,684 Properties |
| 2013 | £151,894 | 2% |
15,606 Properties |
| 2012 | £148,326 | 0,1% |
12,916 Properties |
| 2011 | £148,154 | -3% |
13,327 Properties |
| 2010 | £152,858 | 1% |
13,384 Properties |
| 2009 | £150,870 | -1% |
12,808 Properties |
| 2008 | £152,828 | -0,1% |
14,136 Properties |
| 2007 | £152,994 | 8% |
28,932 Properties |
| 2006 | £141,361 | 9% |
31,085 Properties |
| 2005 | £127,975 | 7% |
25,694 Properties |
| 2004 | £118,423 | 16% |
31,050 Properties |
| 2003 | £99,159 | 18% |
31,863 Properties |
| 2002 | £81,333 | 13% |
32,972 Properties |
| 2001 | £71,128 | 8% |
28,665 Properties |
| 2000 | £65,392 | 3% |
25,366 Properties |
| 1999 | £63,331 | 7% |
23,457 Properties |
| 1998 | £58,960 | 3% |
22,192 Properties |
| 1997 | £56,986 | 7% |
22,443 Properties |
| 1996 | £53,056 | 4% |
19,030 Properties |
| 1995 | £50,937 | - |
17,344 Properties |
Property Price per Property Type in Lancashire
Here you can find historic sold price data in order to help with your property search.
The average Property Paid Price for specific property types in the last three years are:
| Property Type | Average Sold Price | Sold Properties |
|---|---|---|
| Semi Detached House | £210,925.00 | 18,013 Semi Detached Houses |
| Terraced House | £135,437.00 | 21,651 Terraced Houses |
| Detached House | £371,531.00 | 12,008 Detached Houses |
| Flat | £126,806.00 | 4,410 Flats |