
Houses for sale & to rent in Nottingham, Nottinghamshire
House Prices in Nottingham
Properties in Nottingham have an average house price of £283k and had 17,976 Property Transactions within the last 3 years.¹
Nottingham is an area in Nottinghamshire with 179,142 households², where the most expensive property was sold for £5.13M.
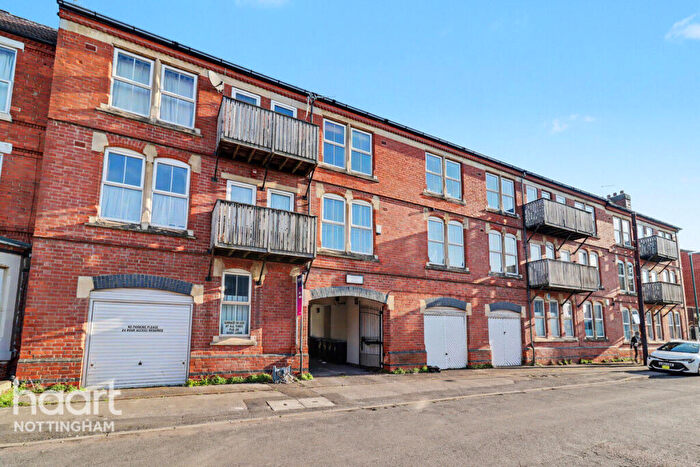
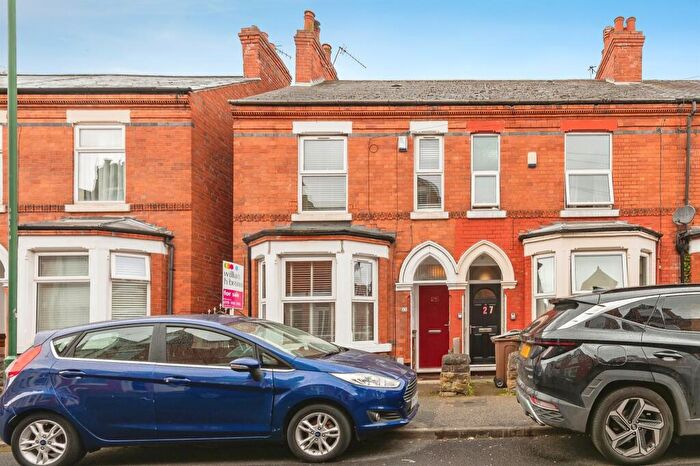
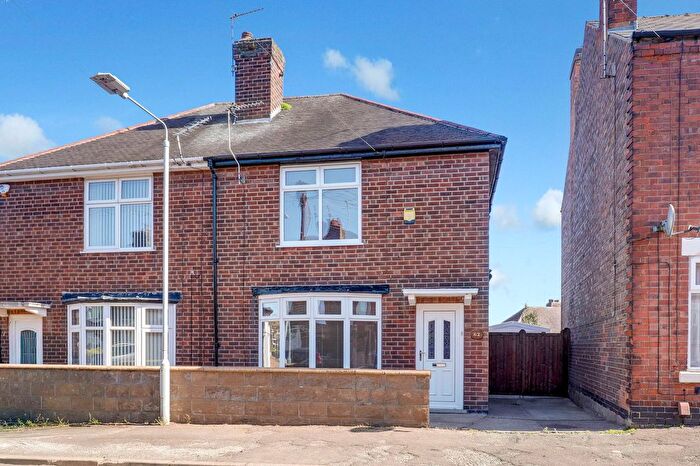
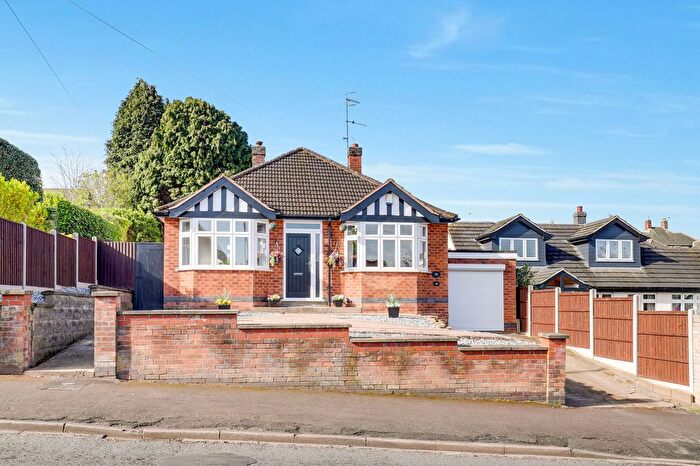
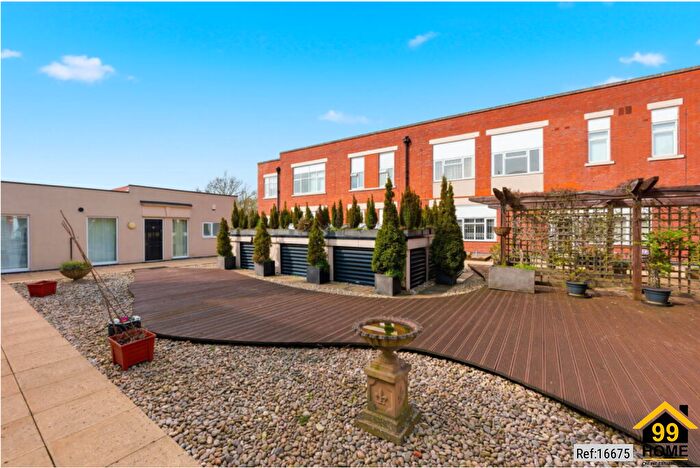
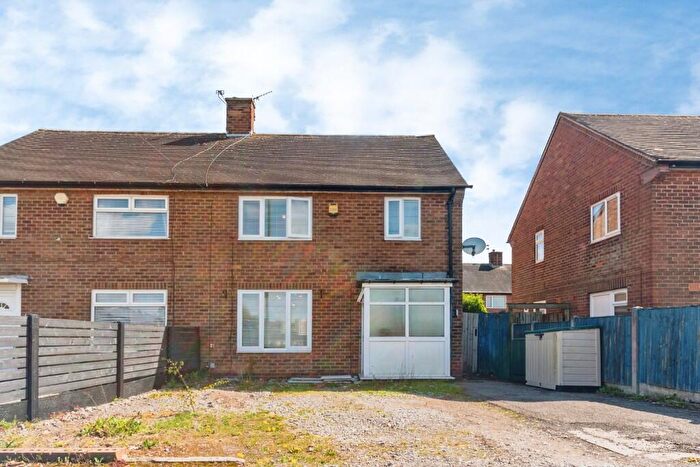
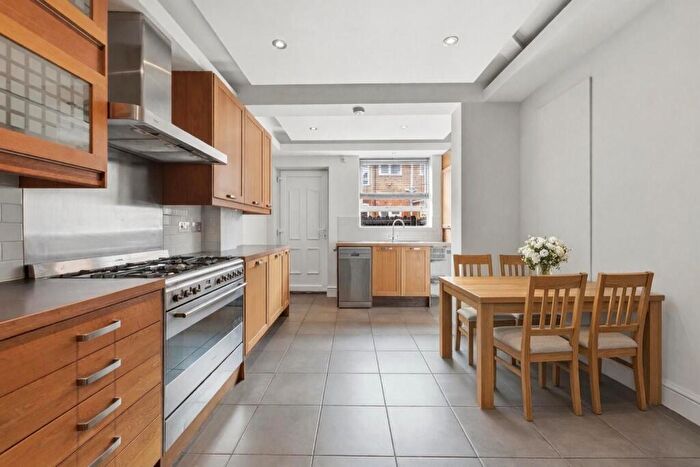
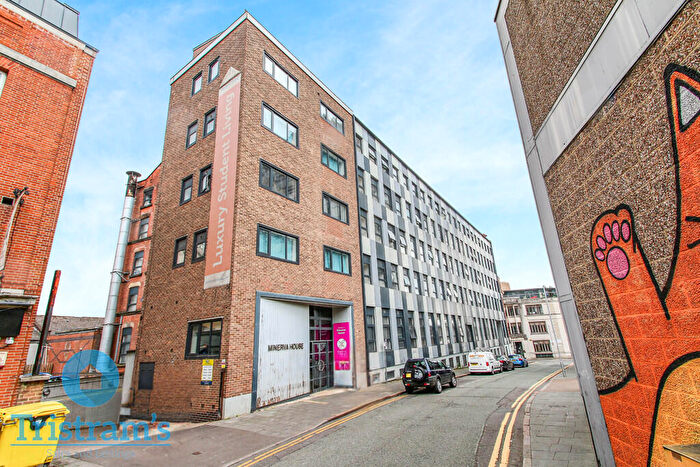
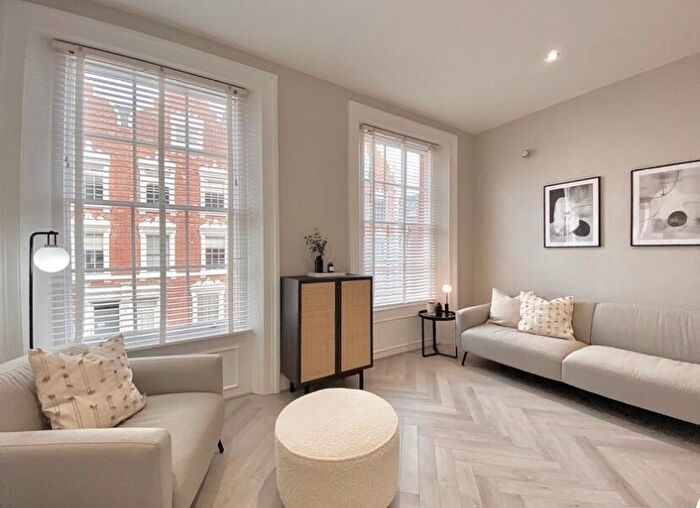
Properties for sale in Nottingham
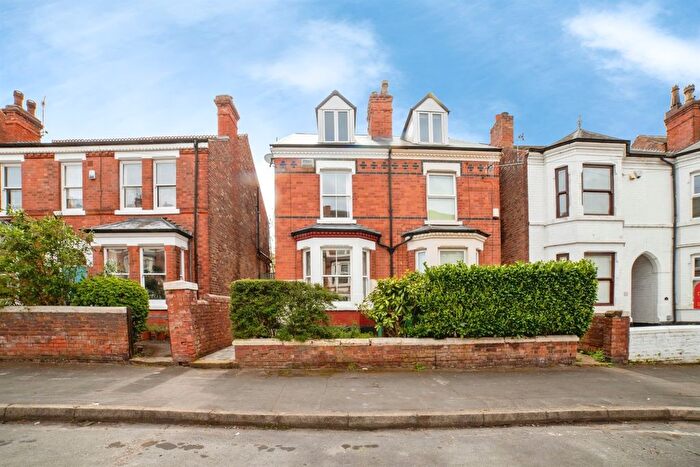

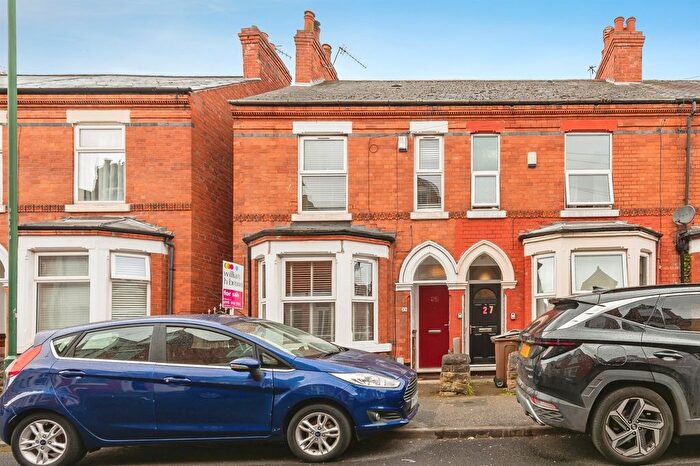
![]()
If you are looking to sell your house, let it out, or receive a property valuation, an expert can help you.
Click the button below to get started.


Neighbourhoods in Nottingham
Navigate through our locations to find the location of your next house in Nottingham, Nottinghamshire for sale or to rent.
- Abbey
- Attenborough
- Awsworth
- Beeston Central
- Beeston North
- Beeston Rylands
- Beeston West
- Bestwood Village
- Bingham East
- Bingham West
- Bonington
- Bramcote
- Brinsley
- Burton Joyce And Stoke Bardolph
- Calverton
- Carlton
- Carlton Hill
- Chilwell East
- Chilwell West
- Compton Acres
- Cossall And Kimberley
- Cotgrave
- Cranmer
- Daybrook
- Eastwood North And Greasley (beauvale)
- Eastwood South
- Edwalton Village
- Farndon
- Gamston
- Gedling
- Gotham
- Greasley (giltbrook And Newthorpe)
- Hucknall Central
- Hucknall East
- Hucknall North
- Hucknall West
- Jacksdale
- Keyworth North
- Keyworth South
- Killisick
- Kingswell
- Kirkby In Ashfield Central
- Kirkby In Ashfield East
- Kirkby In Ashfield West
- Lady Bay
- Lambley
- Lowdham
- Lutterell
- Manvers
- Mapperley Plains
- Melton
- Musters
- Netherfield And Colwick
- Nevile
- Newstead
- Nuthall East And Strelley
- Nuthall West And Greasley (watnall)
- Oak
- Phoenix
- Porchester
- Ravenshead
- Ruddington
- Selston
- Soar Valley
- St James
- St Marys
- Stanford
- Stapleford North
- Stapleford South East
- Stapleford South West
- Sutton In Ashfield Central
- Sutton In Ashfield East
- Sutton In Ashfield West
- Thoroton
- Tollerton
- Toton And Chilwell Meadows
- Trent
- Trent Bridge
- Trowell
- Underwood
- Valley
- Wiverton
- Wolds
- Woodborough
- Woodhouse
- Woodthorpe
- St. Ann's
- Bunny
- Clifton West
- Radcliffe on Trent
- East Bridgford
- Cropwell
- Gamston North
- Nevile & Langar
- Edwalton
- Meadows
- Keyworth & Wolds
- Farndon & Fernwood
- Trent Valley
- Dover Beck
- Dumbles
- Annesley & Kirkby Woodhouse
- Newstead Abbey
- Hucknall South
- Kimberley
- Watnall & Nuthall West
- Greasley
- Nuthall East & Strelley
- Awsworth, Cossall & Trowell
- Eastwood St Mary's
- Eastwood Hall
- Eastwood Hilltop
- Kirkby Cross & Portland
- Central & New Cross
- Leamington
- Larwood
- Ashfields
- Huthwaite & Brierley
- Carsic
- The Dales
- Sutton Junction & Harlow Wood
- Summit
- Abbey Hill
- Gamston South
- Coppice
- Plains
- Colwick
- Ernehale
- Bestwood St Albans
- Hyson Green & Arboretum
- Lenton & Wollaton East
- Attenborough & Chilwell East
- Toton & Chilwell Meadows
- Clifton East
- Shipley Park, Horsley and Horsley Woodhouse
- Langley Mill and Aldercar
- Mapperley
- Dales
- Cavendish
- Bulwell Forest
- Bestwood
- Redhill
- Bulwell
- Wollaton West
- Bilborough
- Aspley
- Basford
- Castle
- Bingham North
- Newton
- Sutton St Mary's
- Stanton Hill & Teversal
- Skegby
- Sutton Central & New Cross
- Greenwood & Summit
- Berridge
- Sherwood
- Radford
Transport in Nottingham
Please see below transportation links in this area:
-
 Bulwell Station
 -
Nottingham Station
-
Carlton Station
-
Netherfield Station
-
Beeston Station
-
Hucknall Station
-
Burton Joyce Station
- FAQ
- Price Paid By Year
- Property Type Price
Frequently asked questions about Nottingham
What is the average price for a property for sale in Nottingham?
The average price for a property for sale in Nottingham is £282,561. This amount is 12% higher than the average price in Nottinghamshire. There are more than 10,000 property listings for sale in Nottingham.
What locations have the most expensive properties for sale in Nottingham?
The locations with the most expensive properties for sale in Nottingham are Gamston North at an average of £1,750,000, Soar Valley at an average of £1,385,000 and Wolds at an average of £679,532.
What locations have the most affordable properties for sale in Nottingham?
The locations with the most affordable properties for sale in Nottingham are Kirkby Cross & Portland at an average of £80,000, Bulwell Forest at an average of £80,782 and Eastwood Hilltop at an average of £98,500.
Which train stations are available in or near Nottingham?
Some of the train stations available in or near Nottingham are Bulwell, Nottingham and Carlton.
Property Price Paid in Nottingham by Year
The average sold property price by year was:
| Year | Average Sold Price | Price Change |
Sold Properties
|
|---|---|---|---|
| 2026 | £290,545 | 2% |
136 Properties |
| 2025 | £285,656 | 1% |
5,733 Properties |
| 2024 | £283,720 | 2% |
6,455 Properties |
| 2023 | £277,907 | -0,5% |
5,652 Properties |
| 2022 | £279,222 | 4% |
7,110 Properties |
| 2021 | £268,431 | 8% |
8,881 Properties |
| 2020 | £246,638 | 10% |
6,736 Properties |
| 2019 | £222,302 | 0,4% |
8,073 Properties |
| 2018 | £221,380 | 4% |
7,955 Properties |
| 2017 | £212,214 | 4% |
8,206 Properties |
| 2016 | £203,121 | 6% |
8,341 Properties |
| 2015 | £191,649 | 7% |
7,638 Properties |
| 2014 | £178,341 | 4% |
7,700 Properties |
| 2013 | £170,646 | 1% |
6,497 Properties |
| 2012 | £169,685 | -0,2% |
5,475 Properties |
| 2011 | £169,961 | -1% |
5,366 Properties |
| 2010 | £172,509 | 3% |
5,188 Properties |
| 2009 | £167,091 | 2% |
5,053 Properties |
| 2008 | £163,583 | -5% |
4,699 Properties |
| 2007 | £172,394 | 3% |
9,194 Properties |
| 2006 | £167,470 | 2% |
9,056 Properties |
| 2005 | £163,398 | 5% |
7,210 Properties |
| 2004 | £154,819 | 13% |
8,821 Properties |
| 2003 | £134,900 | 18% |
8,661 Properties |
| 2002 | £111,259 | 18% |
9,635 Properties |
| 2001 | £91,360 | 10% |
9,289 Properties |
| 2000 | £82,475 | 8% |
8,539 Properties |
| 1999 | £75,488 | 9% |
8,989 Properties |
| 1998 | £68,481 | 6% |
7,941 Properties |
| 1997 | £64,546 | 5% |
8,339 Properties |
| 1996 | £61,394 | 5% |
7,100 Properties |
| 1995 | £58,619 | - |
5,848 Properties |
Property Price per Property Type in Nottingham
Here you can find historic sold price data in order to help with your property search.
The average Property Paid Price for specific property types in the last three years are:
| Property Type | Average Sold Price | Sold Properties |
|---|---|---|
| Semi Detached House | £247,714.00 | 6,461 Semi Detached Houses |
| Terraced House | £191,384.00 | 3,604 Terraced Houses |
| Detached House | £393,288.00 | 6,557 Detached Houses |
| Flat | £155,319.00 | 1,354 Flats |