
Houses for sale & to rent in Southport, Sefton
House Prices in Southport
Properties in Southport have an average house price of £237k and had 4,328 Property Transactions within the last 3 years.¹
Southport is an area in Sefton with 39,868 households², where the most expensive property was sold for £2.2M.
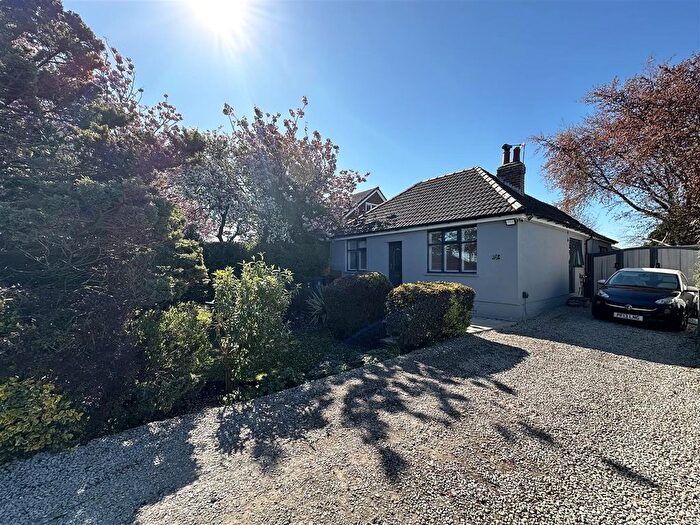
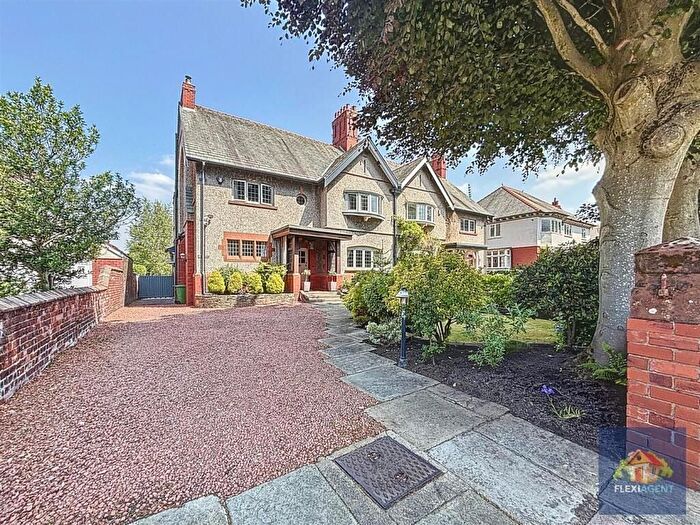
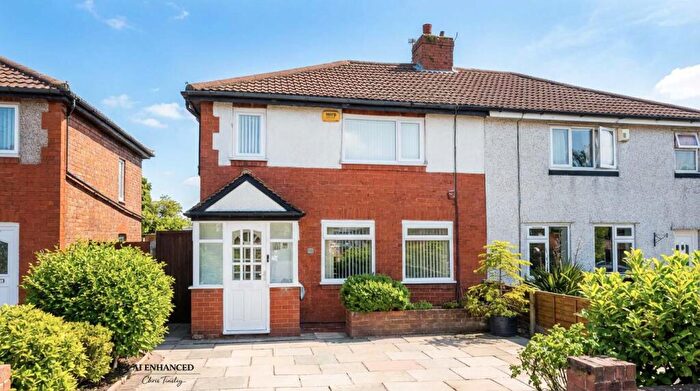
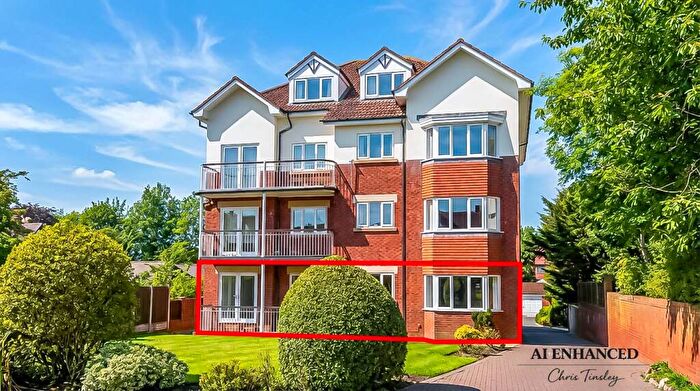
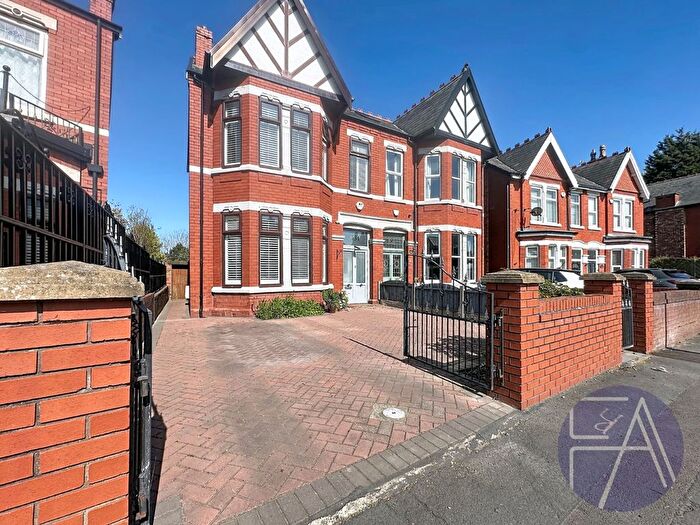
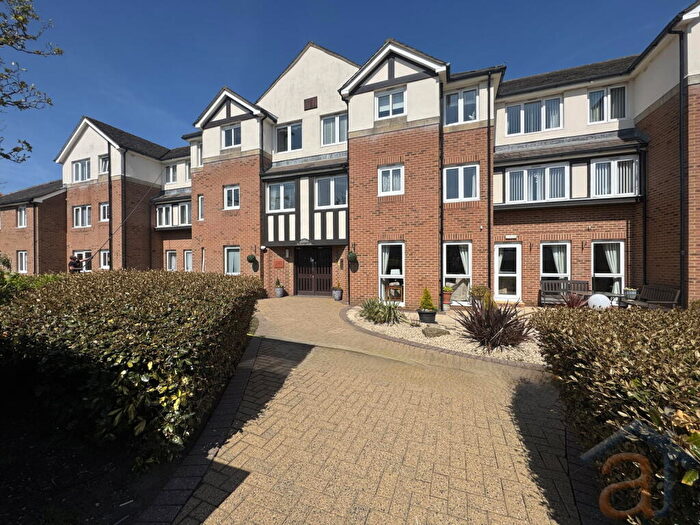
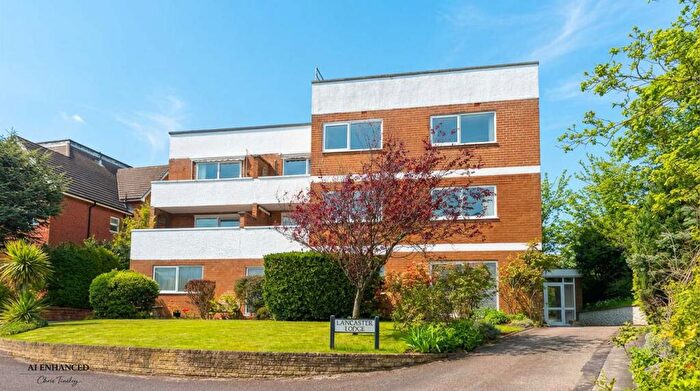
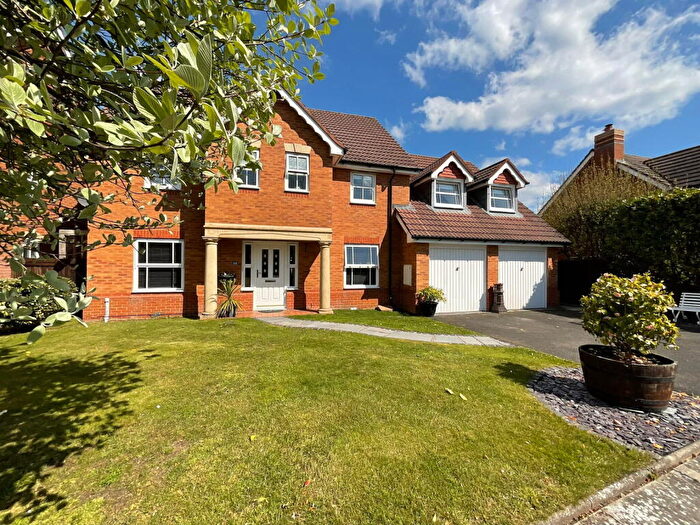
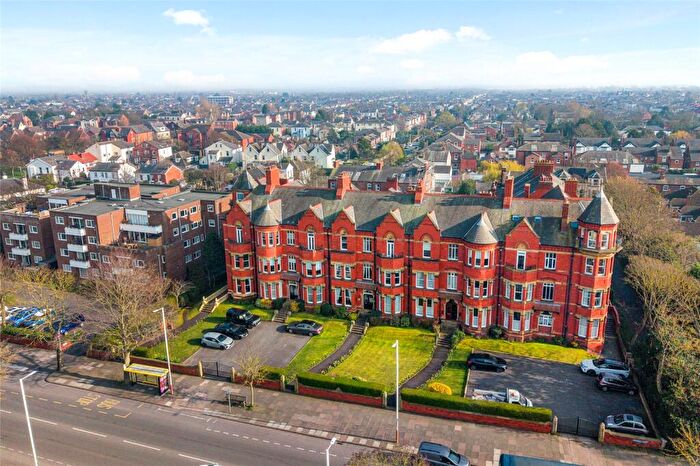
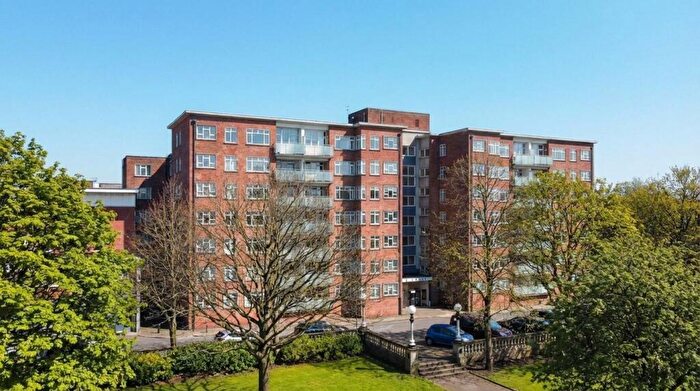
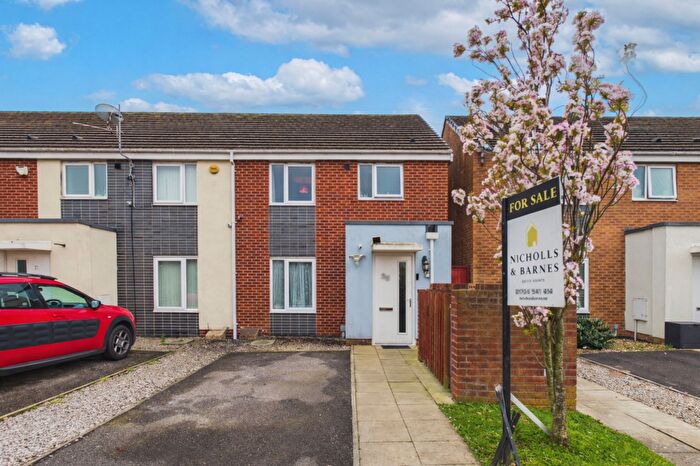
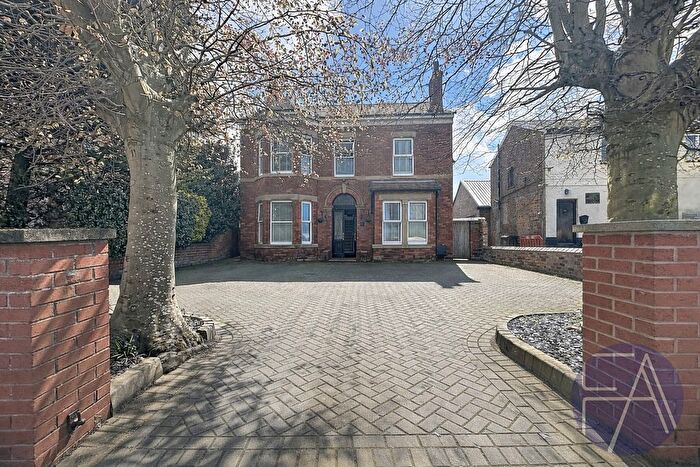
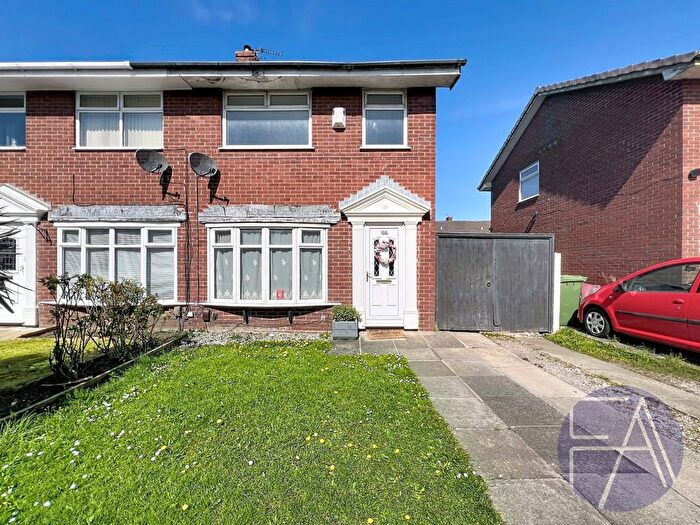
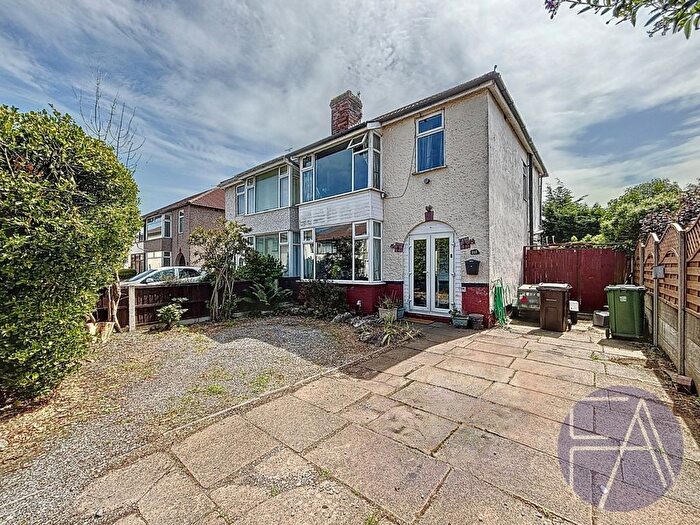
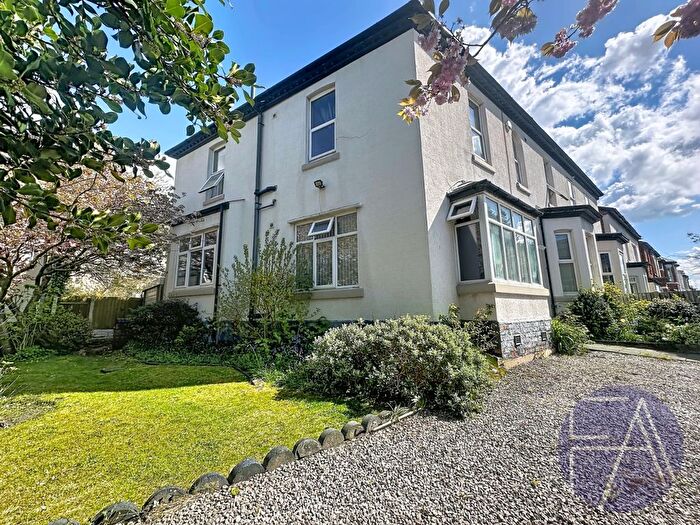
Properties for sale in Southport
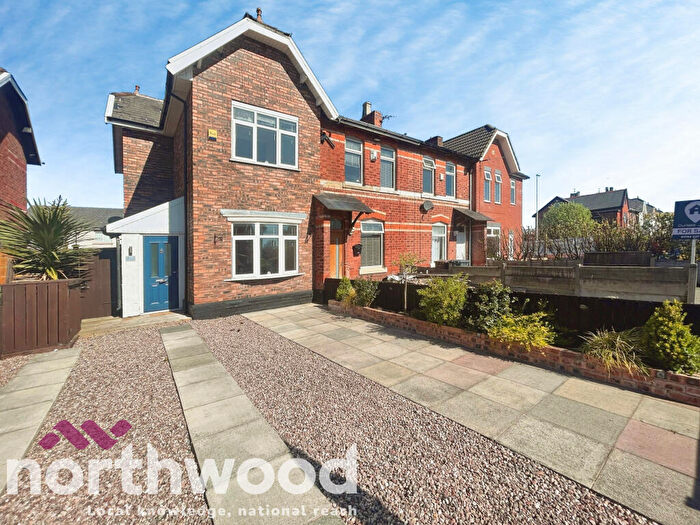
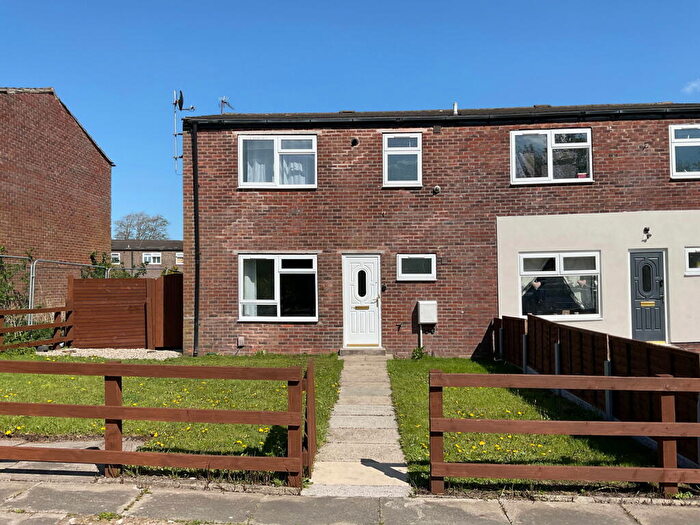
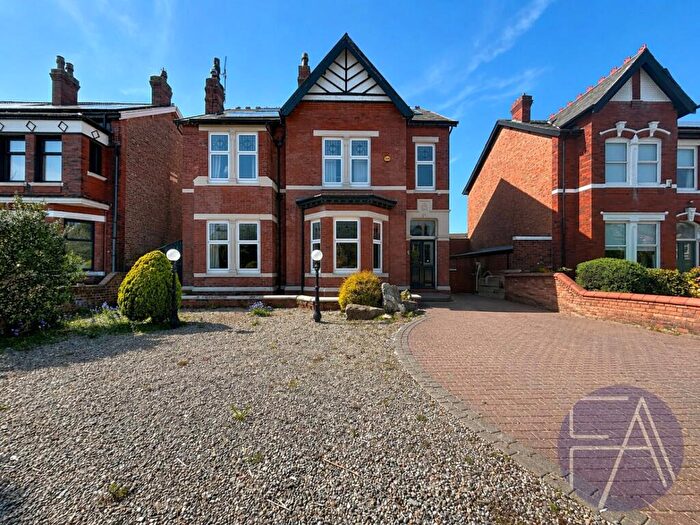
![]()
If you are looking to sell your house, let it out, or receive a property valuation, an expert can help you.
Click the button below to get started.
Neighbourhoods in Southport
Navigate through our locations to find the location of your next house in Southport, Sefton for sale or to rent.
Transport in Southport
Please see below transportation links in this area:

- FAQ
- Price Paid By Year
- Property Type Price
Frequently asked questions about Southport
What is the average price for a property for sale in Southport?
The average price for a property for sale in Southport is £237,421. This amount is 1% higher than the average price in Sefton. There are 6,039 property listings for sale in Southport.
What locations have the most expensive properties for sale in Southport?
The locations with the most expensive properties for sale in Southport are Ainsdale at an average of £283,618, Birkdale at an average of £274,187 and Meols at an average of £242,721.
What locations have the most affordable properties for sale in Southport?
The locations with the most affordable properties for sale in Southport are Norwood at an average of £203,213, Cambridge at an average of £208,790 and Kew at an average of £220,242.
Which train stations are available in or near Southport?
Some of the train stations available in or near Southport are Southport, Birkdale and Meols Cop.
Property Price Paid in Southport by Year
The average sold property price by year was:
| Year | Average Sold Price | Price Change |
Sold Properties
|
|---|---|---|---|
| 2026 | £230,760 | -6% |
26 Properties |
| 2025 | £243,827 | 4% |
1,291 Properties |
| 2024 | £235,204 | 0,4% |
1,512 Properties |
| 2023 | £234,255 | 1% |
1,499 Properties |
| 2022 | £232,592 | 5% |
1,870 Properties |
| 2021 | £221,486 | 5% |
2,119 Properties |
| 2020 | £210,545 | 4% |
1,547 Properties |
| 2019 | £201,755 | 5% |
1,786 Properties |
| 2018 | £191,721 | 1% |
1,675 Properties |
| 2017 | £190,705 | 5% |
1,710 Properties |
| 2016 | £180,739 | 5% |
1,772 Properties |
| 2015 | £171,640 | 2% |
1,687 Properties |
| 2014 | £167,895 | 2% |
1,656 Properties |
| 2013 | £163,881 | 4% |
1,276 Properties |
| 2012 | £157,924 | -3% |
969 Properties |
| 2011 | £163,359 | -7% |
999 Properties |
| 2010 | £174,987 | 1% |
906 Properties |
| 2009 | £172,702 | -4% |
877 Properties |
| 2008 | £179,479 | -2% |
958 Properties |
| 2007 | £183,540 | 3% |
1,966 Properties |
| 2006 | £177,287 | 4% |
1,934 Properties |
| 2005 | £170,597 | 9% |
1,516 Properties |
| 2004 | £154,562 | 16% |
1,975 Properties |
| 2003 | £129,475 | 19% |
2,152 Properties |
| 2002 | £104,400 | 15% |
2,389 Properties |
| 2001 | £88,264 | 13% |
2,118 Properties |
| 2000 | £76,394 | 8% |
2,117 Properties |
| 1999 | £70,404 | 7% |
2,271 Properties |
| 1998 | £65,586 | 1% |
1,885 Properties |
| 1997 | £64,793 | 3% |
1,835 Properties |
| 1996 | £62,572 | 3% |
1,695 Properties |
| 1995 | £60,833 | - |
1,272 Properties |
Property Price per Property Type in Southport
Here you can find historic sold price data in order to help with your property search.
The average Property Paid Price for specific property types in the last three years are:
| Property Type | Average Sold Price | Sold Properties |
|---|---|---|
| Semi Detached House | £225,590.00 | 2,162 Semi Detached Houses |
| Terraced House | £193,714.00 | 365 Terraced Houses |
| Detached House | £406,390.00 | 816 Detached Houses |
| Flat | £139,608.00 | 985 Flats |