
Houses for sale & to rent in South Tyneside, England
House Prices in South Tyneside
Properties in South Tyneside have
an average house price of
£172k
and had 5,347 Property Transactions
within the last 3 years.¹
South Tyneside is a location in
England with
66,924 households², where the most expensive property was sold for £1.95M.
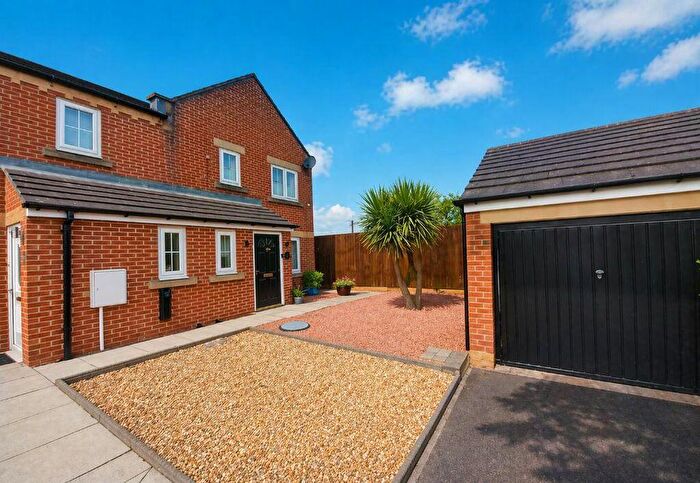
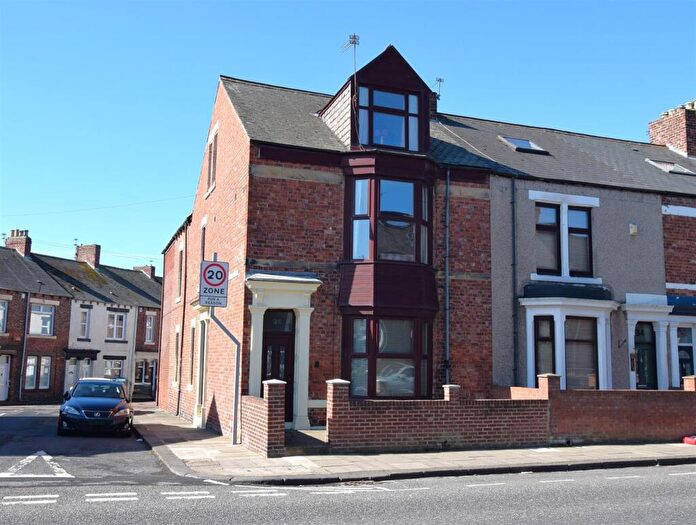
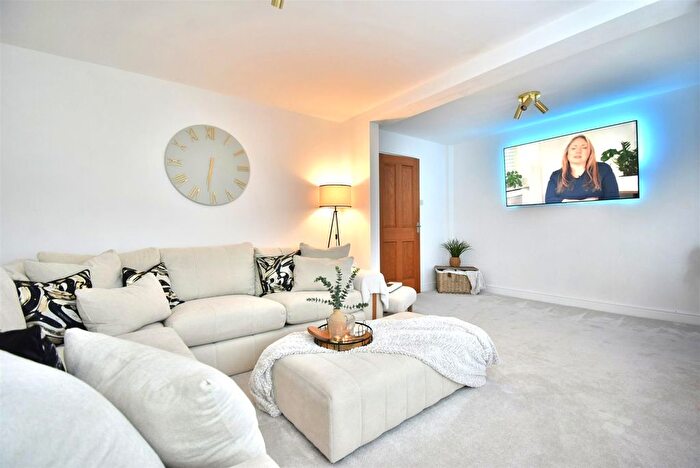
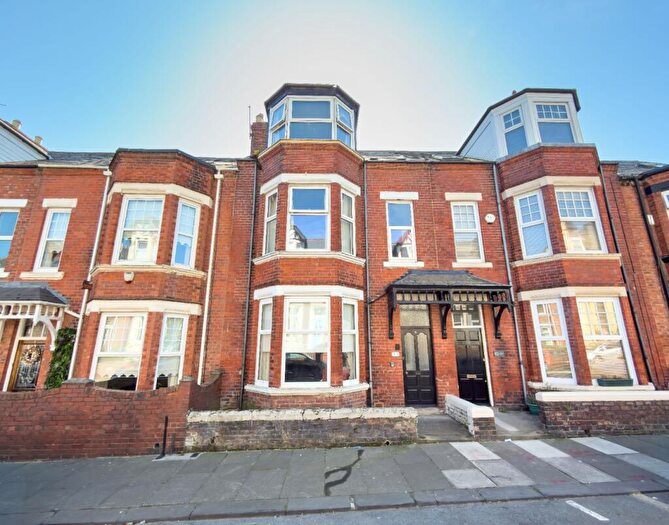
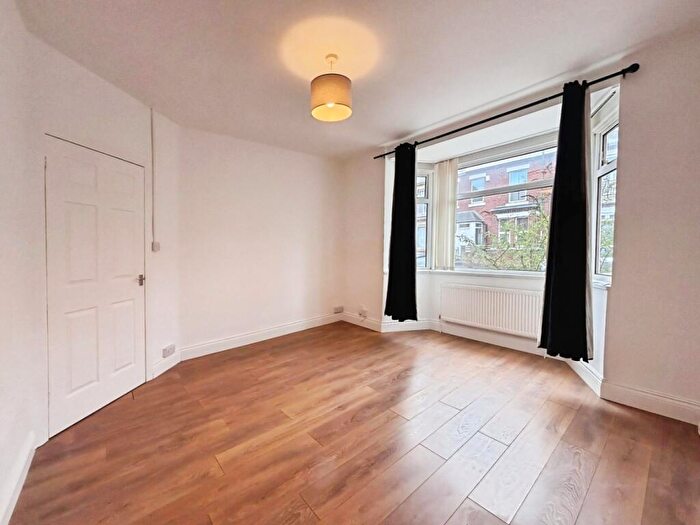
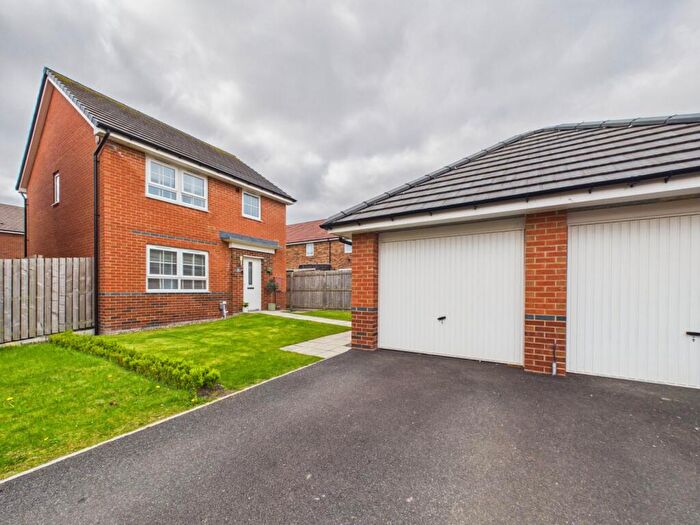
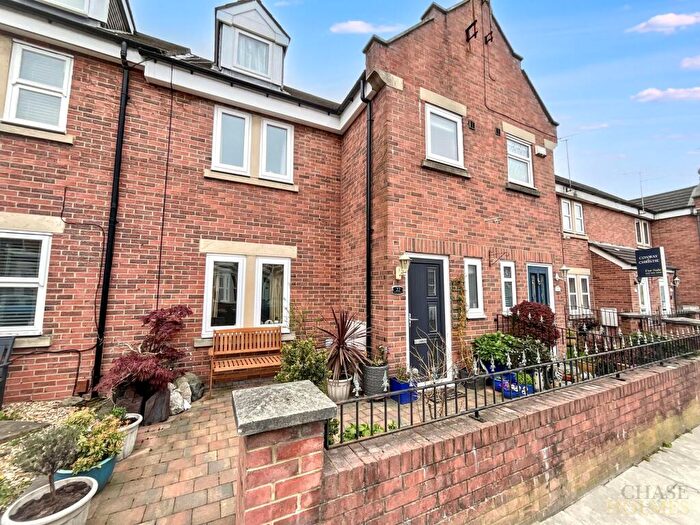
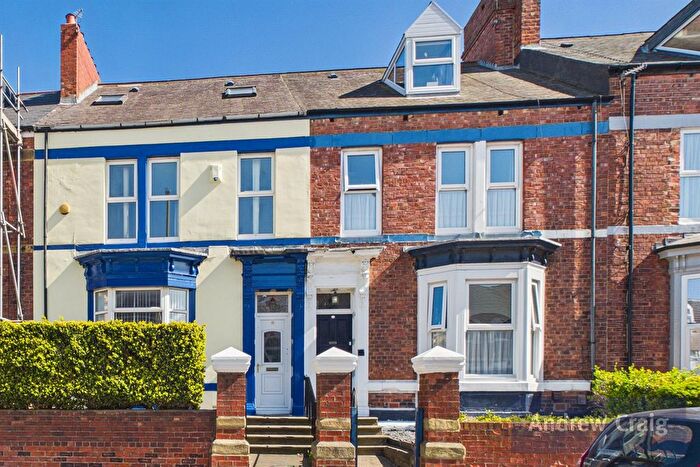
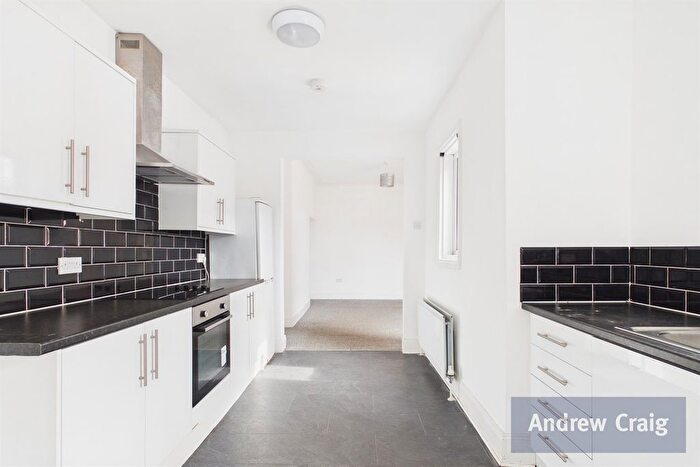
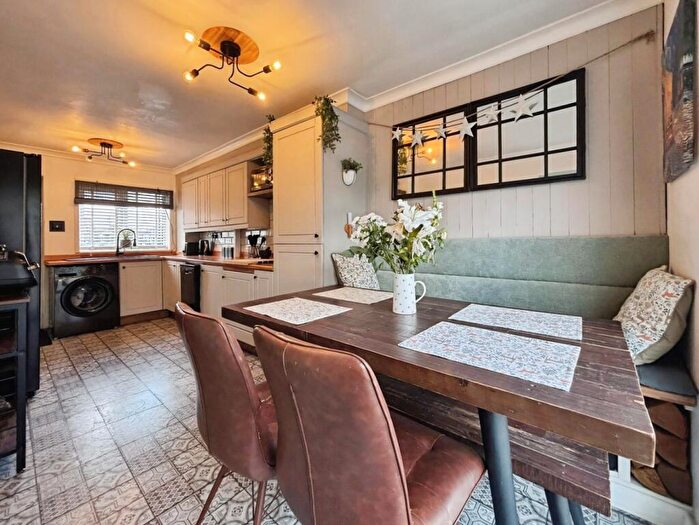
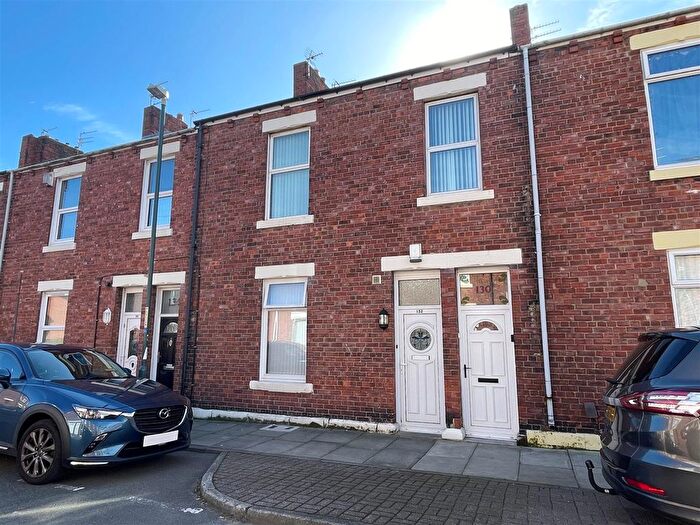
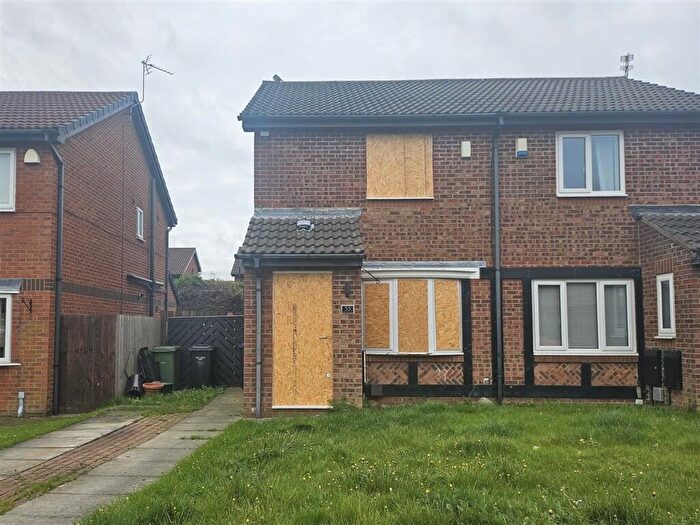
Properties for sale in South Tyneside

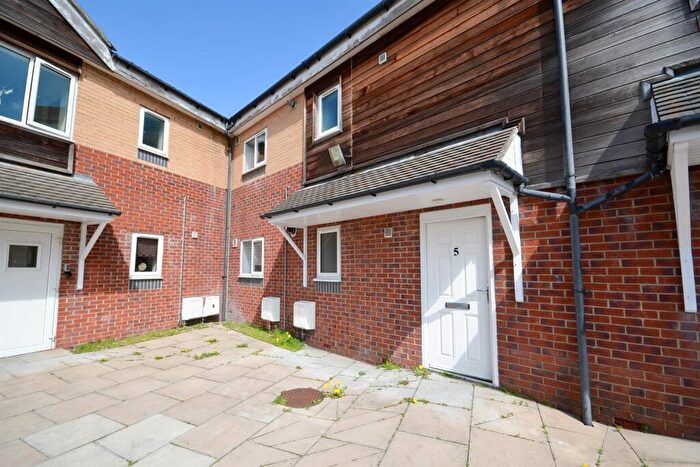
![]()
If you are looking to sell your house, let it out, or receive a property valuation, an expert can help you.
Click the button below to get started.


Towns in South Tyneside
Navigate through our locations to find the location of your next house in South Tyneside, England for sale or to rent.
Transport in South Tyneside
Please see below transportation links in this area:
-
 Heworth Station
 -
Sunderland Station
-
Manors Station
-
Newcastle Station
-
Dunston Station
-
MetroCentre Station
-
Chester-Le-Street Station
- FAQ
- Price Paid By Year
- Property Type Price
Frequently asked questions about South Tyneside
What is the average price for a property for sale in South Tyneside?
The average price for a property for sale in South Tyneside is £172,211. This amount is 52% lower than the average price in England. There are more than 10,000 property listings for sale in South Tyneside.
What locations have the most expensive properties for sale in South Tyneside?
The locations with the most expensive properties for sale in South Tyneside are Sunderland at an average of £310,244, East Boldon at an average of £234,398 and Hebburn at an average of £170,226.
What locations have the most affordable properties for sale in South Tyneside?
The locations with the most affordable properties for sale in South Tyneside are Jarrow at an average of £147,010, South Shields at an average of £152,014 and Boldon Colliery at an average of £164,431.
Which train stations are available in or near South Tyneside?
Some of the train stations available in or near South Tyneside are Heworth, Sunderland and Manors.
Property Price Paid in South Tyneside by Year
The average sold property price by year was:
| Year | Average Sold Price | Price Change |
Sold Properties
|
|---|---|---|---|
| 2026 | £175,604 | -0,3% |
42 Properties |
| 2025 | £176,047 | 3% |
1,614 Properties |
| 2024 | £171,153 | 1% |
1,945 Properties |
| 2023 | £169,761 | 2% |
1,746 Properties |
| 2022 | £165,996 | 1% |
2,147 Properties |
| 2021 | £163,645 | 5% |
2,445 Properties |
| 2020 | £155,546 | 3% |
1,713 Properties |
| 2019 | £151,635 | -1% |
2,048 Properties |
| 2018 | £152,639 | 6% |
1,958 Properties |
| 2017 | £143,017 | - |
2,020 Properties |
| 2016 | £142,986 | 2% |
2,035 Properties |
| 2015 | £140,493 | 4% |
1,979 Properties |
| 2014 | £134,676 | 4% |
1,954 Properties |
| 2013 | £129,240 | 4% |
1,574 Properties |
| 2012 | £124,694 | -1% |
1,290 Properties |
| 2011 | £125,388 | -8% |
1,348 Properties |
| 2010 | £134,934 | 3% |
1,229 Properties |
| 2009 | £130,925 | 2% |
1,134 Properties |
| 2008 | £128,880 | -5% |
1,552 Properties |
| 2007 | £135,237 | 5% |
3,135 Properties |
| 2006 | £128,192 | 6% |
2,968 Properties |
| 2005 | £120,397 | 9% |
2,401 Properties |
| 2004 | £109,917 | 21% |
2,672 Properties |
| 2003 | £87,142 | 21% |
2,842 Properties |
| 2002 | £68,636 | 8% |
2,695 Properties |
| 2001 | £62,813 | 8% |
2,353 Properties |
| 2000 | £58,093 | 3% |
2,146 Properties |
| 1999 | £56,081 | 6% |
1,944 Properties |
| 1998 | £52,930 | 3% |
1,919 Properties |
| 1997 | £51,384 | 6% |
1,932 Properties |
| 1996 | £48,294 | 1% |
1,827 Properties |
| 1995 | £47,703 | - |
1,585 Properties |
Property Price per Property Type in South Tyneside
Here you can find historic sold price data in order to help with your property search.
The average Property Paid Price for specific property types in the last three years are:
| Property Type | Average Sold Price | Sold Properties |
|---|---|---|
| Semi Detached House | £194,240.00 | 1,865 Semi Detached Houses |
| Terraced House | £143,337.00 | 1,945 Terraced Houses |
| Detached House | £361,235.00 | 521 Detached Houses |
| Flat | £90,117.00 | 1,016 Flats |