
Houses for sale & to rent in Surrey, England
House Prices in Surrey
Properties in Surrey have
an average house price of
£609k
and had 52,734 Property Transactions
within the last 3 years.¹
Surrey is a location in
England with
504,468 households², where the most expensive property was sold for £34M.
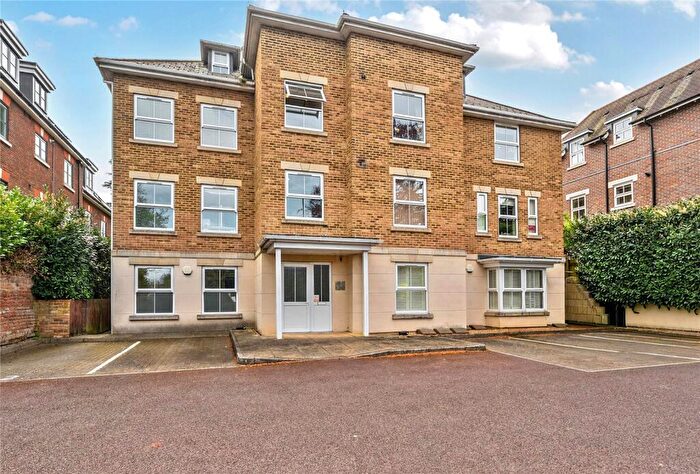
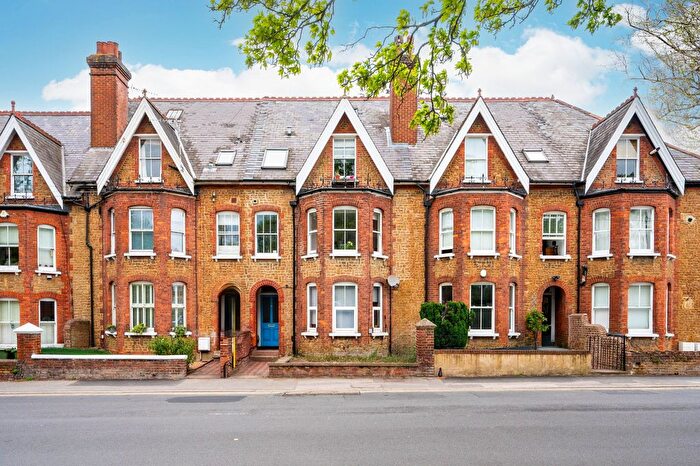
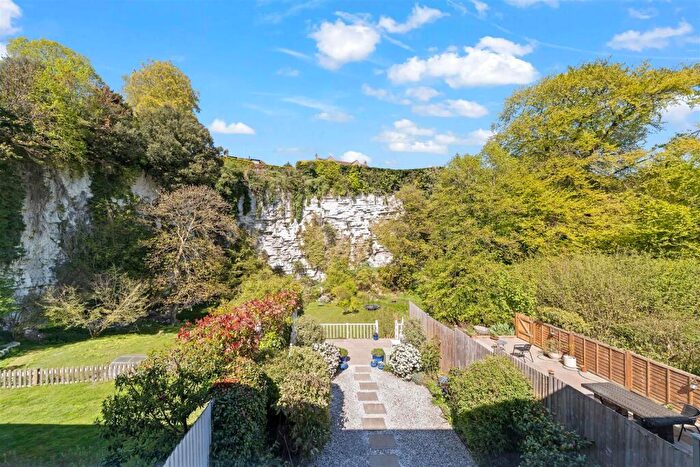
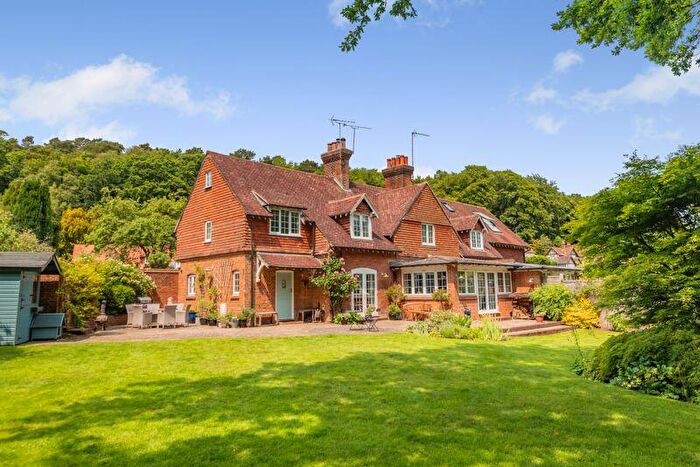
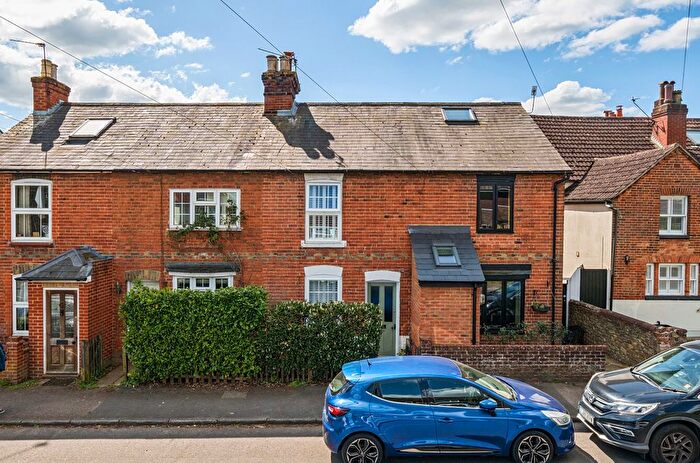
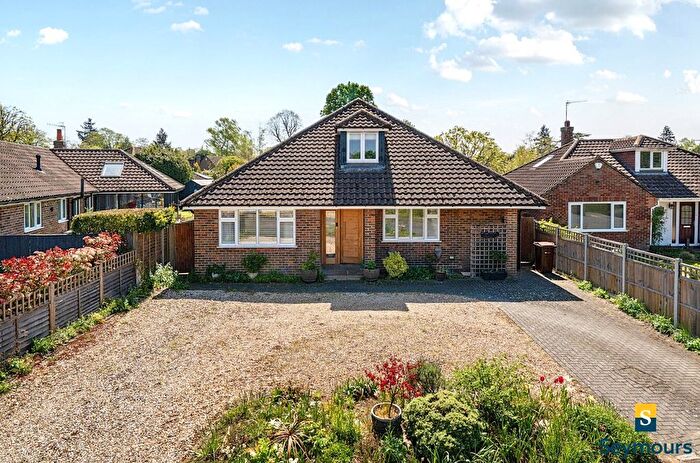
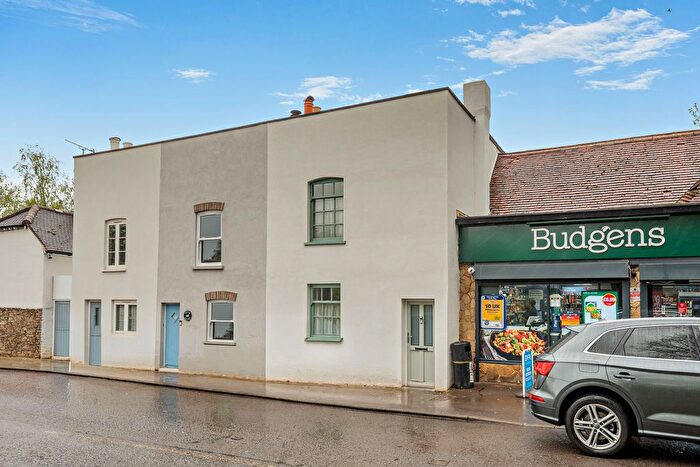
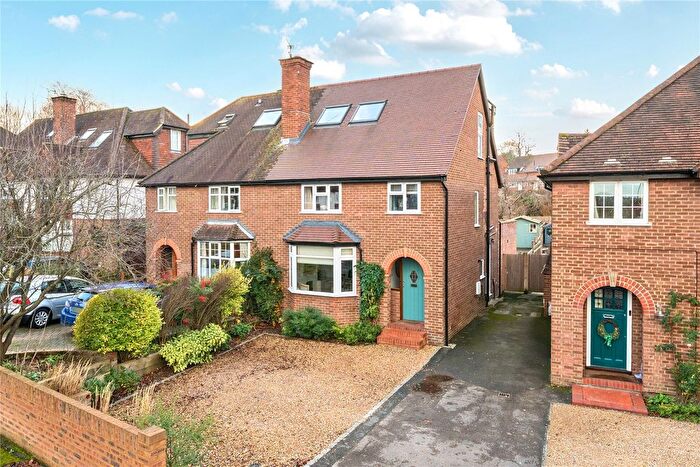
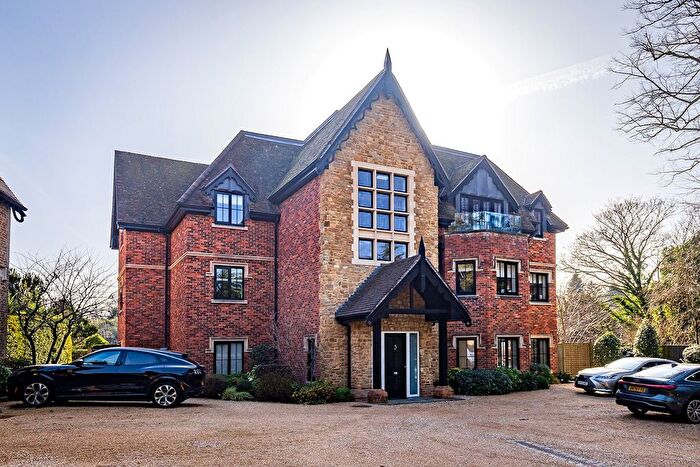
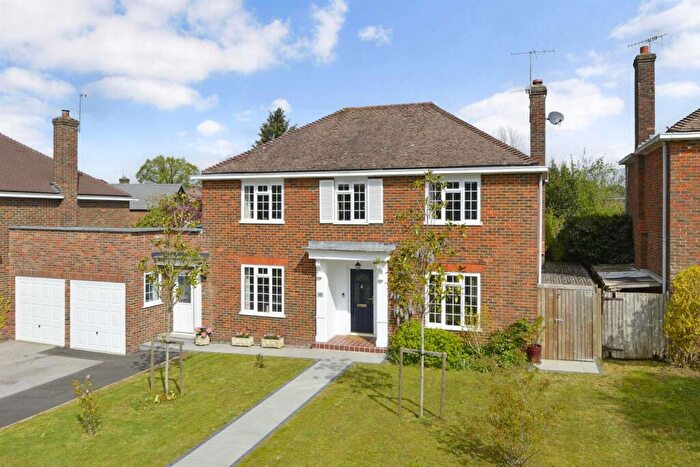
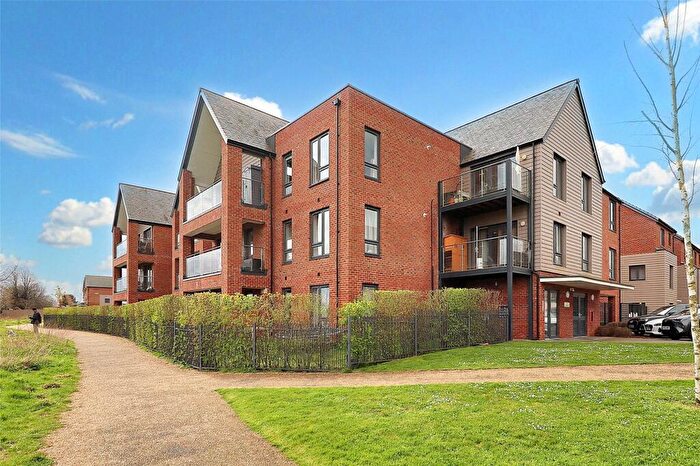
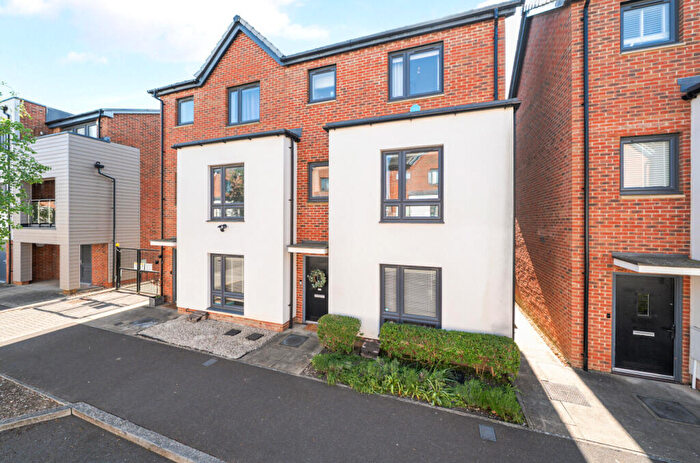
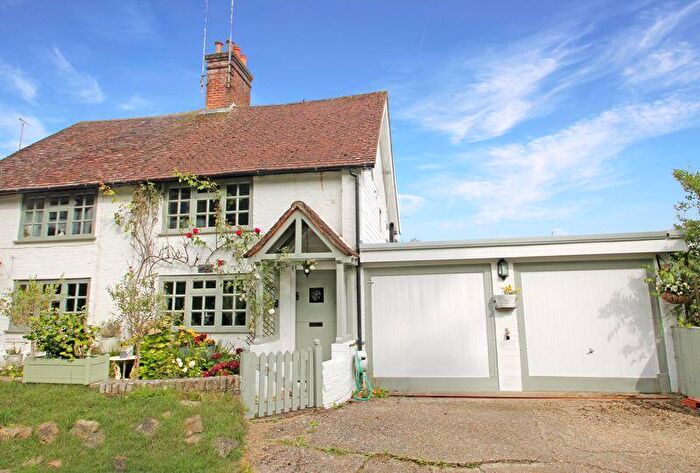
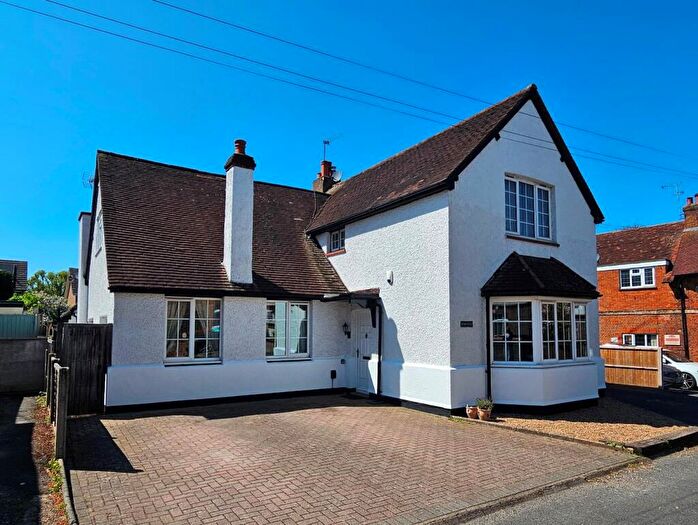
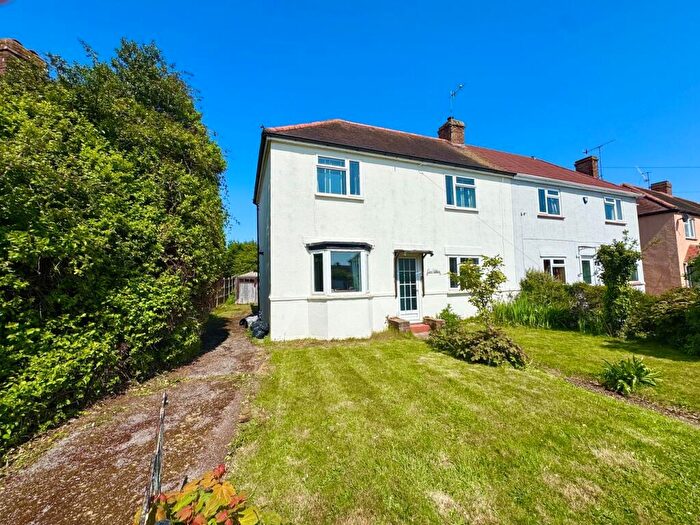
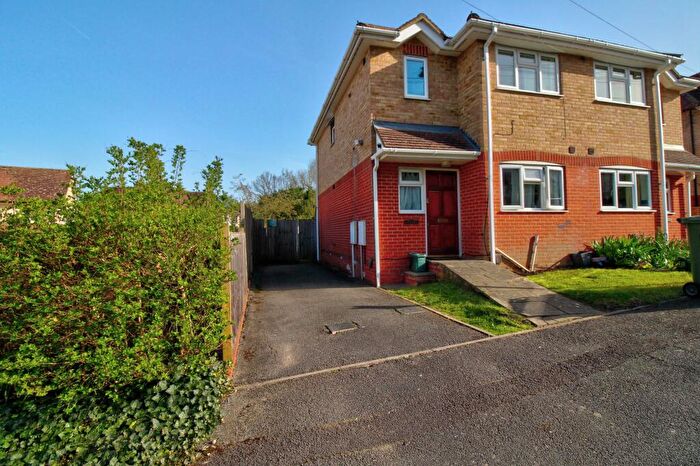
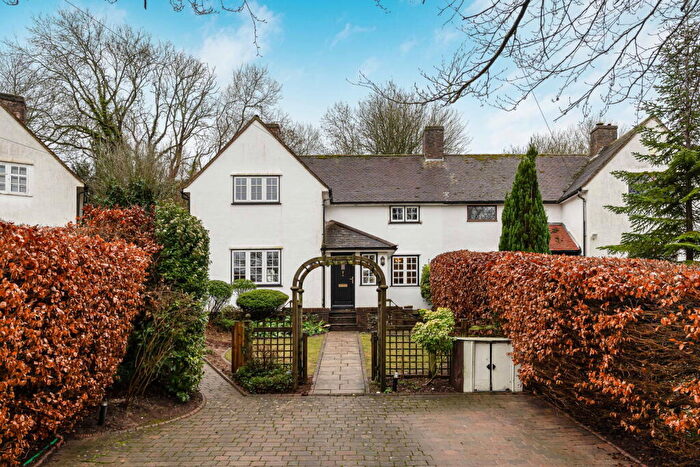
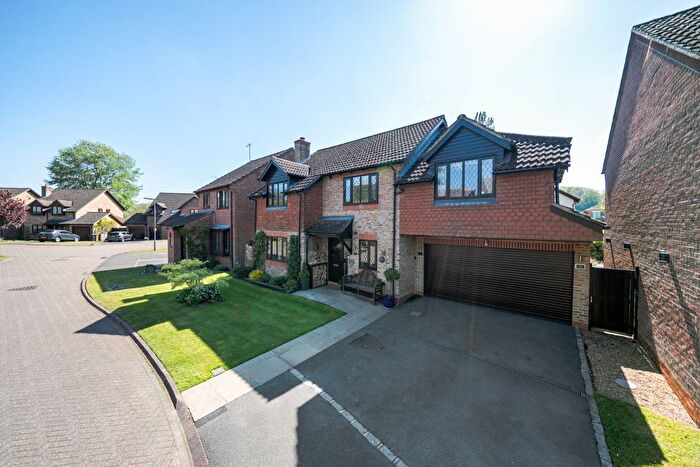
Properties for sale in Surrey

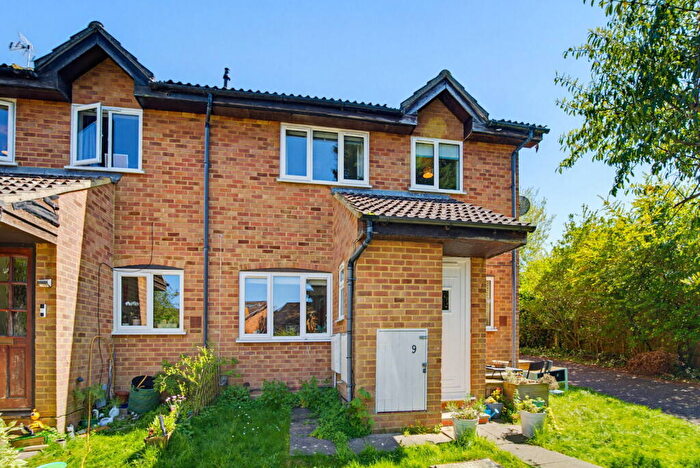
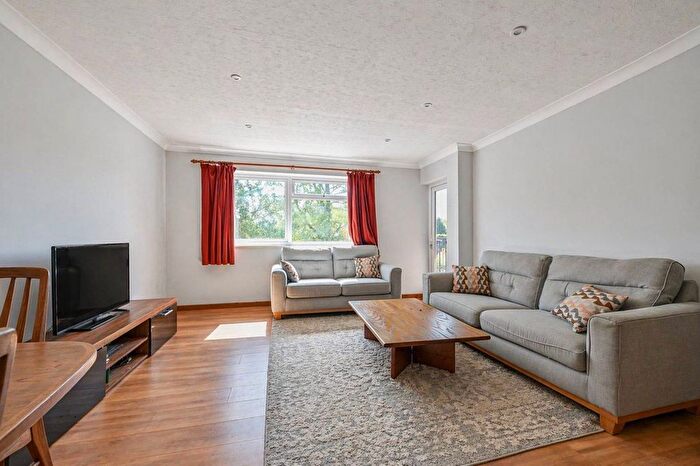
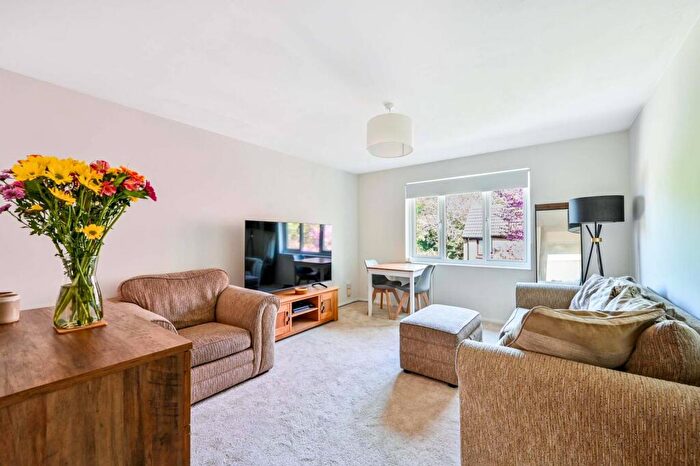
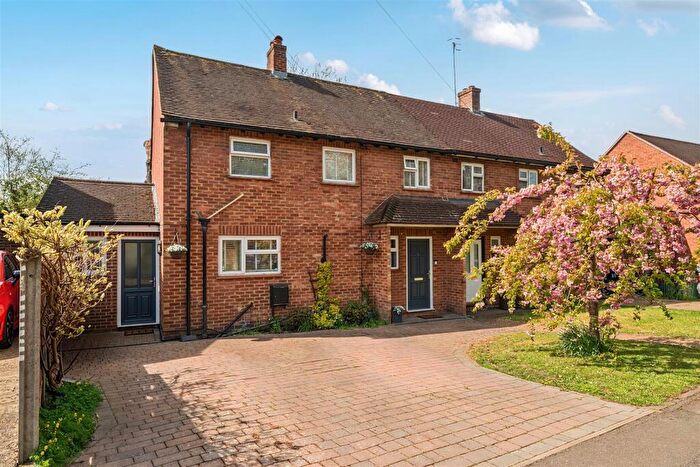
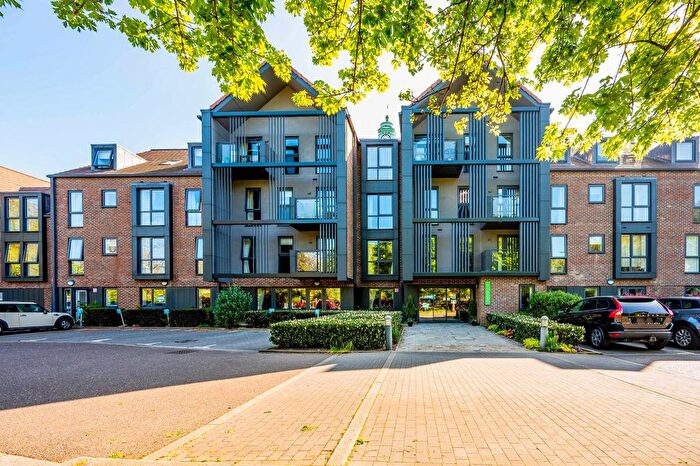
![]()
If you are looking to sell your house, let it out, or receive a property valuation, an expert can help you.
Click the button below to get started.
Towns in Surrey
Navigate through our locations to find the location of your next house in Surrey, England for sale or to rent.
- Addlestone
- Aldershot
- Ascot
- Ashford
- Ashtead
- Bagshot
- Banstead
- Betchworth
- Billingshurst
- Camberley
- Carshalton
- Caterham
- Chertsey
- Chessington
- Chichester
- Cobham
- Coulsdon
- Cranleigh
- Crawley
- Dorking
- East Grinstead
- East Molesey
- Edenbridge
- Egham
- Emsworth
- Epsom
- Esher
- Farnham
- Feltham
- Godalming
- Godstone
- Guildford
- Haslemere
- Hindhead
- Horley
- Horsham
- Kenley
- Leatherhead
- Lightwater
- Lingfield
- Liphook
- Liss
- Midhurst
- Oxted
- Petersfield
- Petworth
- Pulborough
- Redhill
- Reigate
- Rowlands Castle
- Shepperton
- Staines
- Staines-upon-thames
- Sunbury-on-thames
- Surbiton
- Sutton
- Tadworth
- Thames Ditton
- Virginia Water
- Walton-on-thames
- Warlingham
- West Byfleet
- West Molesey
- Westerham
- Weybridge
- Whyteleafe
- Windlesham
- Windsor
- Woking
- Worcester Park
- Hounslow
- Gatwick
Transport in Surrey
Please see below transportation links in this area:

- FAQ
- Price Paid By Year
- Property Type Price
Frequently asked questions about Surrey
What is the average price for a property for sale in Surrey?
The average price for a property for sale in Surrey is £608,985. This amount is 70% higher than the average price in England. There are more than 10,000 property listings for sale in Surrey.
What locations have the most expensive properties for sale in Surrey?
The locations with the most expensive properties for sale in Surrey are Ascot at an average of £5,143,750, Virginia Water at an average of £1,572,649 and Liphook at an average of £1,335,792.
What locations have the most affordable properties for sale in Surrey?
The locations with the most affordable properties for sale in Surrey are Whyteleafe at an average of £329,613, Staines-upon-thames at an average of £411,040 and Aldershot at an average of £415,194.
Which train stations are available in or near Surrey?
Some of the train stations available in or near Surrey are Clandon, Gomshall and Chilworth.
Property Price Paid in Surrey by Year
The average sold property price by year was:
| Year | Average Sold Price | Price Change |
Sold Properties
|
|---|---|---|---|
| 2026 | £562,399 | -6% |
1,239 Properties |
| 2025 | £598,821 | -2% |
16,895 Properties |
| 2024 | £608,408 | -3% |
18,210 Properties |
| 2023 | £623,625 | -1% |
16,390 Properties |
| 2022 | £632,880 | 6% |
21,901 Properties |
| 2021 | £595,115 | 4% |
28,084 Properties |
| 2020 | £571,098 | 8% |
19,259 Properties |
| 2019 | £523,434 | 0,4% |
20,336 Properties |
| 2018 | £521,365 | 0,1% |
20,656 Properties |
| 2017 | £520,978 | 5% |
21,569 Properties |
| 2016 | £496,870 | 6% |
22,822 Properties |
| 2015 | £467,365 | 5% |
24,288 Properties |
| 2014 | £444,083 | 7% |
25,258 Properties |
| 2013 | £411,847 | 4% |
23,017 Properties |
| 2012 | £394,829 | 1% |
19,277 Properties |
| 2011 | £390,644 | -0,5% |
19,201 Properties |
| 2010 | £392,582 | 12% |
19,446 Properties |
| 2009 | £347,418 | -6% |
17,741 Properties |
| 2008 | £368,164 | 0,2% |
15,974 Properties |
| 2007 | £367,483 | 10% |
31,392 Properties |
| 2006 | £331,457 | 8% |
32,805 Properties |
| 2005 | £305,579 | 3% |
25,744 Properties |
| 2004 | £296,837 | 8% |
27,907 Properties |
| 2003 | £272,995 | 8% |
26,689 Properties |
| 2002 | £251,650 | 12% |
31,331 Properties |
| 2001 | £221,276 | 8% |
29,506 Properties |
| 2000 | £204,353 | 16% |
26,858 Properties |
| 1999 | £171,818 | 12% |
31,442 Properties |
| 1998 | £151,067 | 13% |
27,334 Properties |
| 1997 | £131,538 | 10% |
29,756 Properties |
| 1996 | £117,790 | 4% |
26,658 Properties |
| 1995 | £112,665 | - |
20,327 Properties |
Property Price per Property Type in Surrey
Here you can find historic sold price data in order to help with your property search.
The average Property Paid Price for specific property types in the last three years are:
| Property Type | Average Sold Price | Sold Properties |
|---|---|---|
| Semi Detached House | £553,906.00 | 14,385 Semi Detached Houses |
| Terraced House | £457,894.00 | 10,031 Terraced Houses |
| Detached House | £1,015,863.00 | 15,492 Detached Houses |
| Flat | £297,473.00 | 12,826 Flats |