
Houses for sale & to rent in Warrington, England
House Prices in Warrington
Properties in Warrington have
an average house price of
£277k
and had 8,353 Property Transactions
within the last 3 years.¹
Warrington is a location in
England with
85,141 households², where the most expensive property was sold for £2.7M.
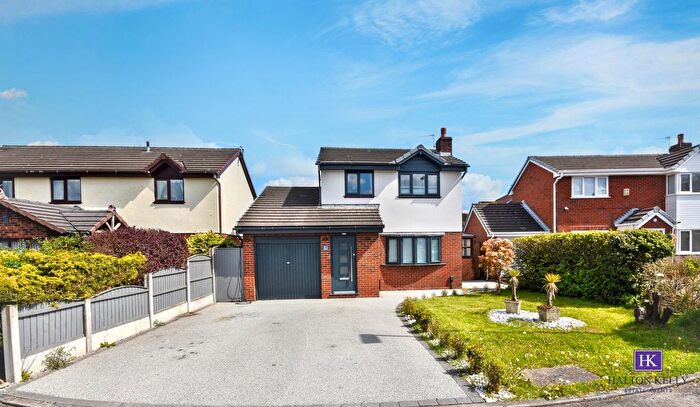
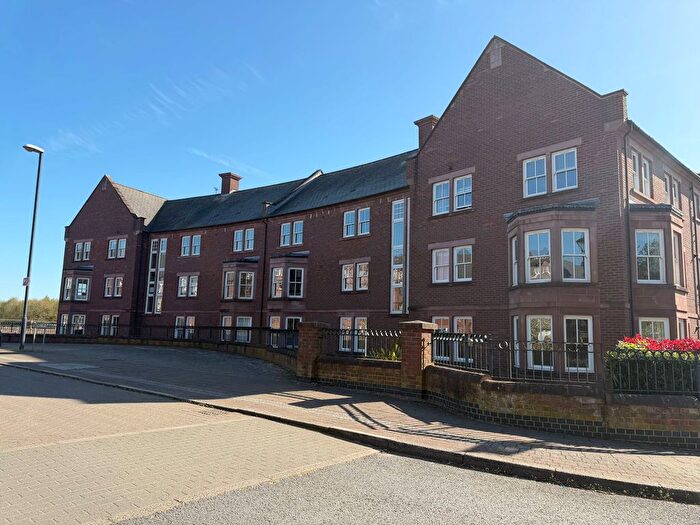
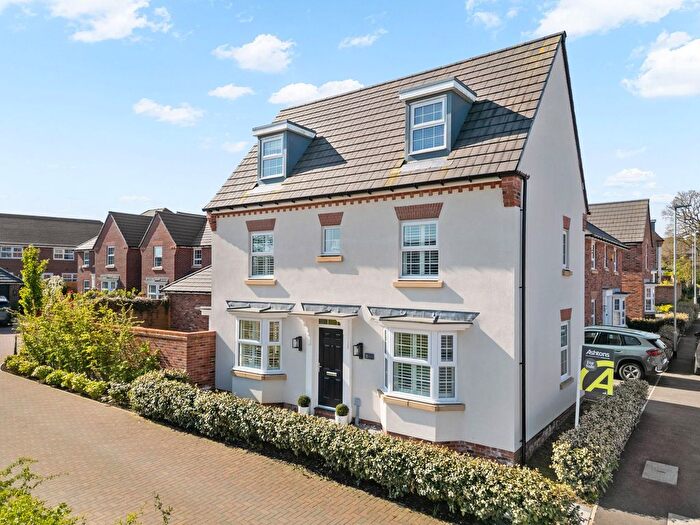
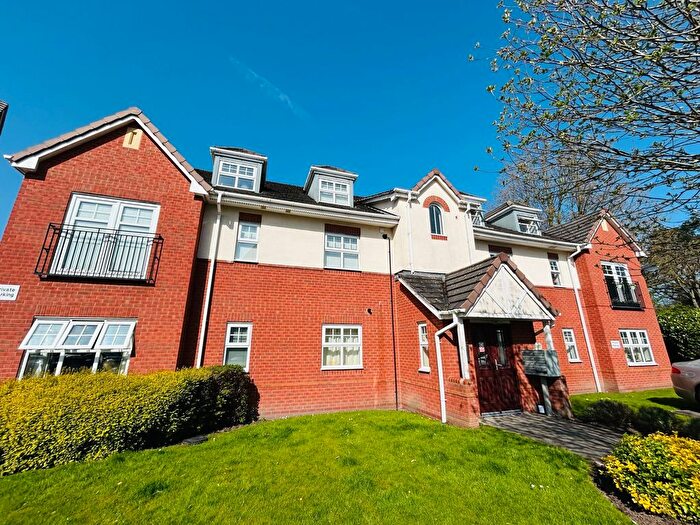
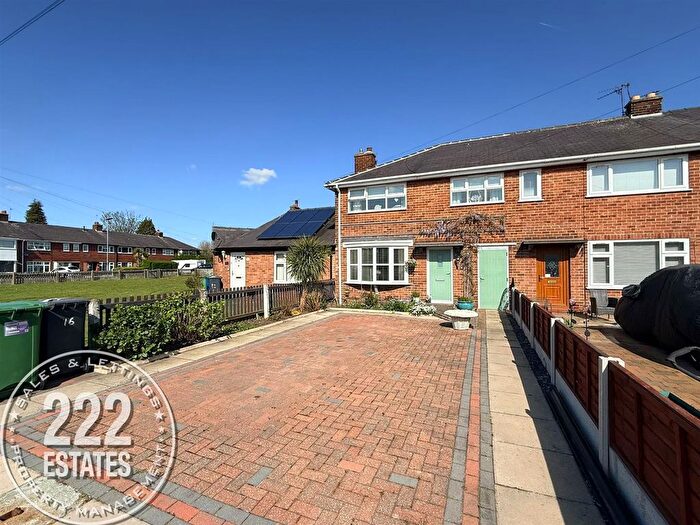
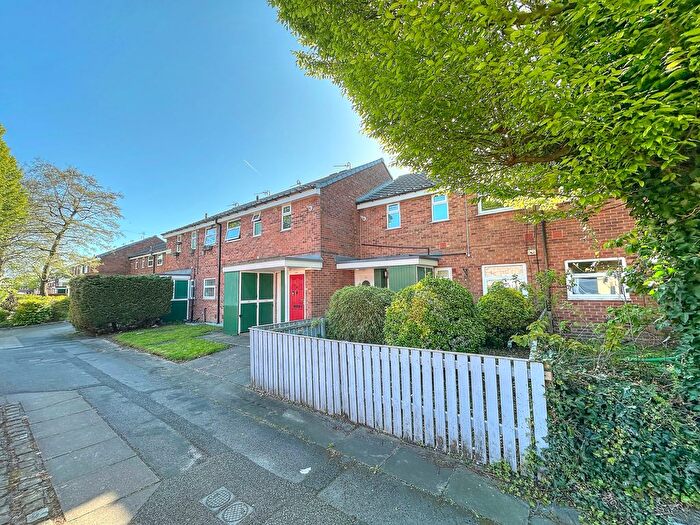
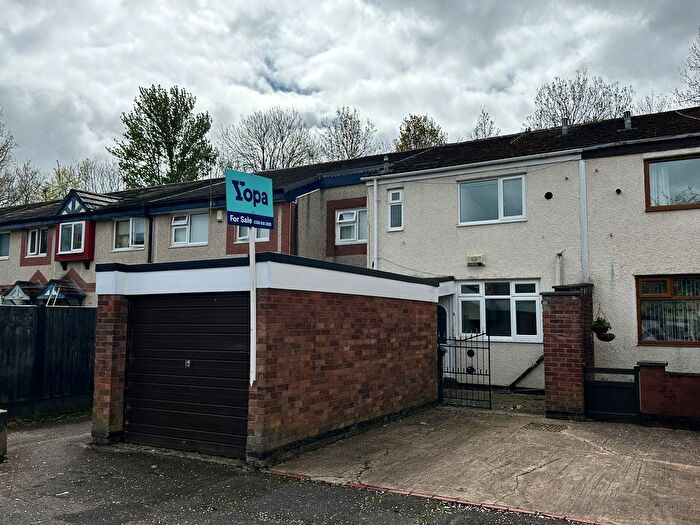
Properties for sale in Warrington
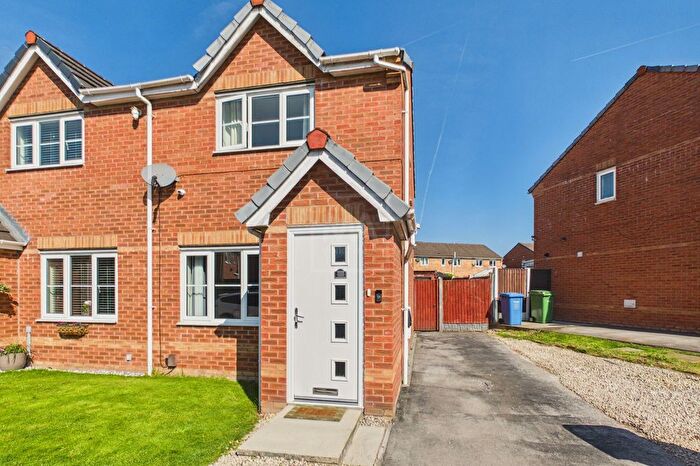
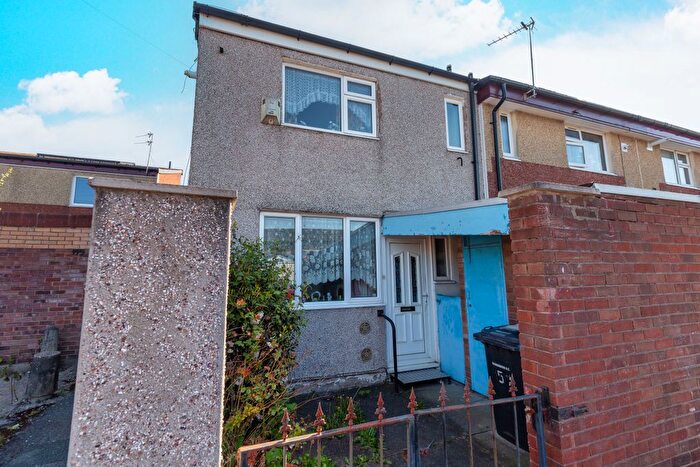
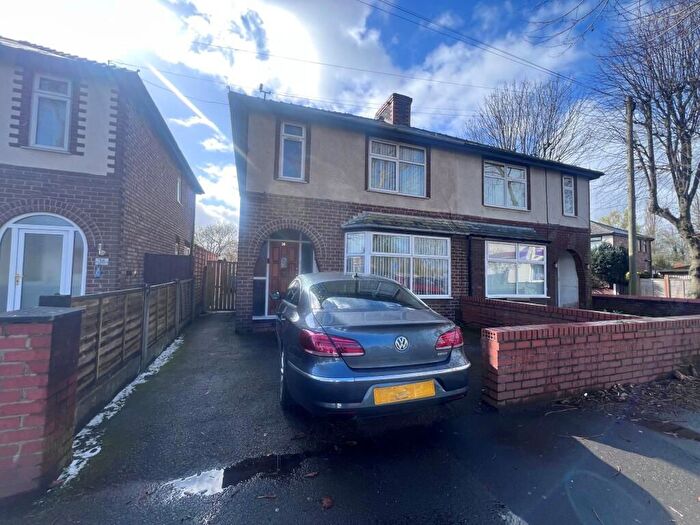
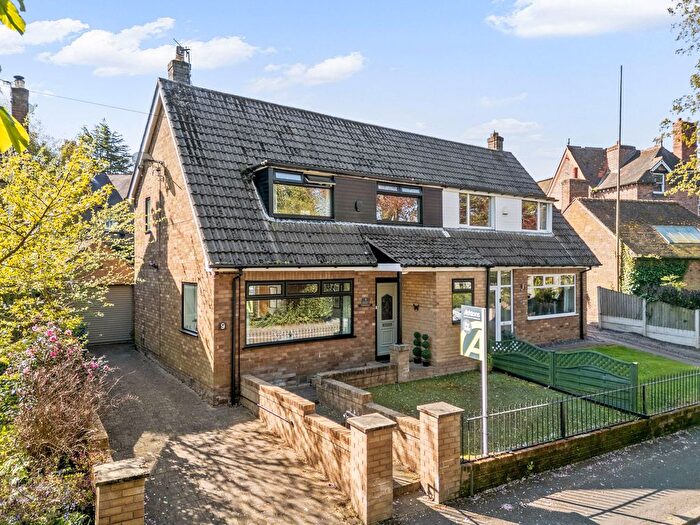
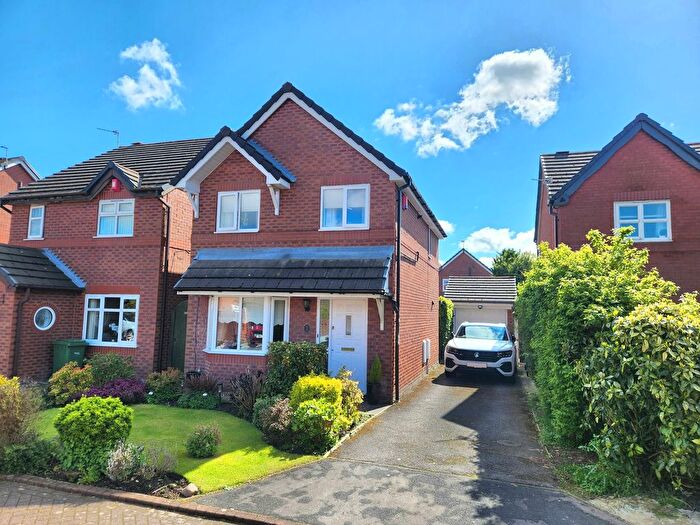
![]()
If you are looking to sell your house, let it out, or receive a property valuation, an expert can help you.
Click the button below to get started.
Towns in Warrington
Navigate through our locations to find the location of your next house in Warrington, England for sale or to rent.
Transport in Warrington
Please see below transportation links in this area:

- FAQ
- Price Paid By Year
- Property Type Price
Frequently asked questions about Warrington
What is the average price for a property for sale in Warrington?
The average price for a property for sale in Warrington is £276,763. This amount is 23% lower than the average price in England. There are more than 10,000 property listings for sale in Warrington.
What locations have the most expensive properties for sale in Warrington?
The locations with the most expensive properties for sale in Warrington are Lymm at an average of £413,521 and Warrington at an average of £266,616.
What locations have the most affordable properties for sale in Warrington?
The location with the most affordable properties for sale in Warrington is St Helens at an average of £150,000.
Which train stations are available in or near Warrington?
Some of the train stations available in or near Warrington are Padgate, Warrington Central and Warrington Bank Quay.
Property Price Paid in Warrington by Year
The average sold property price by year was:
| Year | Average Sold Price | Price Change |
Sold Properties
|
|---|---|---|---|
| 2026 | £288,383 | 1% |
198 Properties |
| 2025 | £284,317 | 5% |
2,770 Properties |
| 2024 | £271,434 | -1% |
2,810 Properties |
| 2023 | £273,558 | 2% |
2,575 Properties |
| 2022 | £267,553 | 2% |
3,328 Properties |
| 2021 | £263,164 | 9% |
4,128 Properties |
| 2020 | £239,134 | 7% |
3,134 Properties |
| 2019 | £223,474 | 4% |
3,439 Properties |
| 2018 | £215,617 | 4% |
3,286 Properties |
| 2017 | £207,004 | 3% |
3,490 Properties |
| 2016 | £200,990 | 2% |
3,639 Properties |
| 2015 | £196,285 | 7% |
3,569 Properties |
| 2014 | £182,490 | 1% |
3,549 Properties |
| 2013 | £180,357 | 1% |
2,851 Properties |
| 2012 | £177,697 | -2% |
2,230 Properties |
| 2011 | £182,124 | -1% |
2,144 Properties |
| 2010 | £184,271 | 9% |
2,195 Properties |
| 2009 | £167,561 | -5% |
2,017 Properties |
| 2008 | £175,263 | -2% |
2,470 Properties |
| 2007 | £178,984 | 1% |
5,072 Properties |
| 2006 | £176,670 | 6% |
4,915 Properties |
| 2005 | £166,692 | 4% |
3,591 Properties |
| 2004 | £159,573 | 13% |
4,315 Properties |
| 2003 | £138,094 | 15% |
4,671 Properties |
| 2002 | £117,229 | 16% |
4,709 Properties |
| 2001 | £98,628 | 13% |
4,120 Properties |
| 2000 | £86,235 | 9% |
3,853 Properties |
| 1999 | £78,812 | 8% |
3,692 Properties |
| 1998 | £72,827 | 6% |
3,853 Properties |
| 1997 | £68,204 | 6% |
4,058 Properties |
| 1996 | £64,338 | 0,1% |
3,686 Properties |
| 1995 | £64,294 | - |
2,935 Properties |
Property Price per Property Type in Warrington
Here you can find historic sold price data in order to help with your property search.
The average Property Paid Price for specific property types in the last three years are:
| Property Type | Average Sold Price | Sold Properties |
|---|---|---|
| Semi Detached House | £267,804.00 | 3,273 Semi Detached Houses |
| Terraced House | £193,765.00 | 2,374 Terraced Houses |
| Detached House | £468,838.00 | 1,819 Detached Houses |
| Flat | £138,062.00 | 887 Flats |