
Houses for sale & to rent in Daventry, Warwickshire
House Prices in Daventry
Properties in Daventry have an average house price of £290k and had 1,562 Property Transactions within the last 3 years.¹
Daventry is an area in Warwickshire with 14,716 households², where the most expensive property was sold for £2.8M.
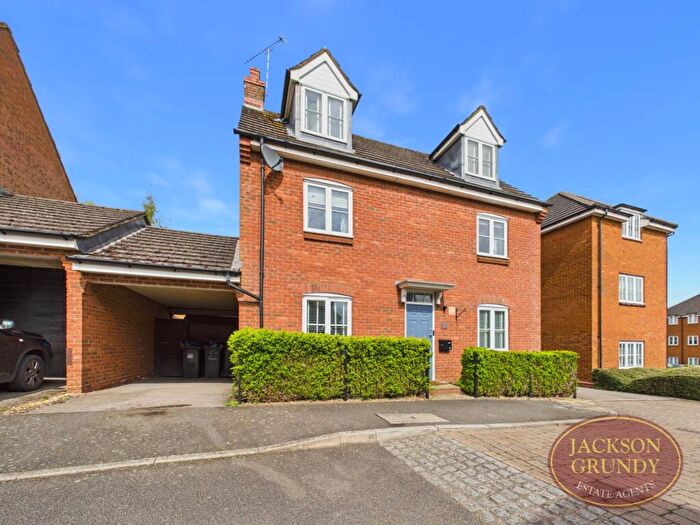
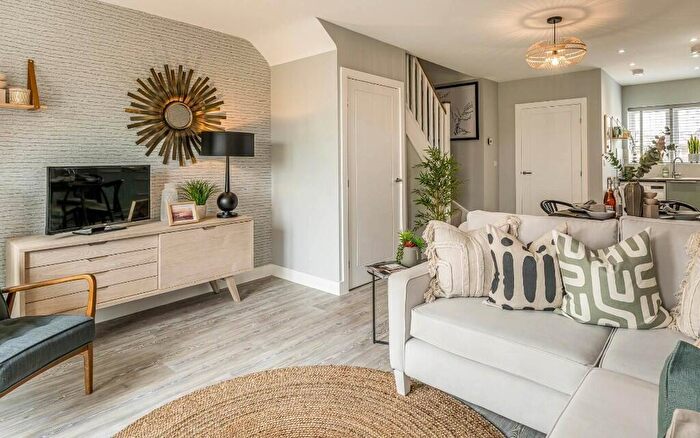
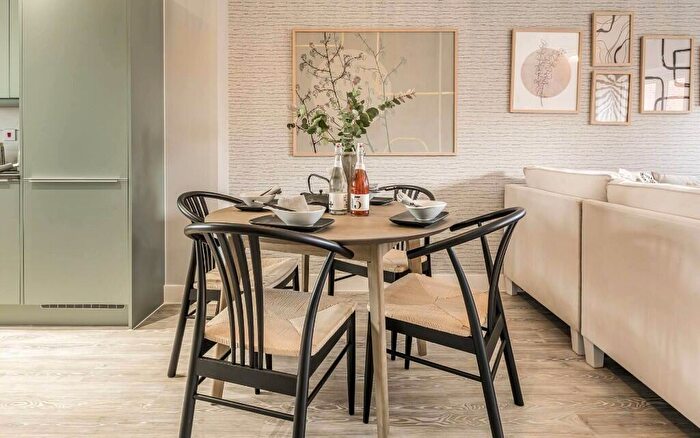
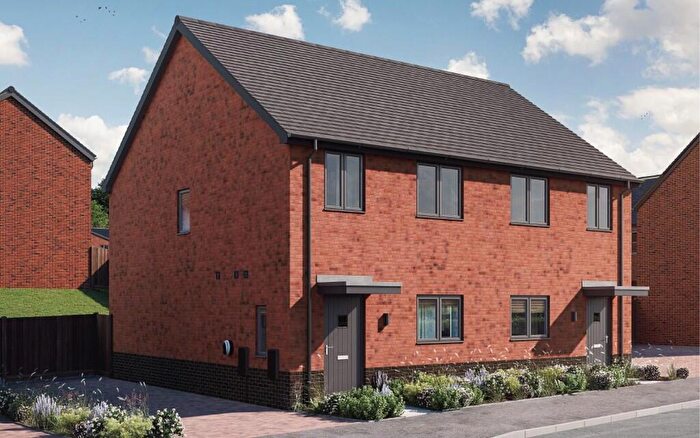
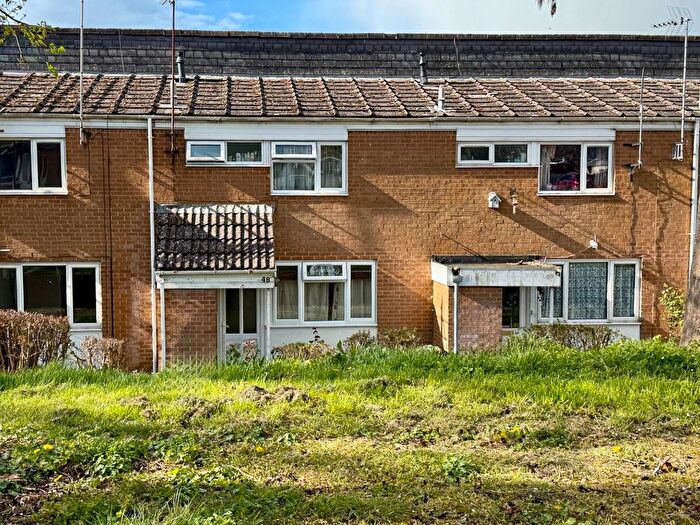
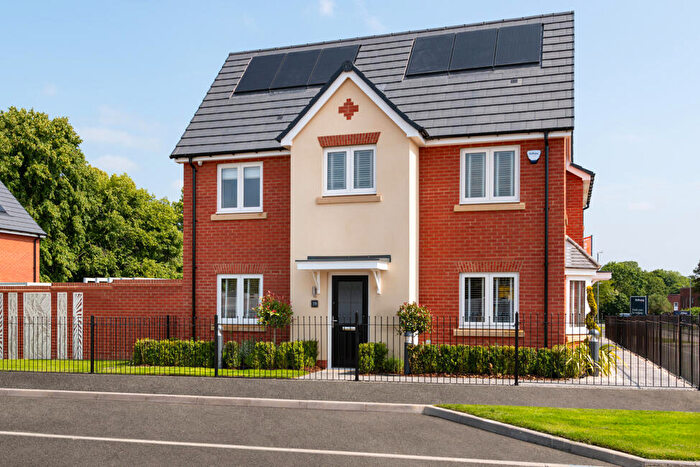
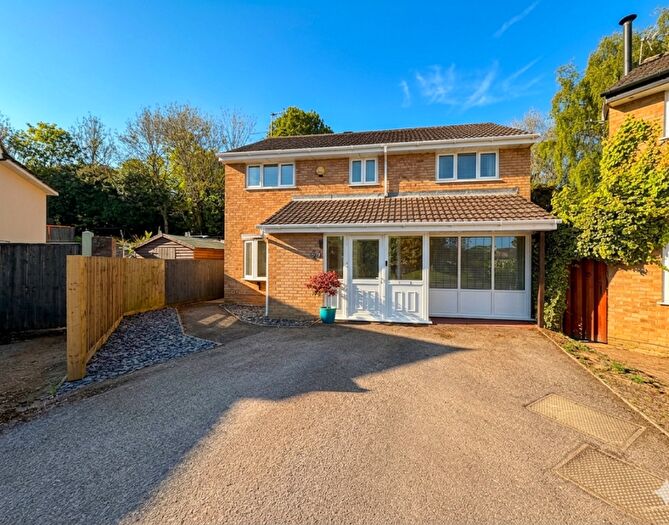
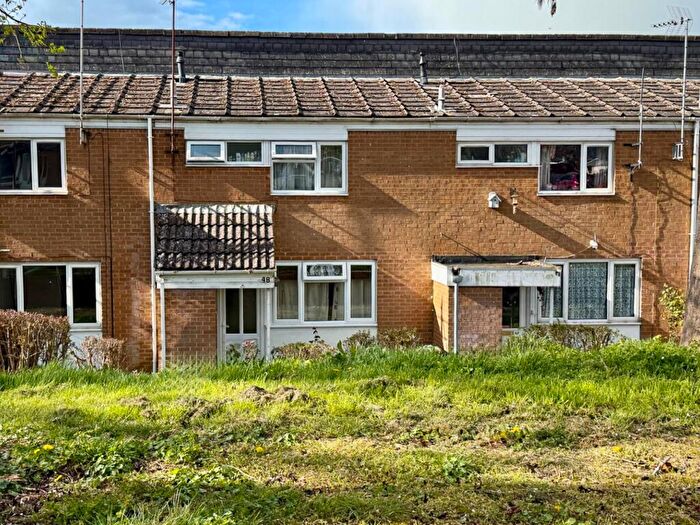
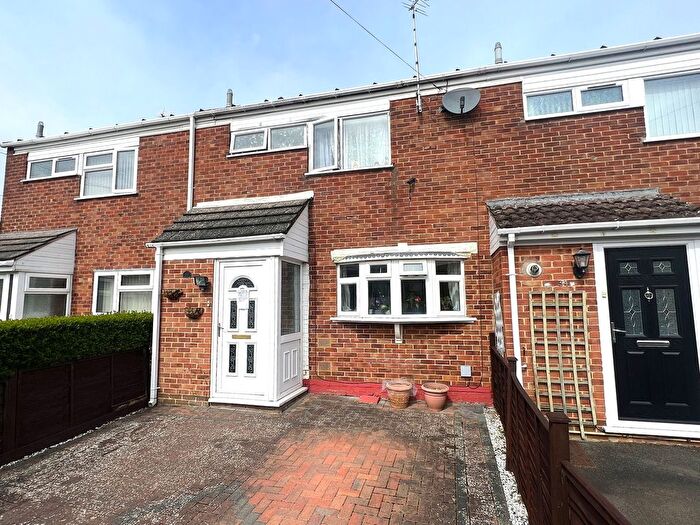
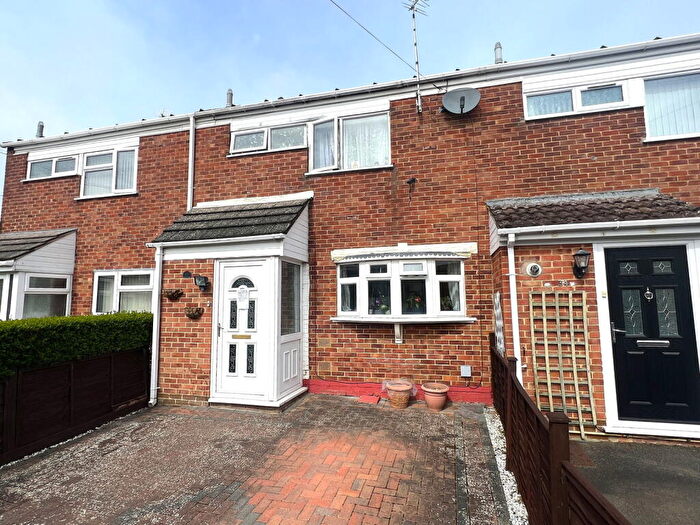
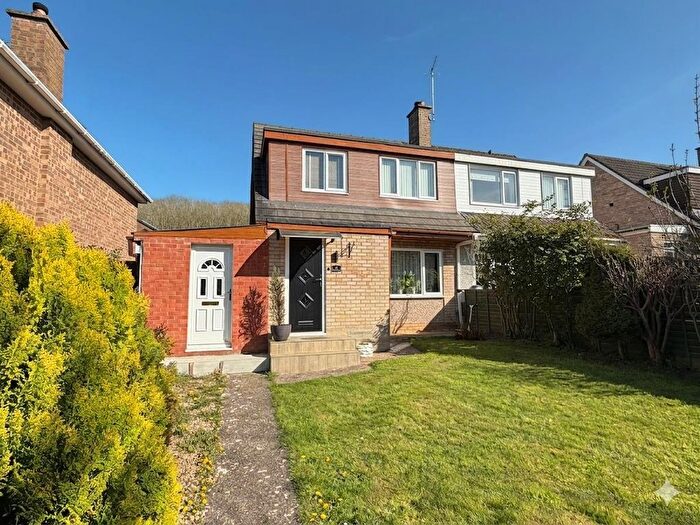
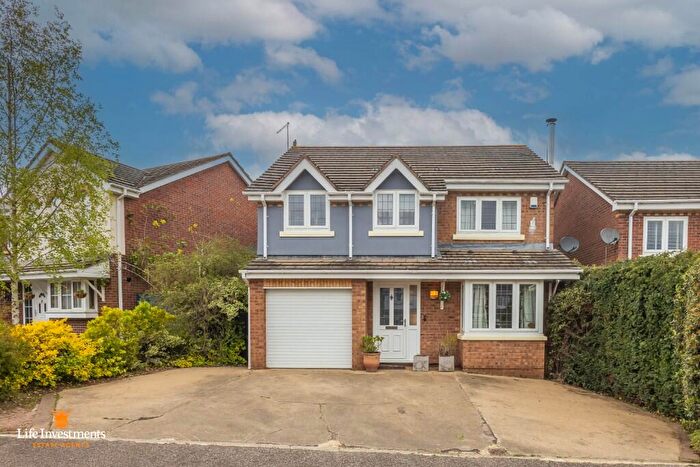
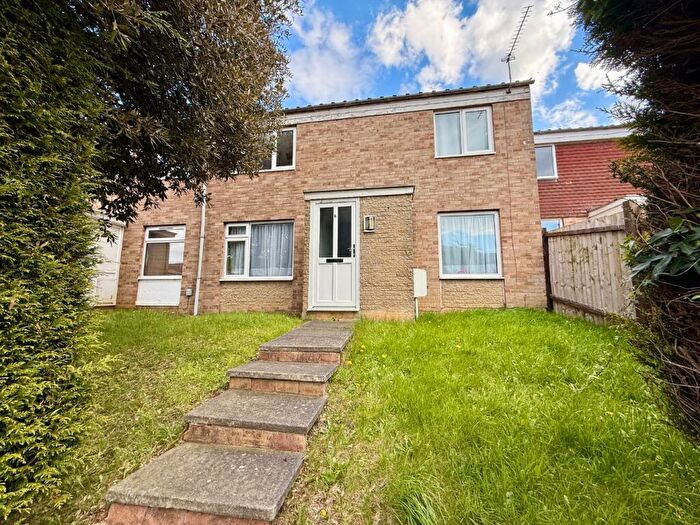
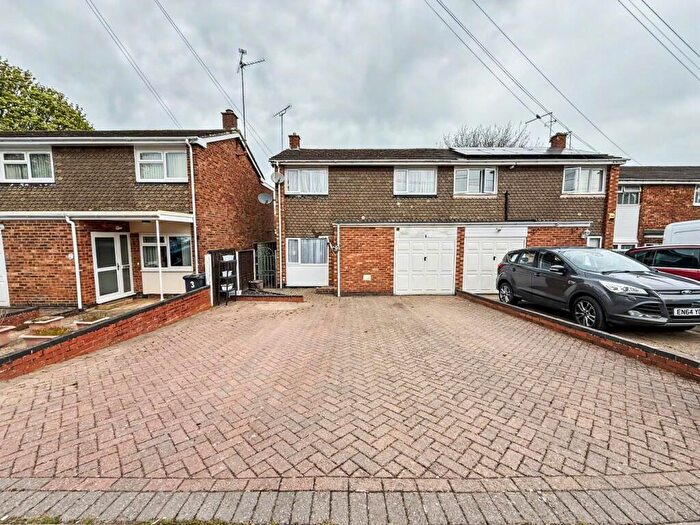
Properties for sale in Daventry

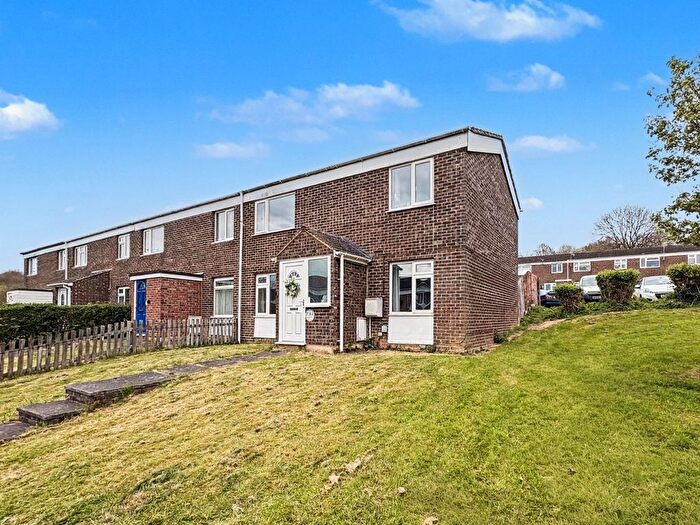

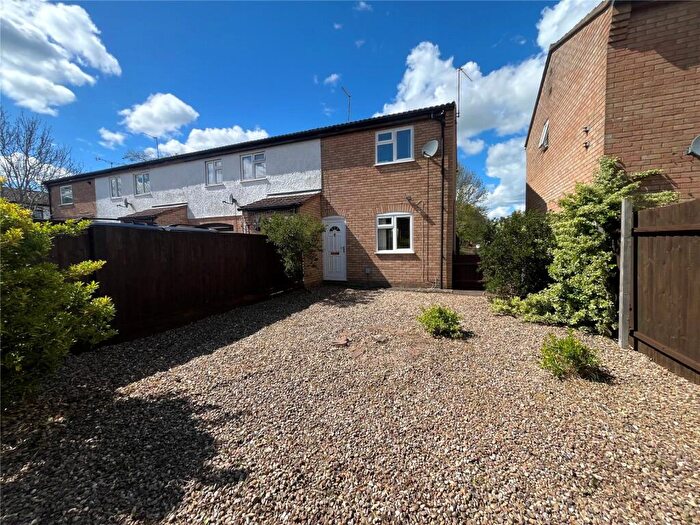
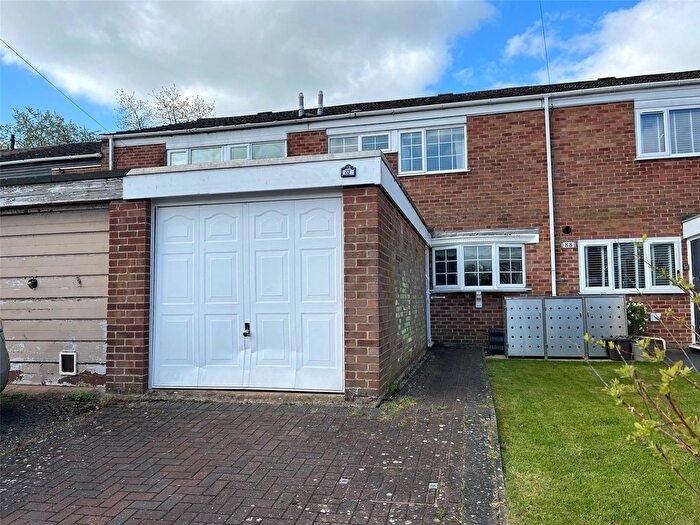

![]()
If you are looking to sell your house, let it out, or receive a property valuation, an expert can help you.
Click the button below to get started.


Neighbourhoods in Daventry
Navigate through our locations to find the location of your next house in Daventry, Warwickshire for sale or to rent.
Transport in Daventry
Please see below transportation links in this area:

- FAQ
- Price Paid By Year
- Property Type Price
Frequently asked questions about Daventry
What is the average price for a property for sale in Daventry?
The average price for a property for sale in Daventry is £290,301. This amount is 16% lower than the average price in Warwickshire. There are more than 10,000 property listings for sale in Daventry.
What locations have the most expensive properties for sale in Daventry?
The locations with the most expensive properties for sale in Daventry are Weedon at an average of £405,755, Woodford at an average of £384,626 and Braunston And Welton at an average of £383,614.
What locations have the most affordable properties for sale in Daventry?
The locations with the most affordable properties for sale in Daventry are Drayton at an average of £240,575, Abbey South at an average of £246,146 and Abbey North at an average of £253,828.
Which train stations are available in or near Daventry?
Some of the train stations available in or near Daventry are Long Buckby, Rugby and Northampton.
Property Price Paid in Daventry by Year
The average sold property price by year was:
| Year | Average Sold Price | Price Change |
Sold Properties
|
|---|---|---|---|
| 2026 | £250,154 | -12% |
42 Properties |
| 2025 | £279,517 | -3% |
534 Properties |
| 2024 | £289,292 | -6% |
535 Properties |
| 2023 | £308,004 | 8% |
451 Properties |
| 2022 | £283,570 | 1% |
652 Properties |
| 2021 | £279,855 | 8% |
745 Properties |
| 2020 | £257,086 | 1% |
578 Properties |
| 2019 | £254,743 | 1% |
692 Properties |
| 2018 | £251,773 | 3% |
723 Properties |
| 2017 | £243,866 | -0,3% |
750 Properties |
| 2016 | £244,673 | 14% |
744 Properties |
| 2015 | £209,564 | 6% |
723 Properties |
| 2014 | £197,310 | 7% |
814 Properties |
| 2013 | £183,940 | 3% |
550 Properties |
| 2012 | £178,064 | -1% |
442 Properties |
| 2011 | £179,043 | -6% |
527 Properties |
| 2010 | £189,908 | 8% |
479 Properties |
| 2009 | £174,717 | -5% |
453 Properties |
| 2008 | £183,086 | -3% |
441 Properties |
| 2007 | £187,862 | 8% |
1,024 Properties |
| 2006 | £173,736 | 3% |
1,019 Properties |
| 2005 | £167,843 | 9% |
922 Properties |
| 2004 | £152,921 | 5% |
1,086 Properties |
| 2003 | £145,878 | 17% |
1,067 Properties |
| 2002 | £121,188 | 9% |
1,264 Properties |
| 2001 | £110,625 | 14% |
1,191 Properties |
| 2000 | £94,590 | 8% |
1,034 Properties |
| 1999 | £86,700 | 7% |
1,072 Properties |
| 1998 | £80,705 | 16% |
865 Properties |
| 1997 | £67,432 | 8% |
1,023 Properties |
| 1996 | £62,174 | 6% |
925 Properties |
| 1995 | £58,644 | - |
741 Properties |
Property Price per Property Type in Daventry
Here you can find historic sold price data in order to help with your property search.
The average Property Paid Price for specific property types in the last three years are:
| Property Type | Average Sold Price | Sold Properties |
|---|---|---|
| Semi Detached House | £257,949.00 | 529 Semi Detached Houses |
| Detached House | £433,187.00 | 488 Detached Houses |
| Terraced House | £214,933.00 | 407 Terraced Houses |
| Flat | £131,315.00 | 138 Flats |