
Houses for sale & to rent in FK3 8QR, Montgomery Street, Grangemouth, Grangemouth
House Prices in FK3 8QR, Montgomery Street, Grangemouth
Properties in FK3 8QR have an average house price of £160k and had 1 Property Transaction within the last 3 years.¹ FK3 8QR is a postcode in Montgomery Street located in Grangemouth, an area in Grangemouth, Falkirk, with 10 households², where the most expensive property was sold for £160k.
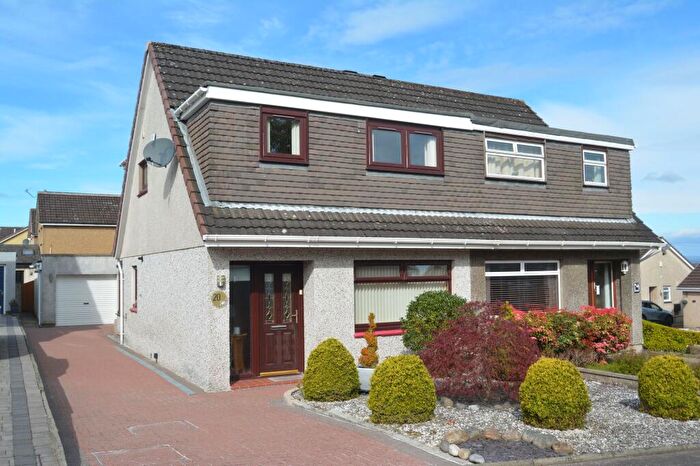
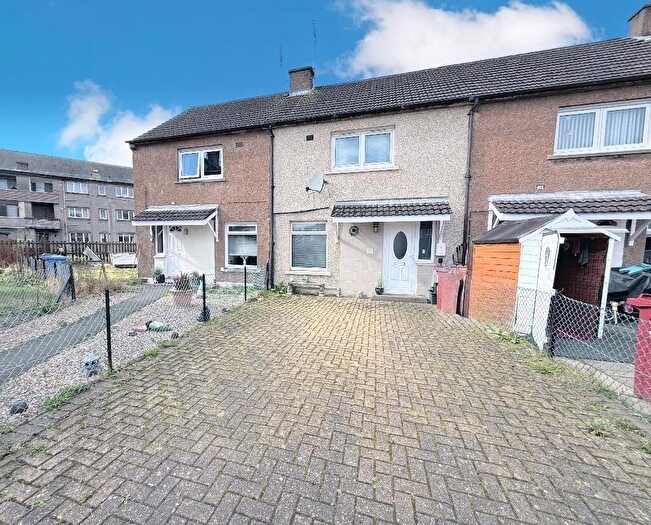
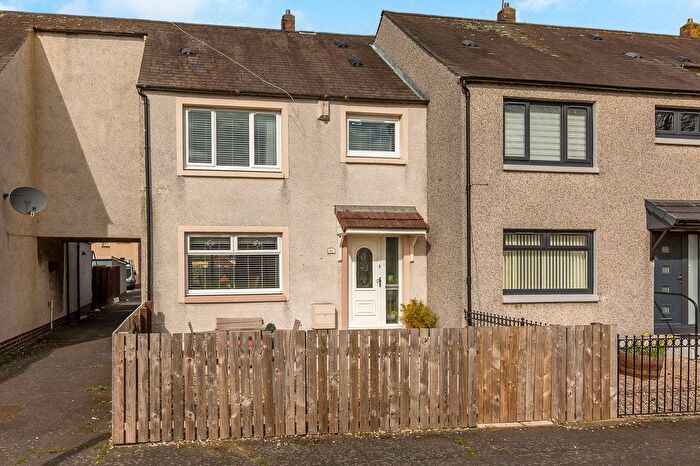
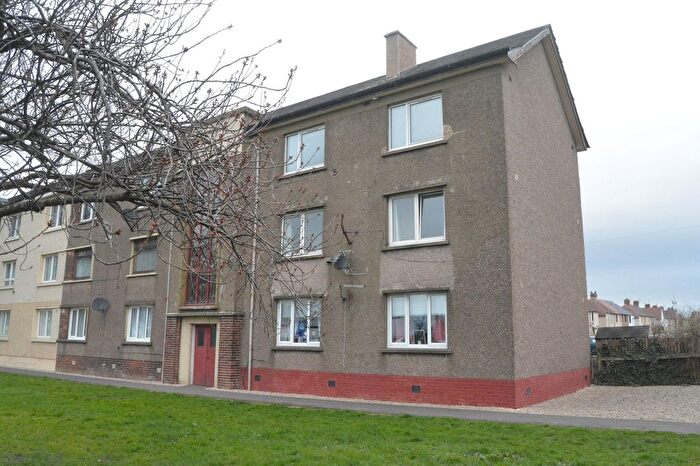
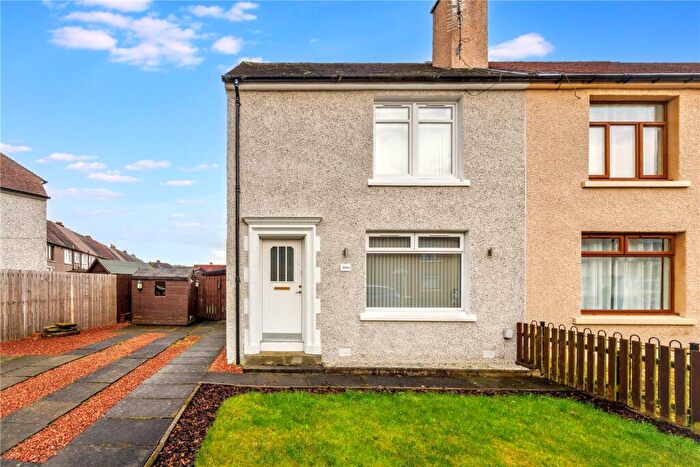
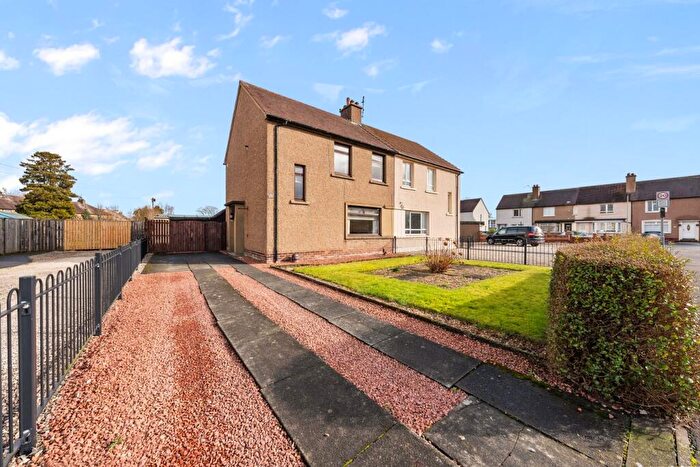
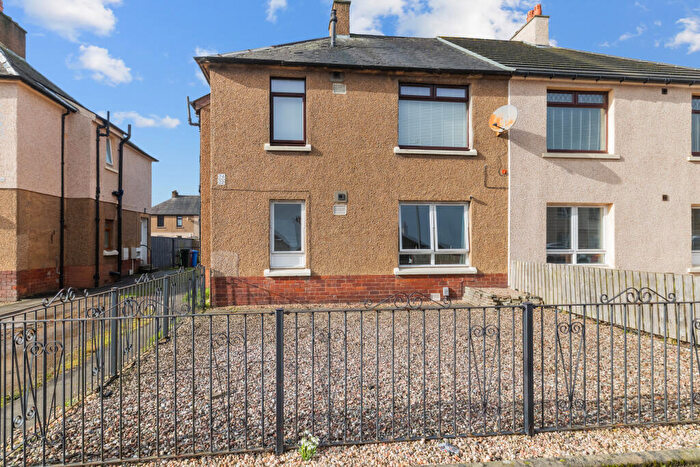
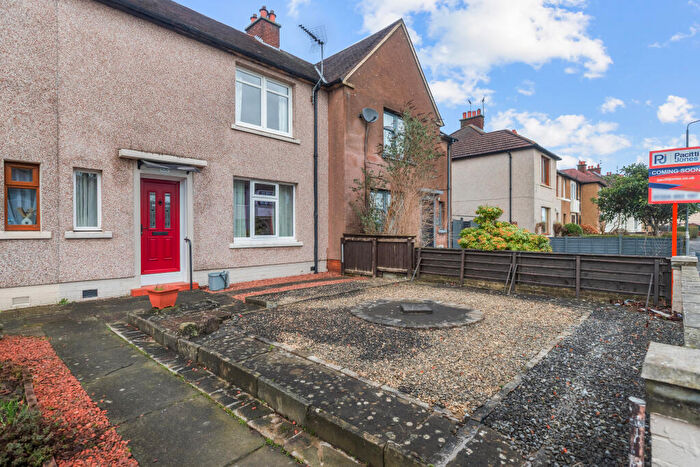
Properties for sale near FK3 8QR, Montgomery Street
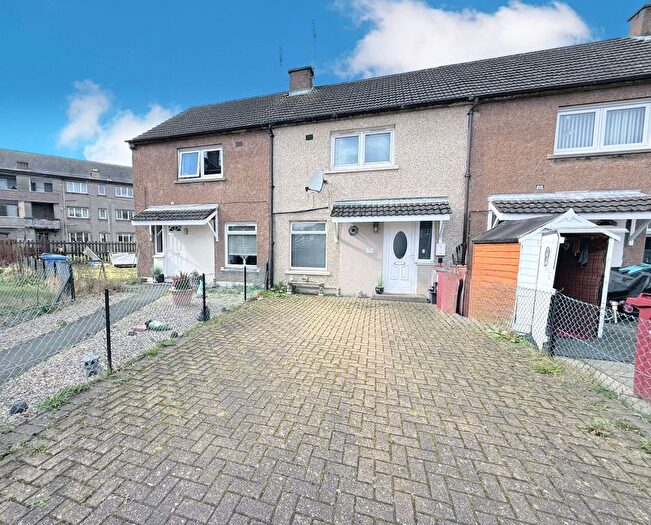
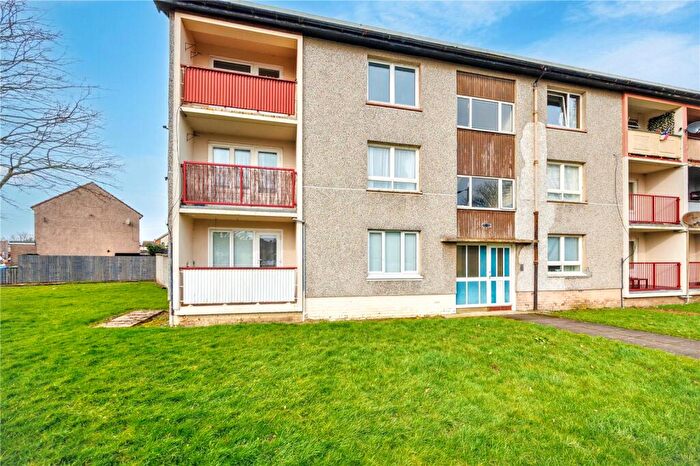
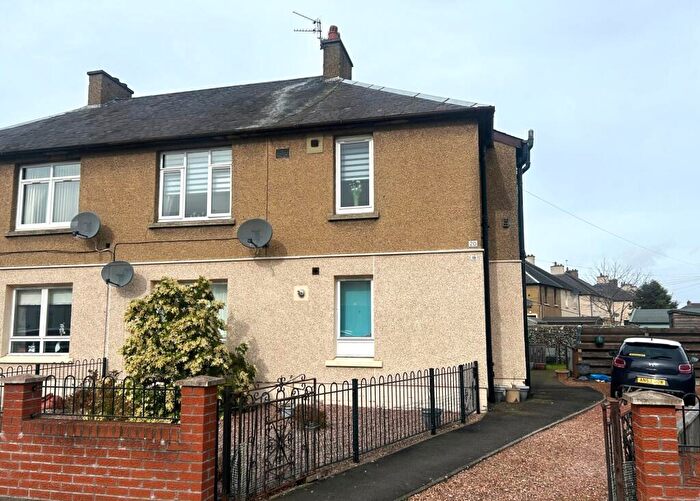
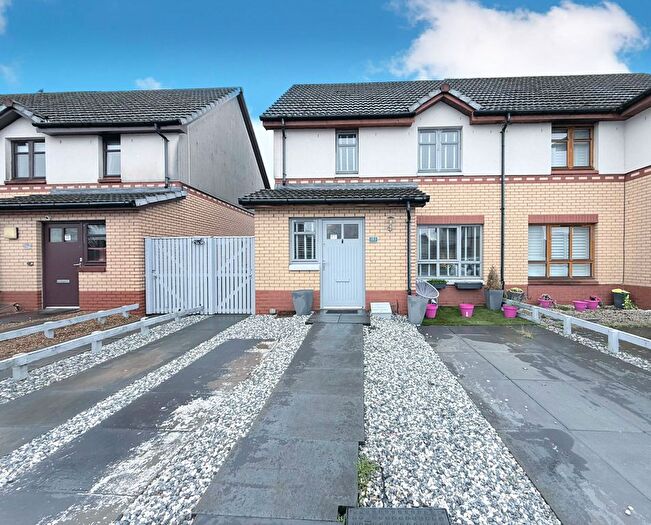
Previously listed properties near FK3 8QR, Montgomery Street
![]()
If you are looking to sell your house, let it out, or receive a property valuation, an expert can help you.
Click the button below to get started.

Price Paid in Montgomery Street, FK3 8QR, Grangemouth
52 Montgomery Street, FK3 8QR, Grangemouth Grangemouth
Property 52 has been sold 3 times. The last time it was sold was in 10/09/2025 and the sold price was £160,000.00.
This is a Property which was sold as a New Build in 10/09/2025
| Date | Price | Classification |
|---|---|---|
| 10/09/2025 | £160,000.00 | New Build |
| 23/12/2009 | £110,000.00 | Established Building |
| 21/01/2005 | £34,030.00 | Established Building |
56 Montgomery Street, FK3 8QR, Grangemouth Grangemouth
Property 56 has been sold 1 time. The last time it was sold was in 06/01/2021 and the sold price was £112,000.00.
This is a Property which was sold as an Established Building in 06/01/2021
| Date | Price | Classification |
|---|---|---|
| 06/01/2021 | £112,000.00 | Established Building |
60 Montgomery Street, FK3 8QR, Grangemouth Grangemouth
Property 60 has been sold 1 time. The last time it was sold was in 17/12/2020 and the sold price was £55,000.00.
This is a Property which was sold as an Established Building in 17/12/2020
| Date | Price | Classification |
|---|---|---|
| 17/12/2020 | £55,000.00 | Established Building |
59 Montgomery Street, FK3 8QR, Grangemouth Grangemouth
Property 59 has been sold 3 times. The last time it was sold was in 06/12/2018 and the sold price was £87,058.00.
This is a Property which was sold as an Established Building in 06/12/2018
| Date | Price | Classification |
|---|---|---|
| 06/12/2018 | £87,058.00 | Established Building |
| 05/02/2014 | £80,000.00 | Established Building |
| 30/07/2008 | £90,000.00 | Established Building |
62 Montgomery Street, FK3 8QR, Grangemouth Grangemouth
Property 62 has been sold 3 times. The last time it was sold was in 19/03/2018 and the sold price was £82,000.00.
This is a Property which was sold as an Established Building in 19/03/2018
| Date | Price | Classification |
|---|---|---|
| 19/03/2018 | £82,000.00 | Established Building |
| 14/12/2006 | £80,000.00 | Established Building |
| 18/12/2002 | £24,990.00 | Established Building |
58 Montgomery Street, FK3 8QR, Grangemouth Grangemouth
Property 58 has been sold 1 time. The last time it was sold was in 16/12/2015 and the sold price was £74,500.00.
This is a Property which was sold as an Established Building in 16/12/2015
| Date | Price | Classification |
|---|---|---|
| 16/12/2015 | £74,500.00 | Established Building |
54 Montgomery Street, FK3 8QR, Grangemouth Grangemouth
Property 54 has been sold 1 time. The last time it was sold was in 30/03/2009 and the sold price was £115,000.00.
This is a Property which was sold as an Established Building in 30/03/2009
| Date | Price | Classification |
|---|---|---|
| 30/03/2009 | £115,000.00 | Established Building |
61 Montgomery Street, FK3 8QR, Grangemouth Grangemouth
Property 61 has been sold 1 time. The last time it was sold was in 02/08/2002 and the sold price was £41,000.00.
This is a Property which was sold as an Established Building in 02/08/2002
| Date | Price | Classification |
|---|---|---|
| 02/08/2002 | £41,000.00 | Established Building |
Postcodes in Montgomery Street, Grangemouth
Navigate through other locations in Montgomery Street, Grangemouth, Grangemouth to see more property listings for sale or to rent.
Transport near FK3 8QR, Montgomery Street

House price paid reports for FK3 8QR, Montgomery Street
Click on the buttons below to see price paid reports by year or property price:
- Price Paid By Year
Property Price Paid in FK3 8QR, Montgomery Street by Year
The average sold property price by year was:
| Year | Average Sold Price | Price Change |
Sold Properties
|
|---|---|---|---|
| 2025 | £160,000 | 30% |
1 Property |
| 2021 | £112,000 | 51% |
1 Property |
| 2020 | £55,000 | -54% |
1 Property |
| 2018 | £84,529 | 12% |
2 Properties |
| 2015 | £74,500 | -7% |
1 Property |
| 2014 | £80,000 | -41% |
1 Property |
| 2009 | £112,500 | 20% |
2 Properties |
| 2008 | £90,000 | 11% |
1 Property |
| 2006 | £80,000 | 57% |
1 Property |
| 2005 | £34,030 | 3% |
1 Property |
| 2002 | £32,995 | - |
2 Properties |