
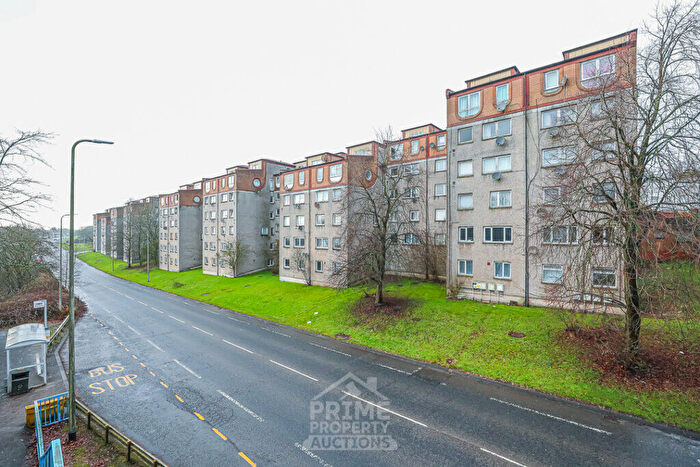
Houses for sale & to rent in Cumbernauld East, Glasgow
House Prices in Cumbernauld East
Properties in Cumbernauld East have an average house price of £102k and had 558 Property Transactions within the last 3 years¹.
Cumbernauld East is an area in Glasgow, North Lanarkshire with 7,638 households², where the most expensive property was sold for £567k.
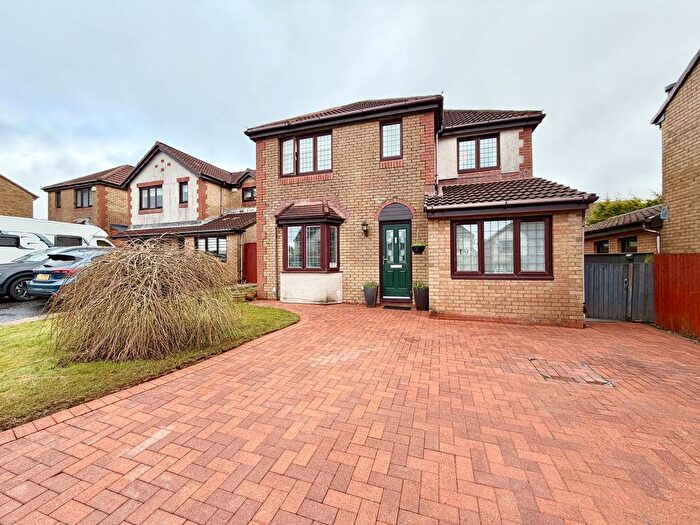
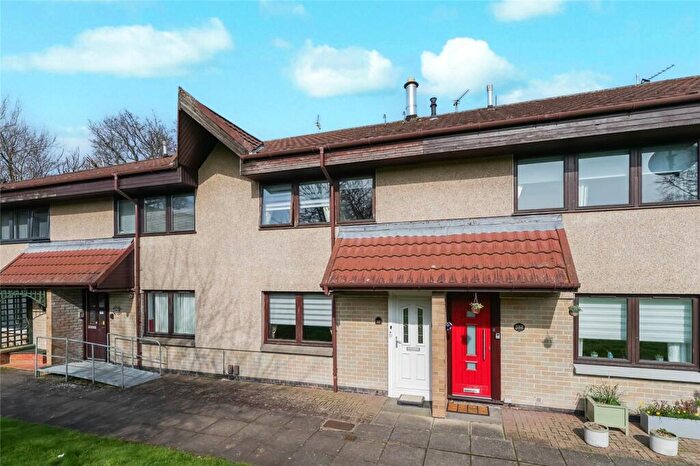
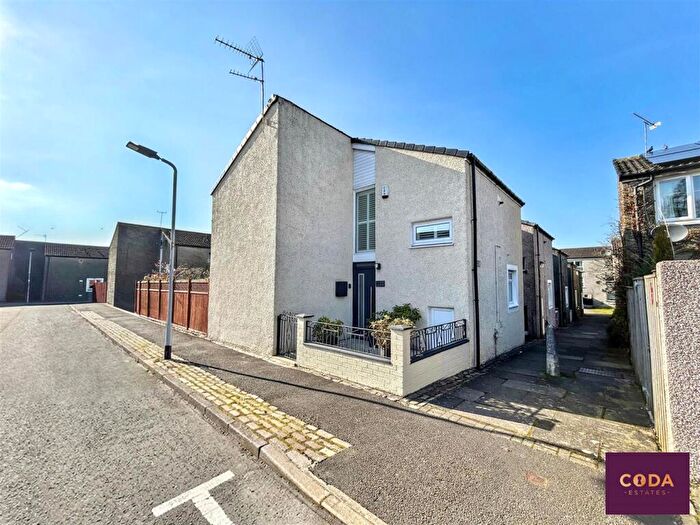
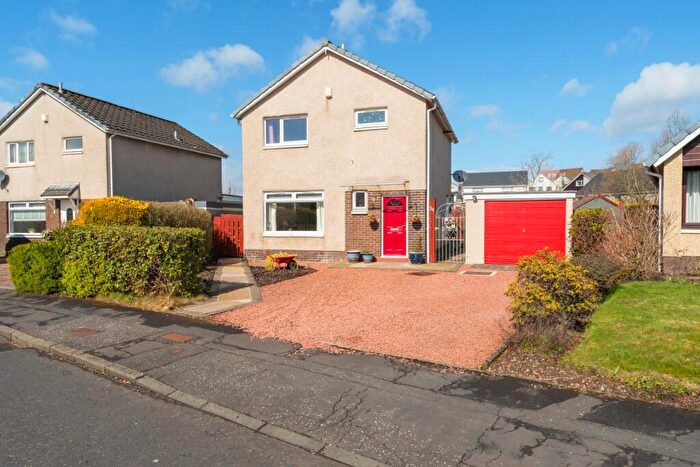
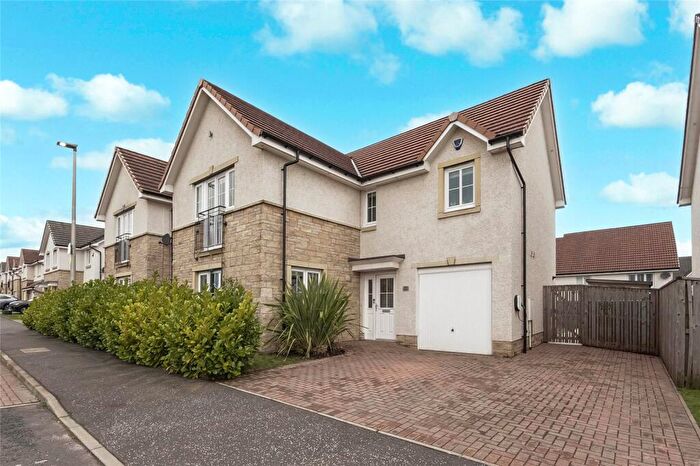
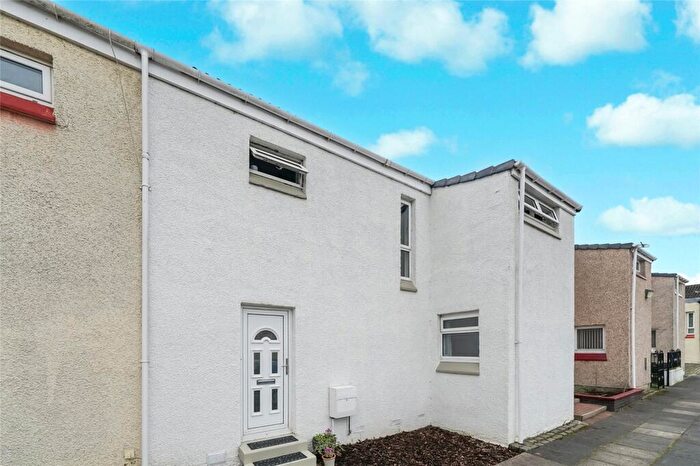
Properties for sale in Cumbernauld East
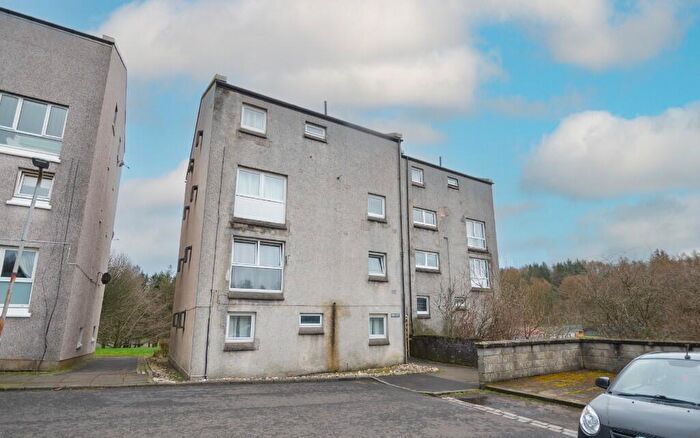
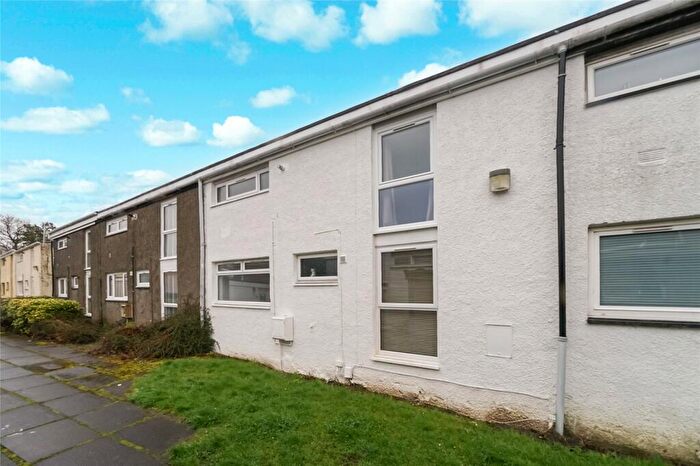

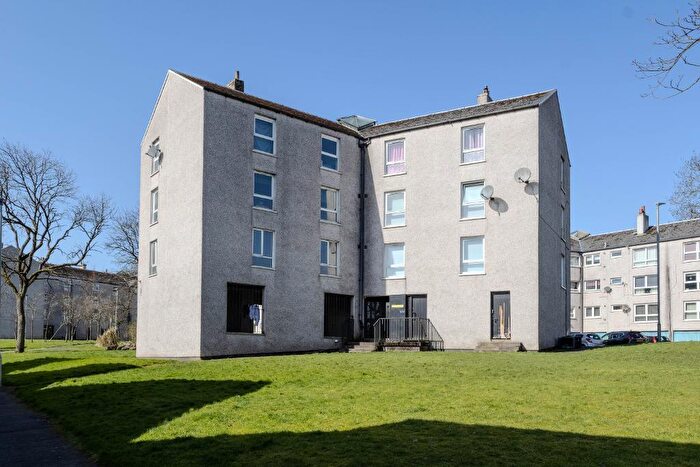
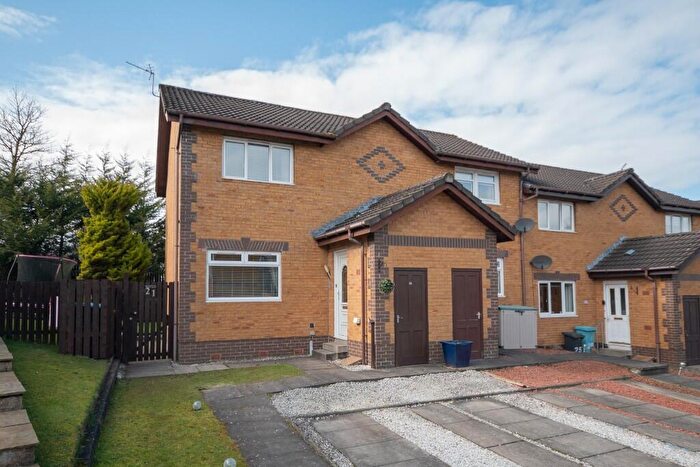
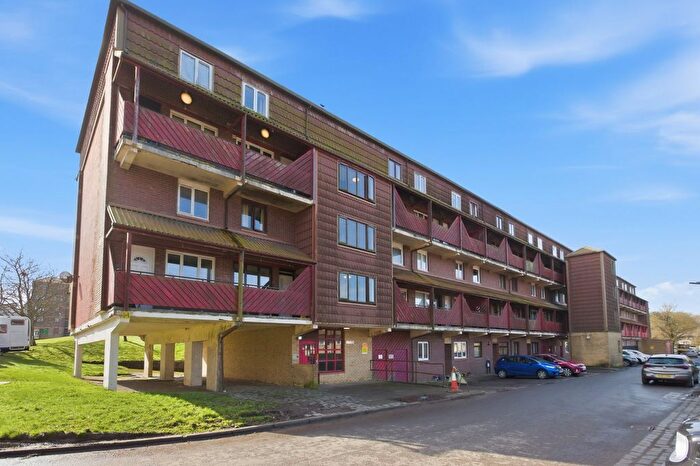
![]()
If you are looking to sell your house, let it out, or receive a property valuation, an expert can help you.
Click the button below to get started.


Roads and Postcodes in Cumbernauld East
Navigate through our locations to find the location of your next house in Cumbernauld East, Glasgow for sale or to rent.
Transport near Cumbernauld East

- FAQ
- Price Paid By Year
Frequently asked questions about Cumbernauld East
What is the average price for a property for sale in Cumbernauld East?
The average price for a property for sale in Cumbernauld East is £102,218. This amount is 39% lower than the average price in Glasgow. There are 1,721 property listings for sale in Cumbernauld East.
What streets have the most expensive properties for sale in Cumbernauld East?
The streets with the most expensive properties for sale in Cumbernauld East are Stirling Road at an average of £414,910, Glen View at an average of £280,000 and Forest View at an average of £265,000.
What streets have the most affordable properties for sale in Cumbernauld East?
The streets with the most affordable properties for sale in Cumbernauld East are Braehead Road at an average of £51,841, Mainhead Terrace at an average of £55,000 and Laburnum Road at an average of £57,333.
Which train stations are available in or near Cumbernauld East?
Some of the train stations available in or near Cumbernauld East are Cumbernauld, Greenfaulds and Croy.
Property Price Paid in Cumbernauld East by Year
The average sold property price by year was:
| Year | Average Sold Price | Price Change |
Sold Properties
|
|---|---|---|---|
| 2025 | £113,062 | 10% |
180 Properties |
| 2024 | £101,876 | 10% |
204 Properties |
| 2023 | £91,402 | -8% |
174 Properties |
| 2022 | £98,960 | 11% |
302 Properties |
| 2021 | £88,095 | -6% |
338 Properties |
| 2020 | £93,645 | 13% |
259 Properties |
| 2019 | £81,517 | -3% |
272 Properties |
| 2018 | £83,919 | 6% |
267 Properties |
| 2017 | £79,056 | 4% |
240 Properties |
| 2016 | £76,018 | -8% |
299 Properties |
| 2015 | £82,295 | 0,1% |
271 Properties |
| 2014 | £82,195 | 13% |
240 Properties |
| 2013 | £71,831 | -12% |
213 Properties |
| 2012 | £80,474 | 2% |
247 Properties |
| 2011 | £79,221 | 1% |
165 Properties |
| 2010 | £78,428 | 4% |
204 Properties |
| 2009 | £75,171 | -9% |
223 Properties |
| 2008 | £81,624 | - |
351 Properties |
| 2007 | £81,604 | 7% |
543 Properties |
| 2006 | £76,290 | 14% |
601 Properties |
| 2005 | £65,948 | 13% |
542 Properties |
| 2004 | £57,102 | 6% |
544 Properties |
| 2003 | £53,685 | -3% |
597 Properties |
| 2002 | £55,157 | 38% |
549 Properties |
| 2001 | £34,312 | - |
30 Properties |