
Houses for sale & to rent in Blairgowrie and Glens, Blairgowrie
House Prices in Blairgowrie and Glens
Properties in Blairgowrie and Glens have an average house price of £203k and had 300 Property Transactions within the last 3 years¹.
Blairgowrie and Glens is an area in Blairgowrie, Perth and Kinross with 4,891 households², where the most expensive property was sold for £670k.
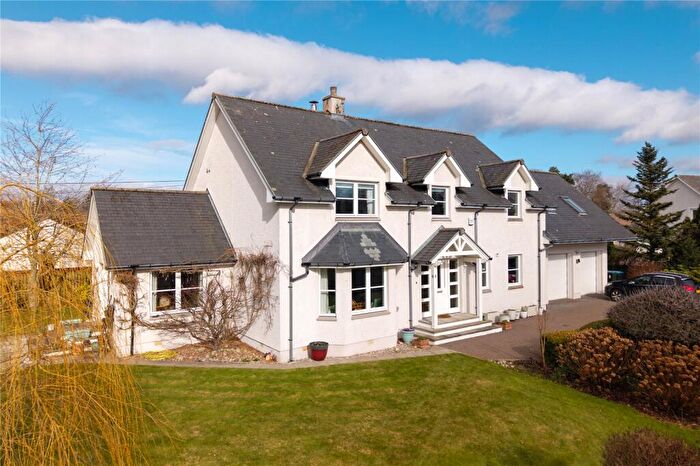
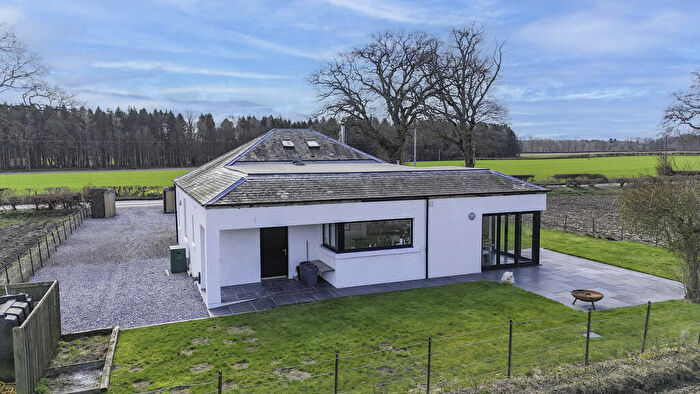
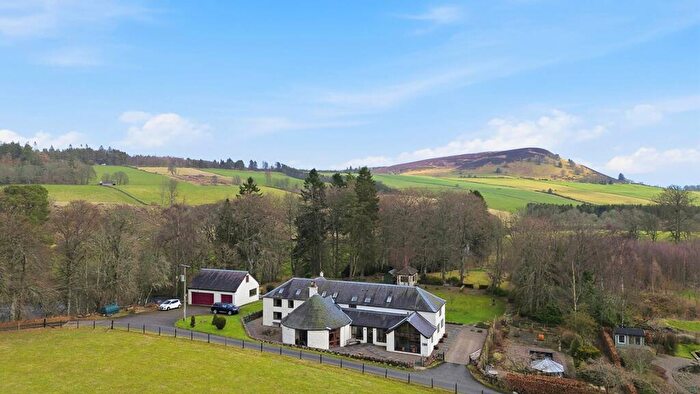
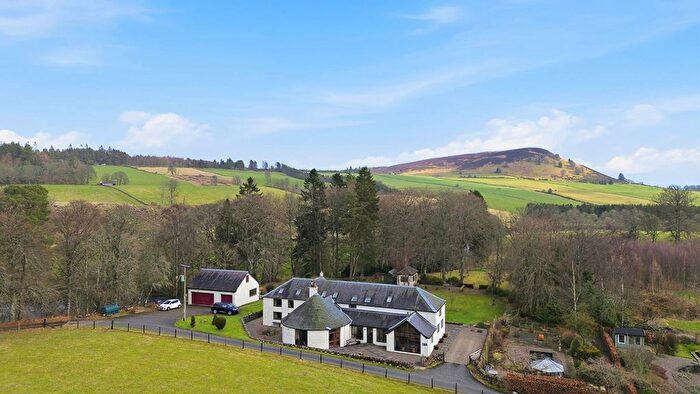
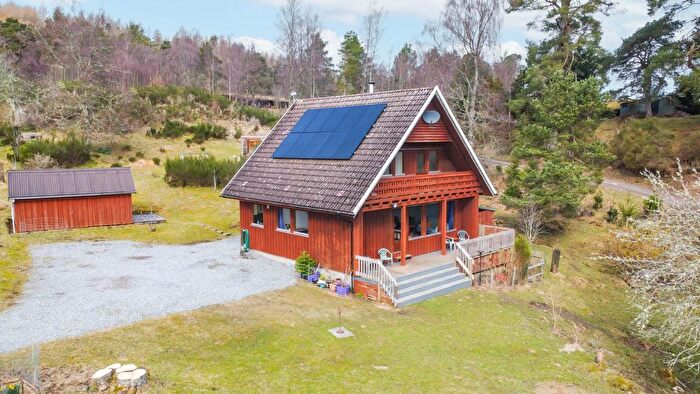
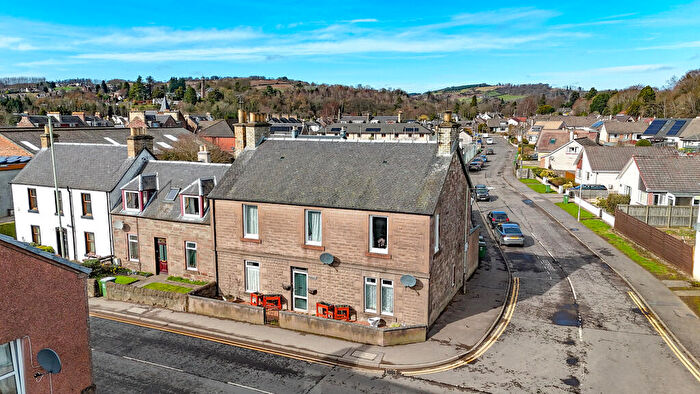
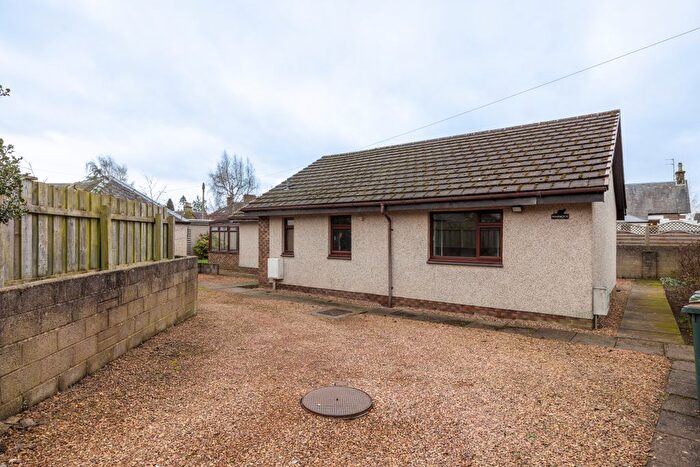
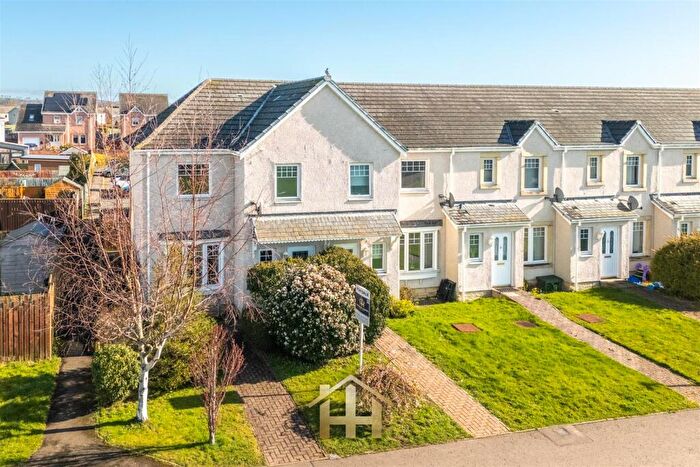
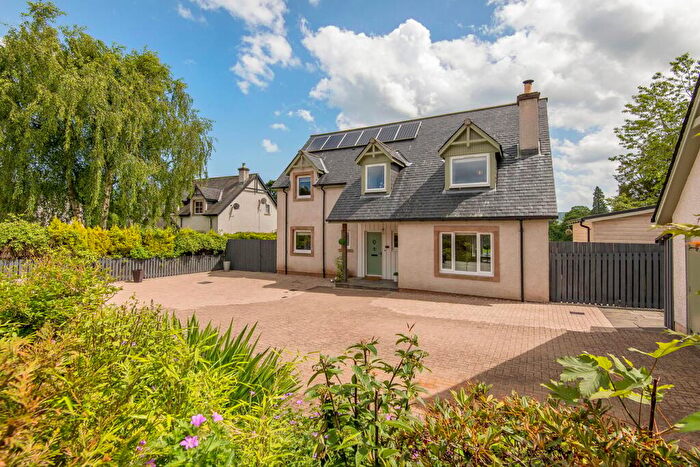
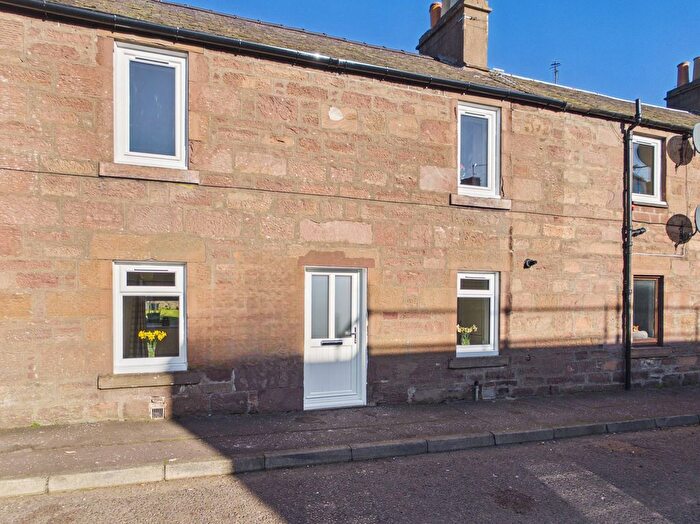
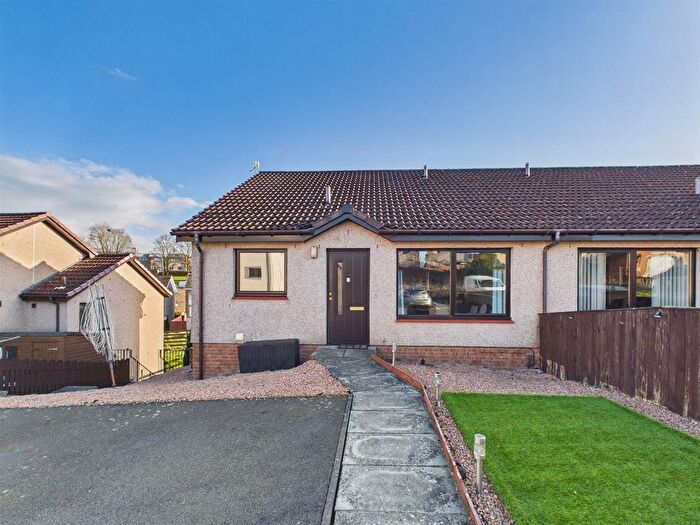
Properties for sale in Blairgowrie and Glens
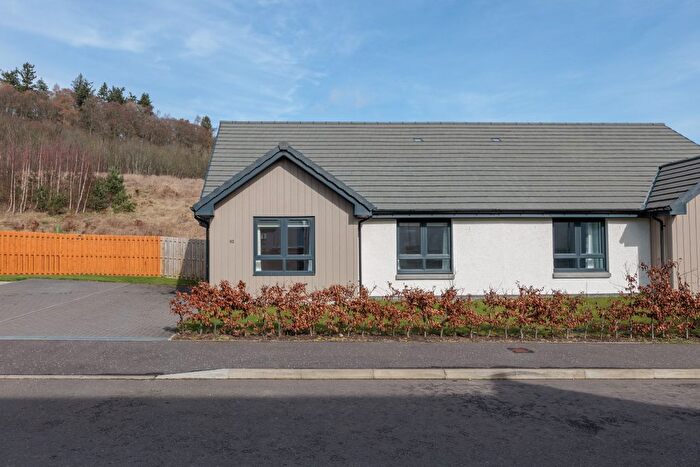
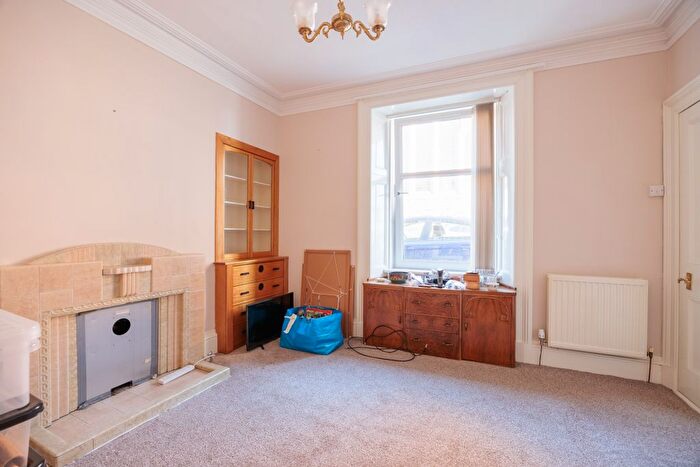
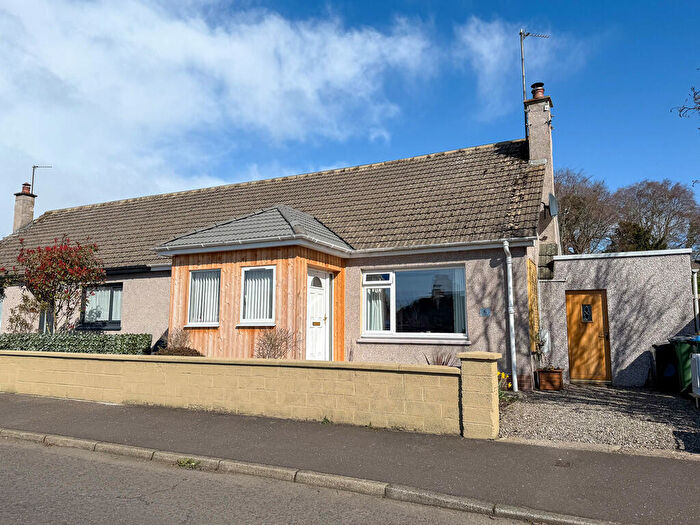

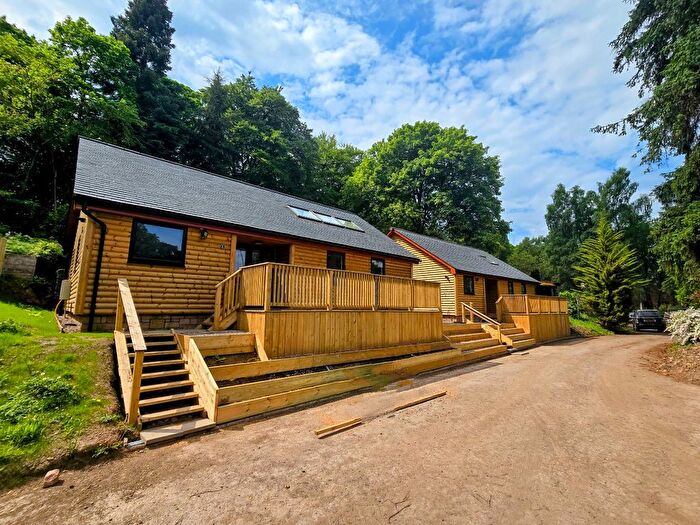
![]()
If you are looking to sell your house, let it out, or receive a property valuation, an expert can help you.
Click the button below to get started.

Roads and Postcodes in Blairgowrie and Glens
Navigate through our locations to find the location of your next house in Blairgowrie and Glens, Blairgowrie for sale or to rent.
Transport near Blairgowrie and Glens

- FAQ
- Price Paid By Year
Frequently asked questions about Blairgowrie and Glens
What is the average price for a property for sale in Blairgowrie and Glens?
The average price for a property for sale in Blairgowrie and Glens is £202,576. This amount is 3% higher than the average price in Blairgowrie. There are 6,878 property listings for sale in Blairgowrie and Glens.
What streets have the most expensive properties for sale in Blairgowrie and Glens?
The streets with the most expensive properties for sale in Blairgowrie and Glens are Woodlands Meadow at an average of £586,000, Brucefield Road at an average of £485,000 and Woodlands Grove at an average of £485,000.
What streets have the most affordable properties for sale in Blairgowrie and Glens?
The streets with the most affordable properties for sale in Blairgowrie and Glens are Leslie Street at an average of £65,000, Hatton Place at an average of £79,000 and Allan Street at an average of £79,500.
Which train stations are available in or near Blairgowrie and Glens?
Some of the train stations available in or near Blairgowrie and Glens are Dunkeld and Birnam, Perth and Invergowrie.
Property Price Paid in Blairgowrie and Glens by Year
The average sold property price by year was:
| Year | Average Sold Price | Price Change |
Sold Properties
|
|---|---|---|---|
| 2025 | £205,097 | 4% |
104 Properties |
| 2024 | £196,284 | -5% |
95 Properties |
| 2023 | £205,898 | -5% |
101 Properties |
| 2022 | £215,890 | 7% |
280 Properties |
| 2021 | £200,102 | -1% |
272 Properties |
| 2020 | £201,454 | 4% |
229 Properties |
| 2019 | £194,351 | 6% |
241 Properties |
| 2018 | £183,237 | 5% |
279 Properties |
| 2017 | £174,533 | 4% |
267 Properties |
| 2016 | £168,365 | -6% |
233 Properties |
| 2015 | £178,742 | 7% |
251 Properties |
| 2014 | £167,103 | -7% |
204 Properties |
| 2013 | £179,002 | 10% |
196 Properties |
| 2012 | £161,797 | 3% |
148 Properties |
| 2011 | £157,728 | -4% |
113 Properties |
| 2010 | £164,630 | 2% |
156 Properties |
| 2009 | £160,901 | 1% |
172 Properties |
| 2008 | £159,789 | -3% |
197 Properties |
| 2007 | £164,808 | 12% |
311 Properties |
| 2006 | £144,775 | 10% |
310 Properties |
| 2005 | £130,070 | 20% |
296 Properties |
| 2004 | £104,576 | 11% |
293 Properties |
| 2003 | £92,666 | 13% |
291 Properties |
| 2002 | £80,884 | -1% |
280 Properties |
| 2001 | £81,397 | - |
16 Properties |