
Houses for sale & to rent in Conwy - Conwy, Wales
House Prices in Conwy - Conwy
Properties in Conwy - Conwy have
an average house price of
£235k
and had 5,373 Property Transactions
within the last 3 years.¹
Conwy - Conwy is a location in
Wales with
51,177 households², where the most expensive property was sold for £2.14M.
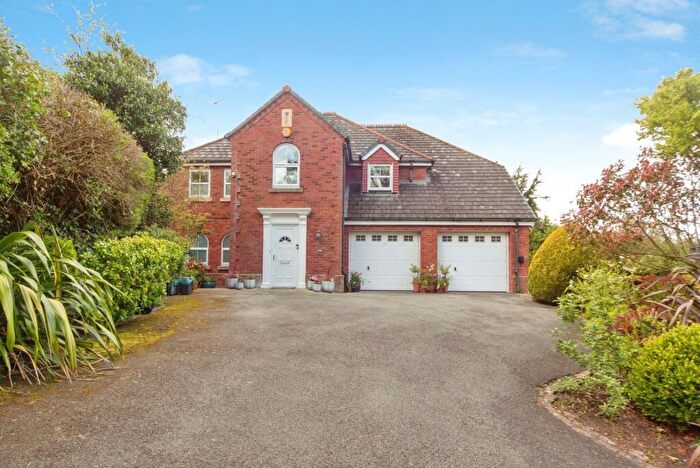
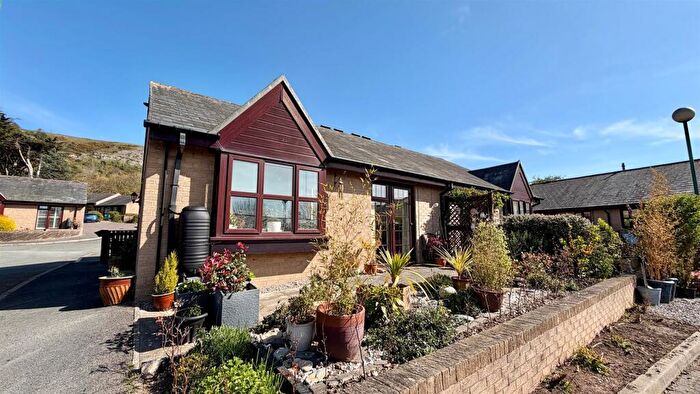
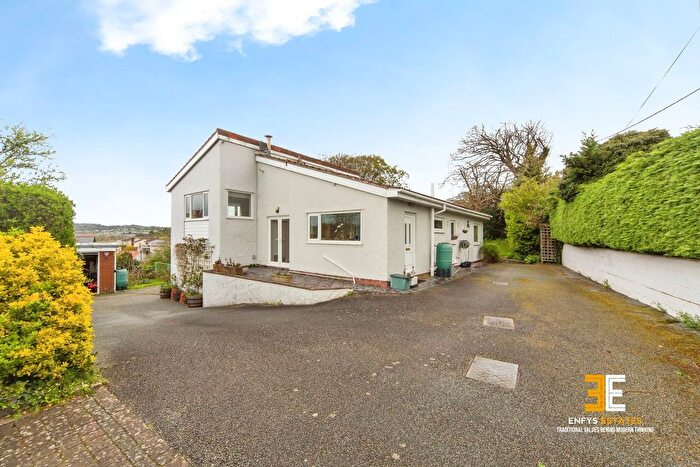
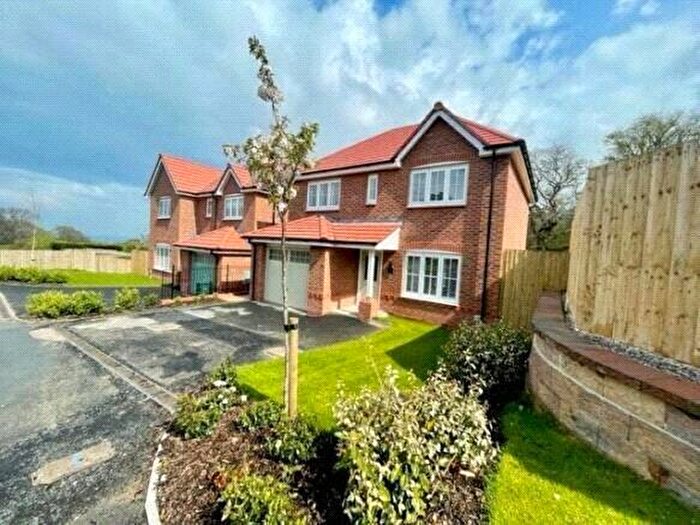
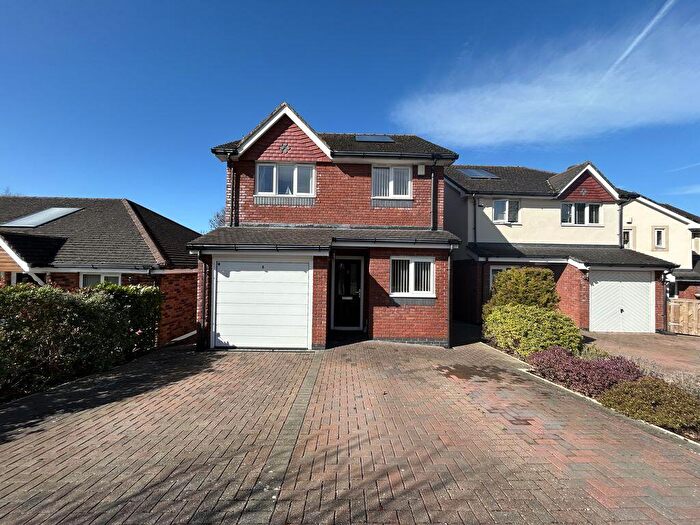
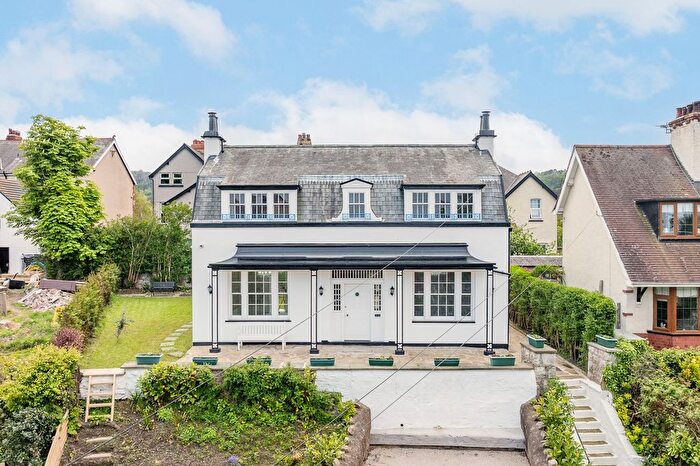
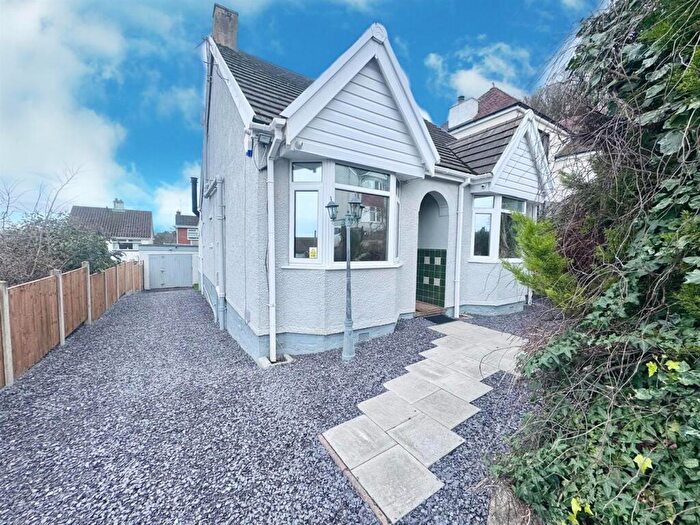
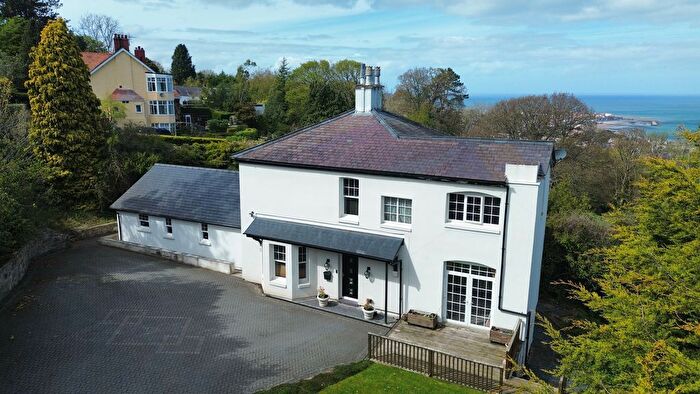
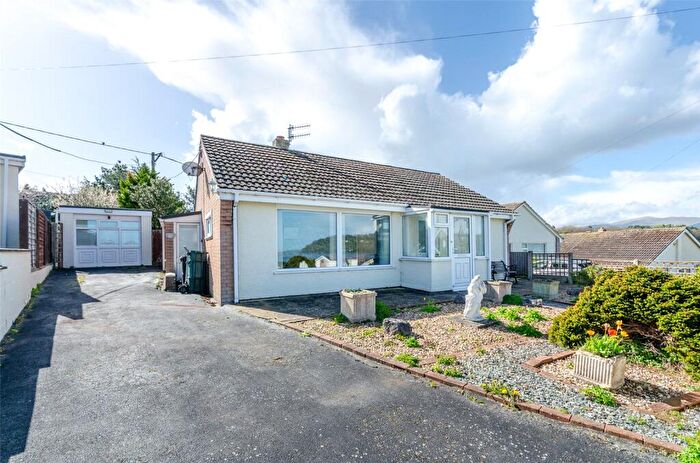
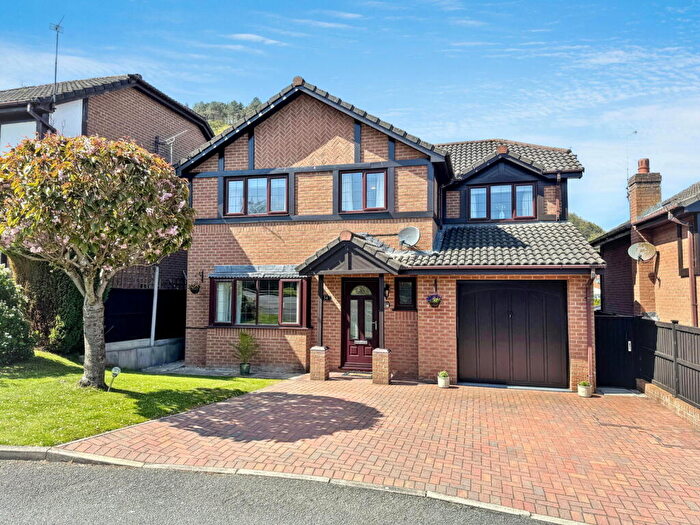
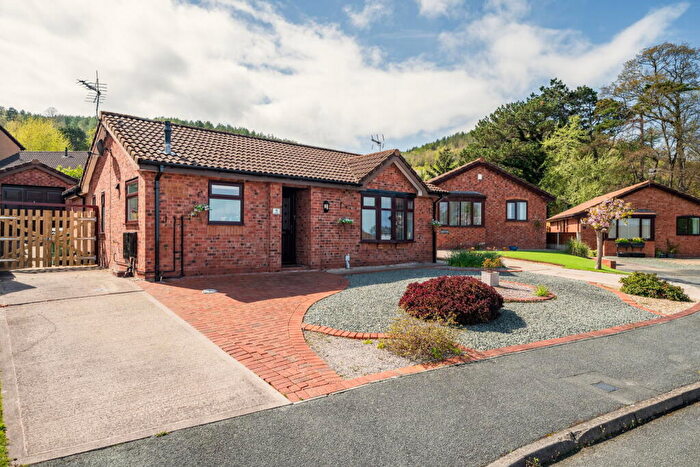
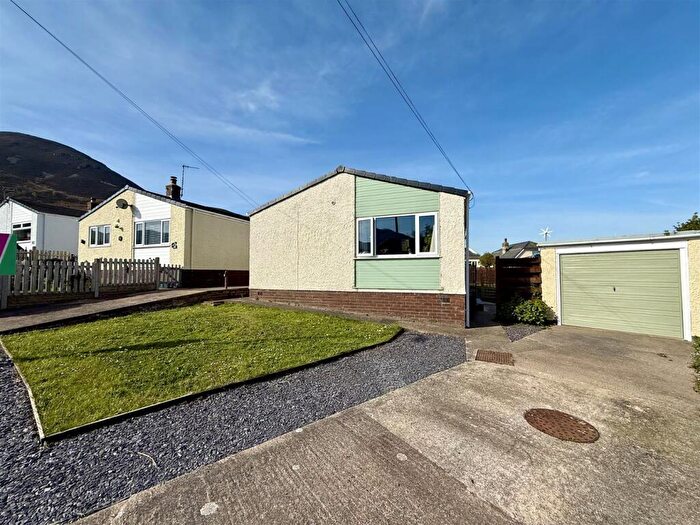
Properties for sale in Conwy - Conwy
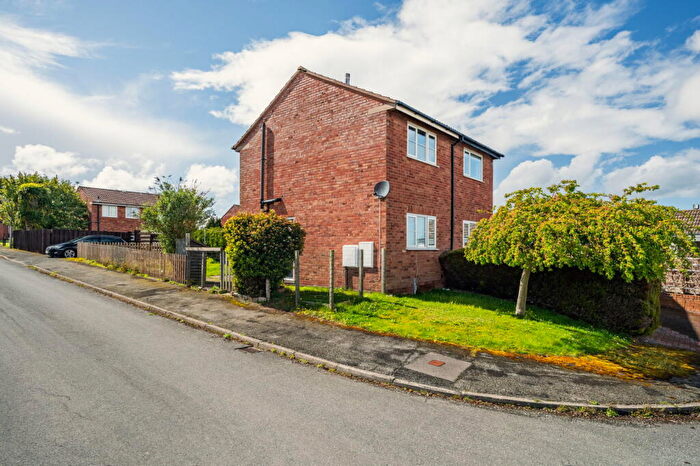


![]()
If you are looking to sell your house, let it out, or receive a property valuation, an expert can help you.
Click the button below to get started.

Towns in Conwy - Conwy
Navigate through our locations to find the location of your next house in Conwy - Conwy, Wales for sale or to rent.
Transport in Conwy - Conwy
Please see below transportation links in this area:
-
 Glan Conwy Station
 -
Colwyn Bay Station
-
Llandudno Junction Station
-
Tal-y-Cafn Station
-
Conwy Station
-
Deganwy Station
- FAQ
- Price Paid By Year
- Property Type Price
Frequently asked questions about Conwy - Conwy
What is the average price for a property for sale in Conwy - Conwy?
The average price for a property for sale in Conwy - Conwy is £234,965. This amount is 2% higher than the average price in Wales. There are more than 10,000 property listings for sale in Conwy - Conwy.
What locations have the most expensive properties for sale in Conwy - Conwy?
The locations with the most expensive properties for sale in Conwy - Conwy are Conwy at an average of £304,118, Denbigh at an average of £298,876 and Corwen at an average of £285,888.
What locations have the most affordable properties for sale in Conwy - Conwy?
The locations with the most affordable properties for sale in Conwy - Conwy are Rhyl at an average of £196,208, Penmaenmawr at an average of £213,003 and Dolwyddelan at an average of £217,919.
Which train stations are available in or near Conwy - Conwy?
Some of the train stations available in or near Conwy - Conwy are Glan Conwy, Colwyn Bay and Llandudno Junction.
Property Price Paid in Conwy - Conwy by Year
The average sold property price by year was:
| Year | Average Sold Price | Price Change |
Sold Properties
|
|---|---|---|---|
| 2026 | £231,850 | -2% |
37 Properties |
| 2025 | £236,598 | -0,3% |
1,717 Properties |
| 2024 | £237,353 | 3% |
1,908 Properties |
| 2023 | £230,731 | 1% |
1,711 Properties |
| 2022 | £228,791 | 1% |
2,164 Properties |
| 2021 | £227,318 | 9% |
2,589 Properties |
| 2020 | £207,849 | 9% |
1,763 Properties |
| 2019 | £188,255 | 5% |
2,178 Properties |
| 2018 | £178,338 | -0,3% |
2,350 Properties |
| 2017 | £178,893 | 4% |
2,508 Properties |
| 2016 | £171,109 | 5% |
2,181 Properties |
| 2015 | £163,256 | -1% |
1,985 Properties |
| 2014 | £164,411 | 2% |
2,076 Properties |
| 2013 | £160,405 | - |
1,695 Properties |
| 2012 | £160,400 | -2% |
1,389 Properties |
| 2011 | £164,358 | -2% |
1,398 Properties |
| 2010 | £167,260 | 5% |
1,342 Properties |
| 2009 | £159,104 | -3% |
1,342 Properties |
| 2008 | £163,179 | -6% |
1,412 Properties |
| 2007 | £172,199 | 3% |
2,640 Properties |
| 2006 | £167,066 | 4% |
2,563 Properties |
| 2005 | £159,889 | 10% |
2,067 Properties |
| 2004 | £144,678 | 20% |
2,822 Properties |
| 2003 | £116,201 | 22% |
2,916 Properties |
| 2002 | £90,369 | 17% |
3,244 Properties |
| 2001 | £74,653 | 10% |
2,754 Properties |
| 2000 | £67,357 | 7% |
2,387 Properties |
| 1999 | £62,928 | 6% |
2,300 Properties |
| 1998 | £59,121 | 4% |
2,006 Properties |
| 1997 | £56,727 | 10% |
2,374 Properties |
| 1996 | £51,316 | -1% |
2,093 Properties |
| 1995 | £51,775 | - |
1,569 Properties |
Property Price per Property Type in Conwy - Conwy
Here you can find historic sold price data in order to help with your property search.
The average Property Paid Price for specific property types in the last three years are:
| Property Type | Average Sold Price | Sold Properties |
|---|---|---|
| Semi Detached House | £213,619.00 | 1,664 Semi Detached Houses |
| Terraced House | £174,253.00 | 973 Terraced Houses |
| Detached House | £328,553.00 | 1,872 Detached Houses |
| Flat | £141,674.00 | 864 Flats |