
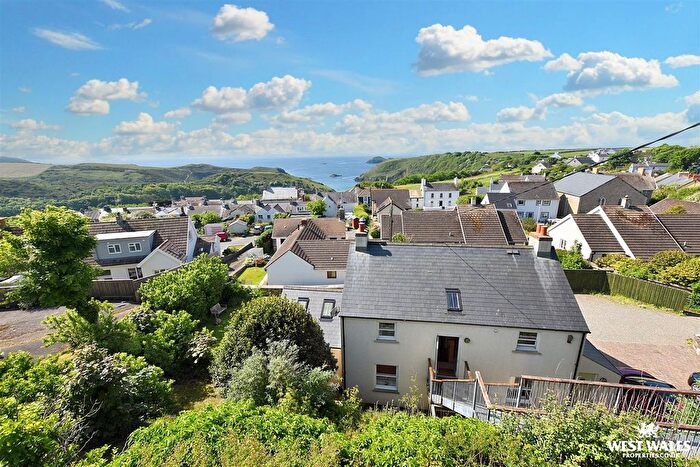
Houses for sale & to rent in Solva, Haverfordwest
House Prices in Solva
Properties in Solva have an average house price of £344k and had 46 Property Transactions within the last 3 years¹.
Solva is an area in Haverfordwest, Sir Benfro - Pembrokeshire with 648 households², where the most expensive property was sold for £795k.
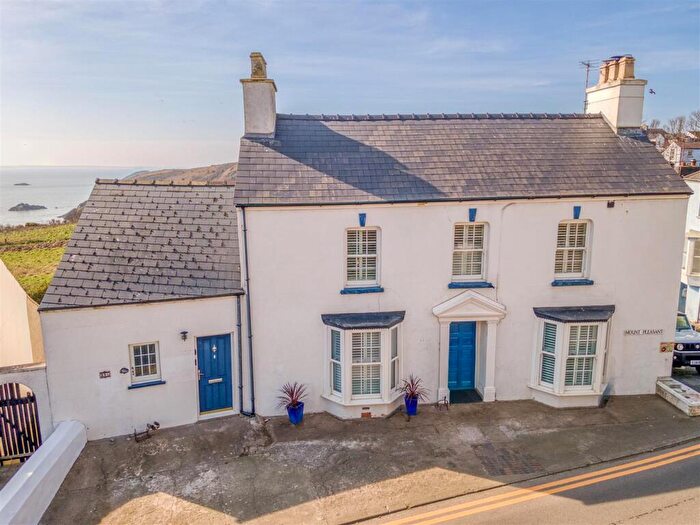
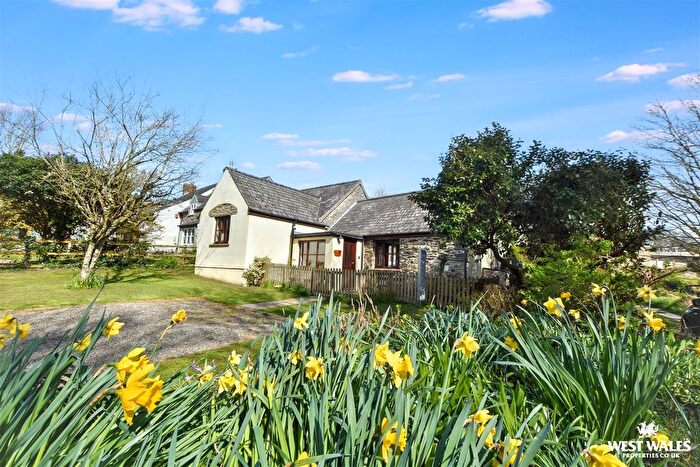
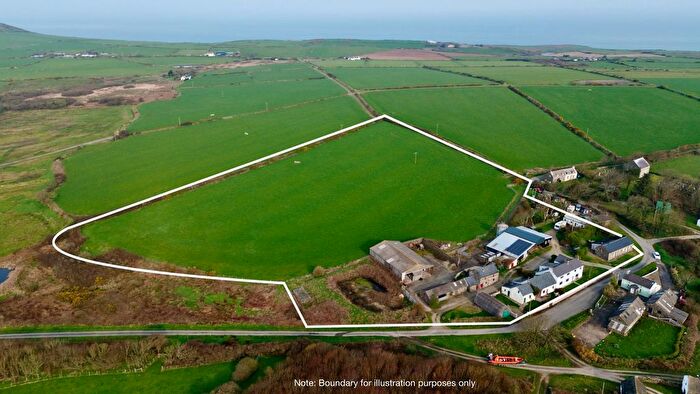
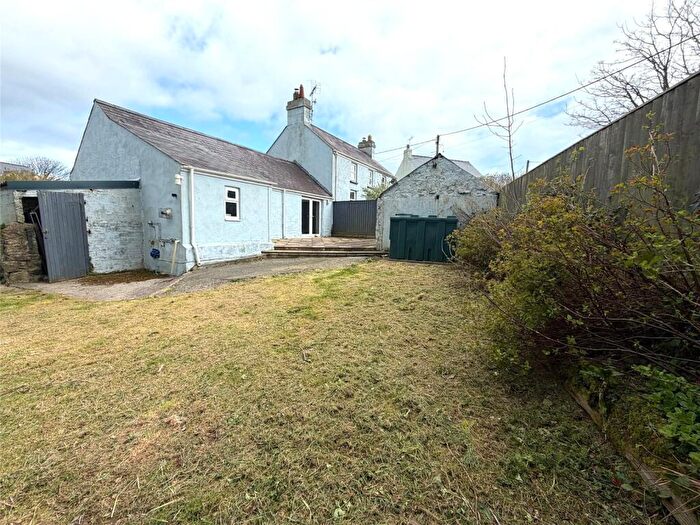
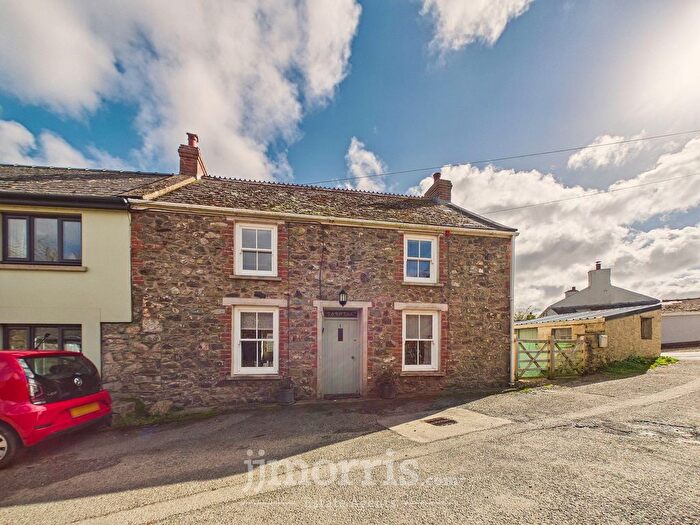
Properties for sale in Solva
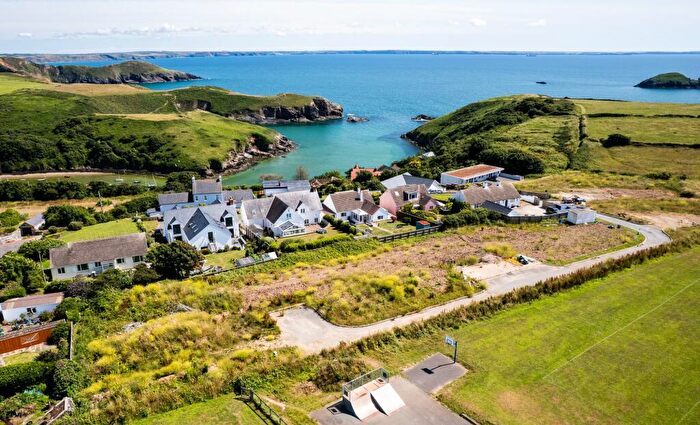


![]()
If you are looking to sell your house, let it out, or receive a property valuation, an expert can help you.
Click the button below to get started.


Roads and Postcodes in Solva
Navigate through our locations to find the location of your next house in Solva, Haverfordwest for sale or to rent.
Transport near Solva
-
 Haverfordwest Station
 -
Fishguard and Goodwick Station
-
Johnston (Dyfed) Station
-
Fishguard Harbour Station
-
Clarbeston Road Station
-
Milford Haven Station
- FAQ
- Price Paid By Year
- Property Type Price
Frequently asked questions about Solva
What is the average price for a property for sale in Solva?
The average price for a property for sale in Solva is £343,684. This amount is 38% higher than the average price in Haverfordwest. There are 513 property listings for sale in Solva.
What streets have the most expensive properties for sale in Solva?
The streets with the most expensive properties for sale in Solva are Pen Yr Aber at an average of £480,000, Main Street at an average of £450,000 and St Brides View at an average of £405,000.
What streets have the most affordable properties for sale in Solva?
The streets with the most affordable properties for sale in Solva are Brodawel at an average of £198,666, Bryn Seion at an average of £213,500 and Maes Ewan at an average of £218,500.
Which train stations are available in or near Solva?
Some of the train stations available in or near Solva are Haverfordwest, Fishguard and Goodwick and Johnston (Dyfed).
Property Price Paid in Solva by Year
The average sold property price by year was:
| Year | Average Sold Price | Price Change |
Sold Properties
|
|---|---|---|---|
| 2025 | £314,555 | -0,3% |
9 Properties |
| 2024 | £315,470 | -21% |
17 Properties |
| 2023 | £380,774 | 2% |
20 Properties |
| 2022 | £372,156 | -2% |
16 Properties |
| 2021 | £379,671 | 24% |
24 Properties |
| 2020 | £287,944 | 3% |
18 Properties |
| 2019 | £279,976 | -13% |
28 Properties |
| 2018 | £317,406 | 9% |
22 Properties |
| 2017 | £289,615 | 10% |
13 Properties |
| 2016 | £261,013 | 2% |
22 Properties |
| 2015 | £254,501 | 8% |
17 Properties |
| 2014 | £234,530 | -4% |
15 Properties |
| 2013 | £243,923 | 14% |
13 Properties |
| 2012 | £210,166 | -5% |
18 Properties |
| 2011 | £221,210 | -15% |
14 Properties |
| 2010 | £255,208 | 20% |
15 Properties |
| 2009 | £203,587 | -38% |
18 Properties |
| 2008 | £280,470 | -7% |
17 Properties |
| 2007 | £300,157 | 0,3% |
19 Properties |
| 2006 | £299,363 | 31% |
21 Properties |
| 2005 | £205,131 | 18% |
19 Properties |
| 2004 | £168,475 | 34% |
22 Properties |
| 2003 | £111,798 | -26% |
30 Properties |
| 2002 | £141,150 | 9% |
23 Properties |
| 2001 | £128,222 | 26% |
9 Properties |
| 2000 | £95,063 | 30% |
23 Properties |
| 1999 | £66,621 | -7% |
16 Properties |
| 1998 | £71,205 | 12% |
17 Properties |
| 1997 | £62,597 | 6% |
18 Properties |
| 1996 | £58,550 | 4% |
10 Properties |
| 1995 | £56,218 | - |
16 Properties |
Property Price per Property Type in Solva
Here you can find historic sold price data in order to help with your property search.
The average Property Paid Price for specific property types in the last three years are:
| Property Type | Average Sold Price | Sold Properties |
|---|---|---|
| Semi Detached House | £254,545.00 | 11 Semi Detached Houses |
| Detached House | £415,187.00 | 24 Detached Houses |
| Terraced House | £303,375.00 | 8 Terraced Houses |
| Flat | £206,000.00 | 3 Flats |