
Properties for sale in N
North London
- Info
- Price Paid By Year
- Property Type Price
House Prices in N
Properties in N have an average house price of £730,018 and had 24118 Property Transactions within the last 3 years.
The most expensive property was sold for £25,900,000.
Property Price Paid in N by Year
The average sold property price by year was:
| Year | Average Sold Price | Sold Properties |
|---|---|---|
| 2026 | £640,730.00 | 491 Properties |
| 2025 | £712,662.00 | 7,591 Properties |
| 2024 | £739,837.00 | 8,483 Properties |
| 2023 | £742,238.00 | 7,553 Properties |
| 2022 | £759,126.00 | 9,491 Properties |
| 2021 | £701,749.00 | 11,072 Properties |
| 2020 | £681,940.00 | 7,553 Properties |
| 2019 | £644,739.00 | 8,260 Properties |
| 2018 | £648,082.00 | 8,447 Properties |
| 2017 | £655,672.00 | 8,579 Properties |
| 2016 | £611,711.00 | 9,573 Properties |
| 2015 | £579,849.00 | 10,518 Properties |
| 2014 | £542,472.00 | 10,651 Properties |
| 2013 | £482,726.00 | 10,134 Properties |
| 2012 | £431,441.00 | 9,087 Properties |
| 2011 | £424,289.00 | 8,255 Properties |
| 2010 | £415,252.00 | 8,846 Properties |
| 2009 | £366,871.00 | 7,295 Properties |
| 2008 | £370,324.00 | 7,443 Properties |
| 2007 | £361,444.00 | 14,945 Properties |
| 2006 | £315,821.00 | 15,863 Properties |
| 2005 | £288,753.00 | 12,145 Properties |
| 2004 | £273,256.00 | 13,948 Properties |
| 2003 | £248,526.00 | 12,661 Properties |
| 2002 | £235,422.00 | 15,692 Properties |
| 2001 | £204,314.00 | 15,004 Properties |
| 2000 | £183,745.00 | 13,599 Properties |
| 1999 | £154,717.00 | 15,838 Properties |
| 1998 | £130,954.00 | 14,089 Properties |
| 1997 | £117,314.00 | 14,810 Properties |
| 1996 | £103,355.00 | 12,466 Properties |
| 1995 | £96,360.00 | 10,256 Properties |
Property Price per Property Type in N
Here you can find historic sold price data in order to help with your property search.
The average Property Paid Price for specific property types in the last three years are:
| Property Type | Average Sold Price | Sold Properties |
|---|---|---|
| Semi Detached House | £1,054,376.00 | 2,325 Semi Detached Houses |
| Terraced House | £911,472.00 | 6,872 Terraced Houses |
| Detached House | £2,123,431.00 | 619 Detached Houses |
| Flat | £529,794.00 | 14,302 Flats |
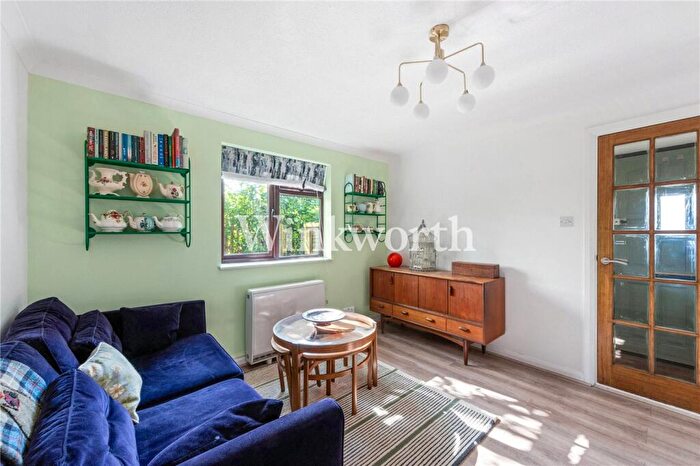
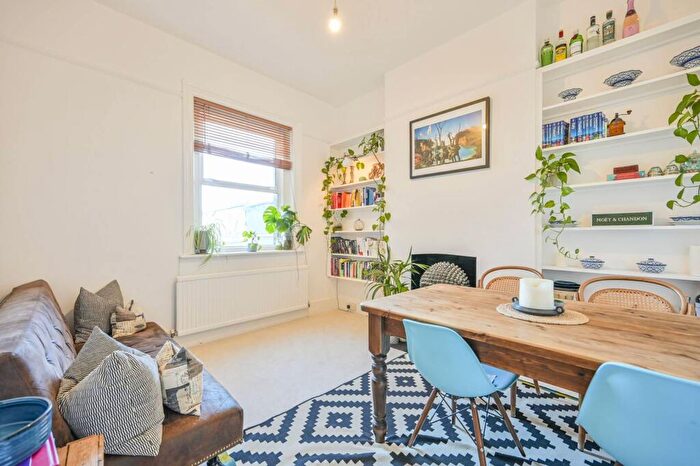
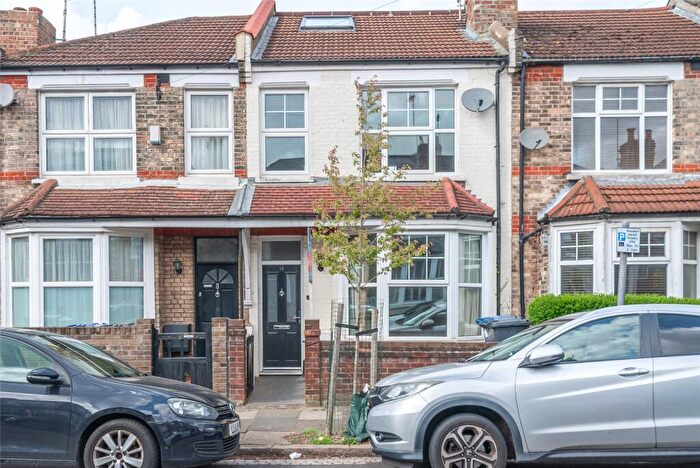
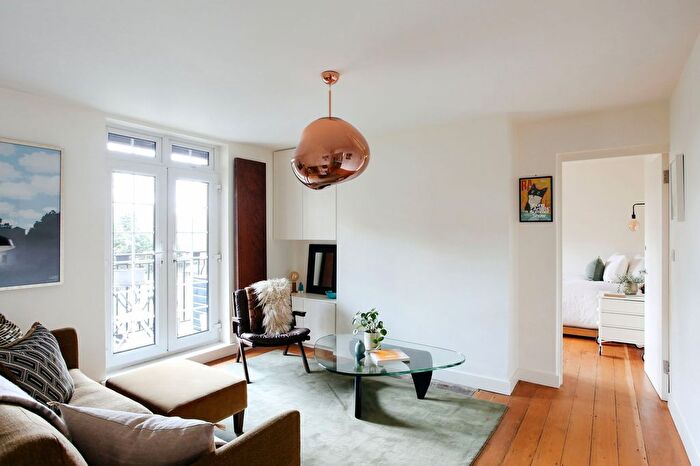
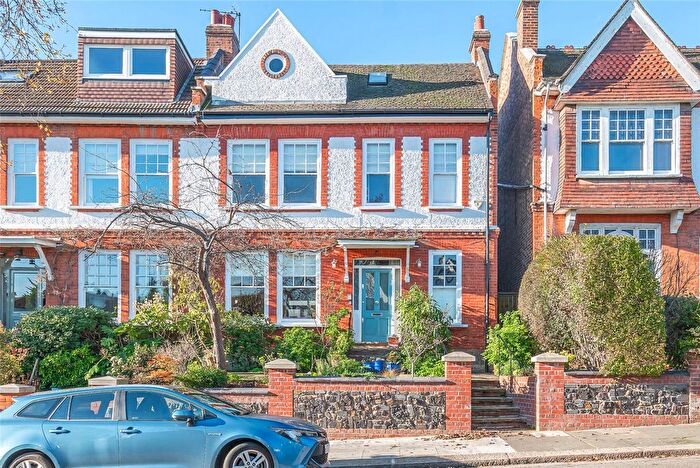
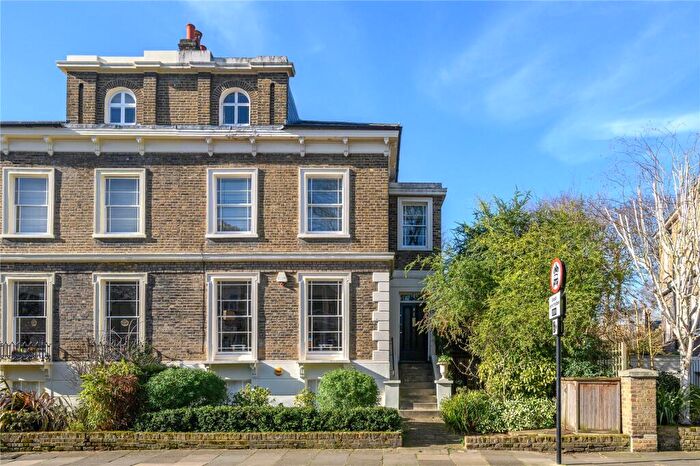
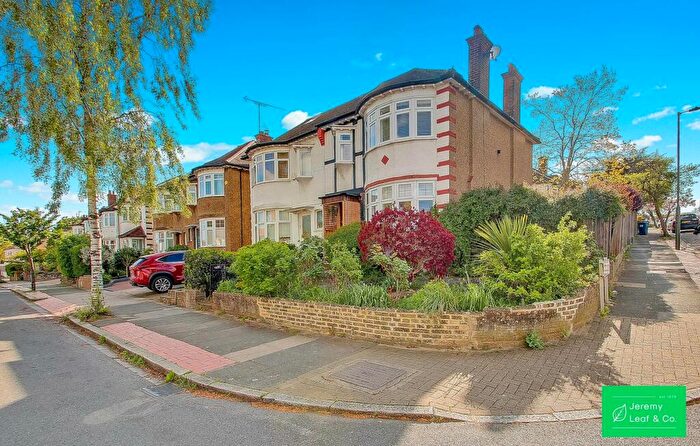
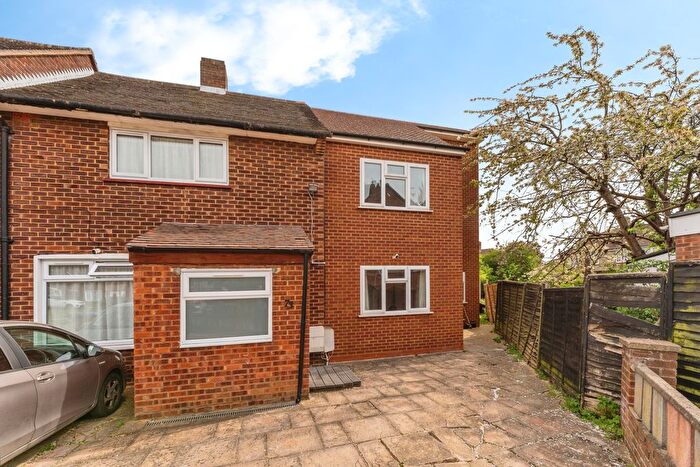
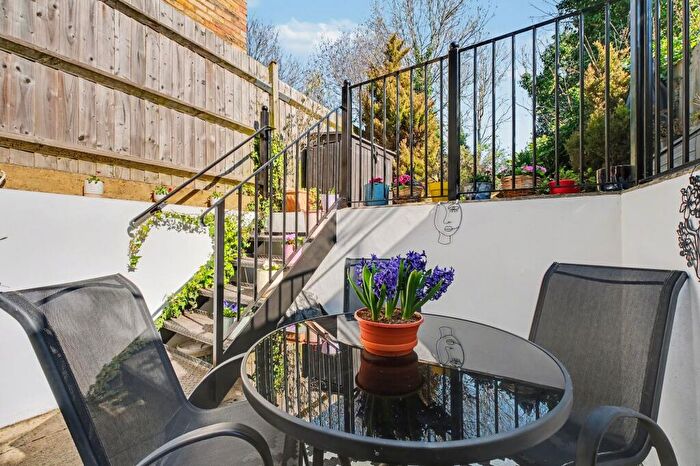
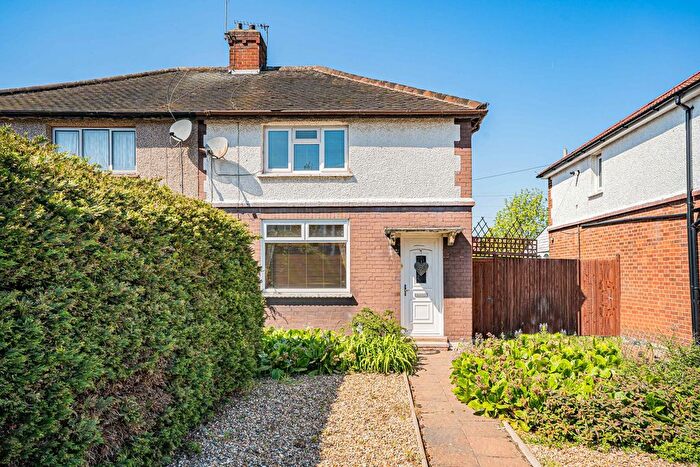
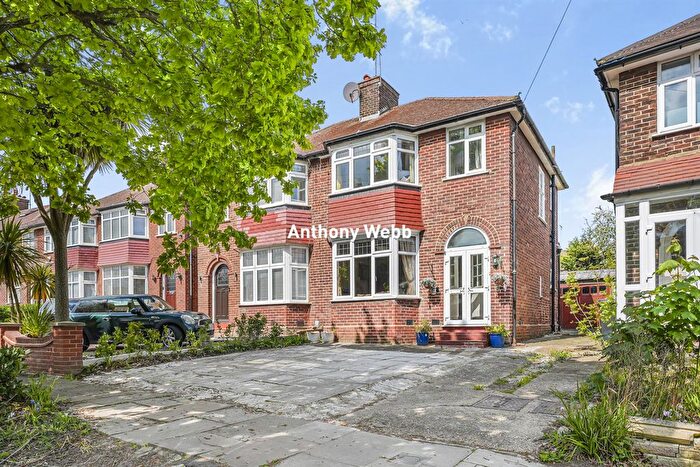
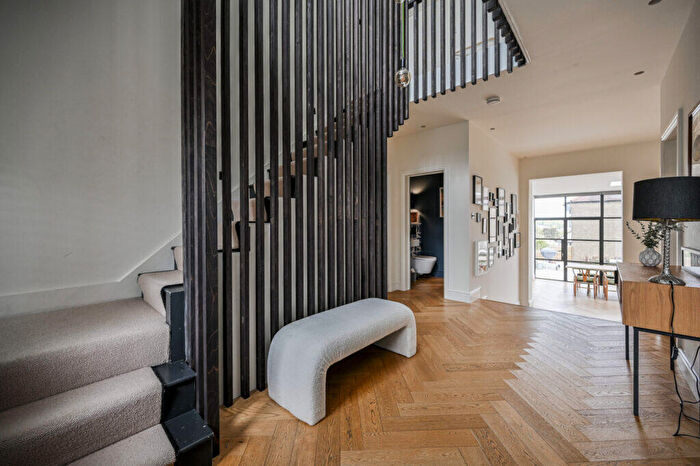
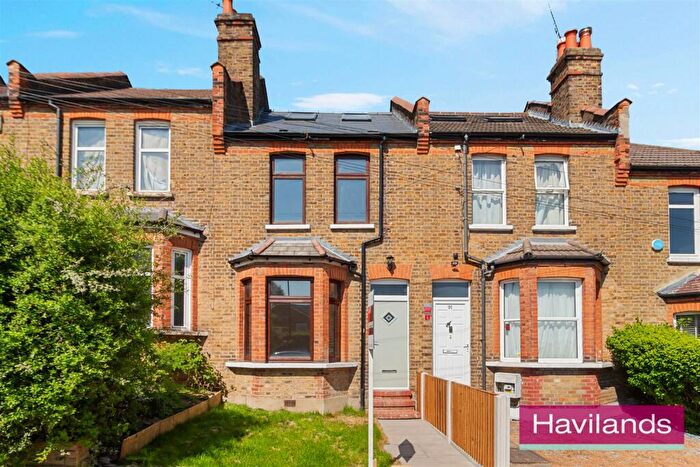
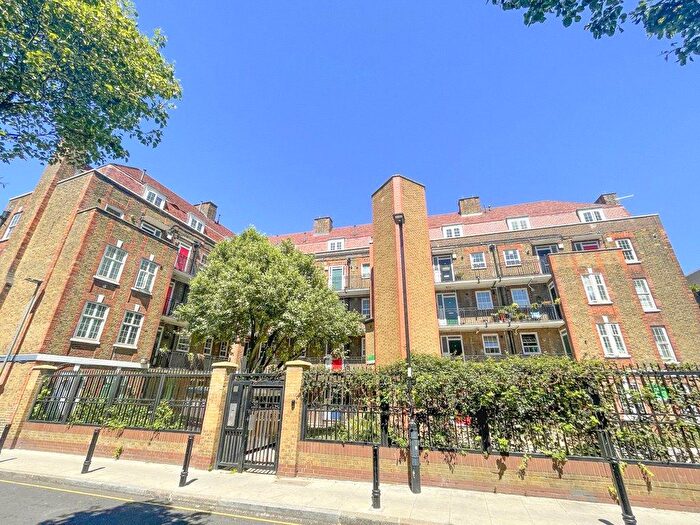
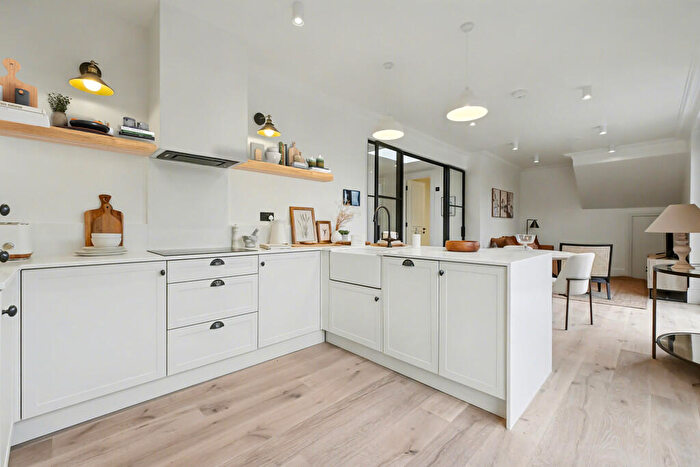
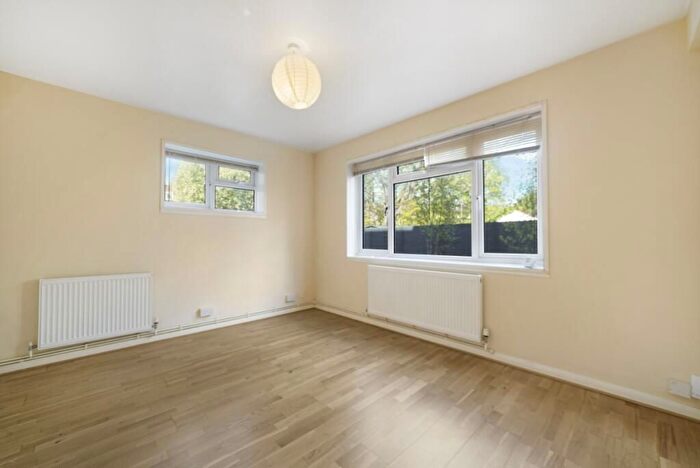
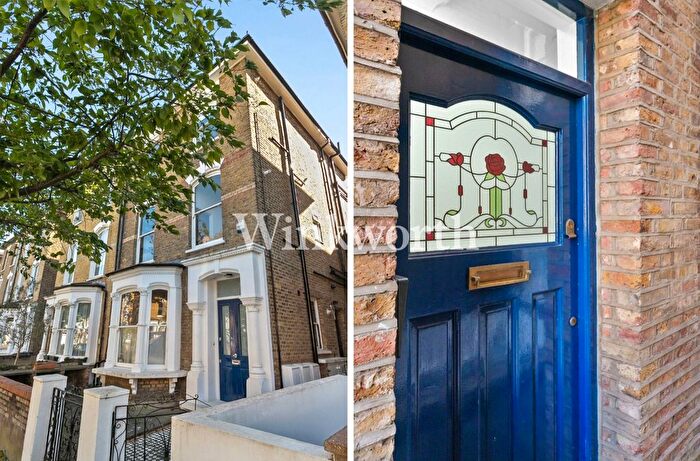
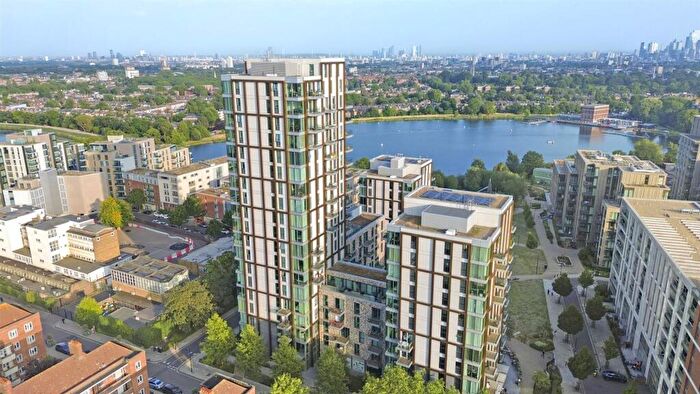
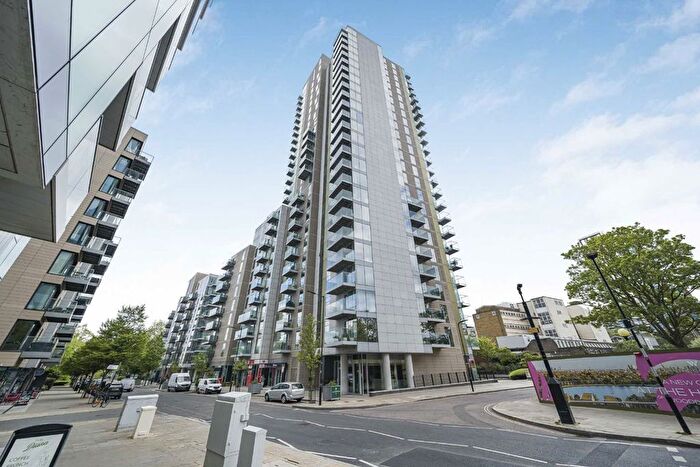
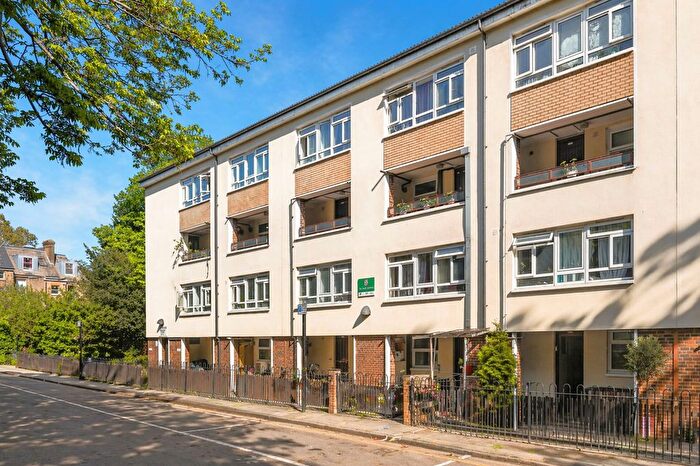
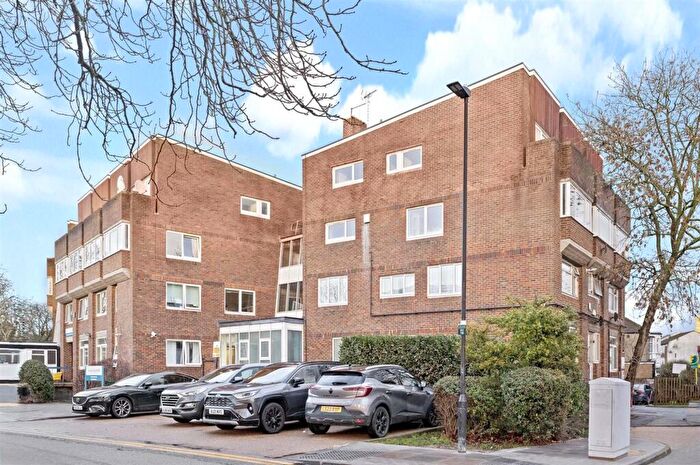
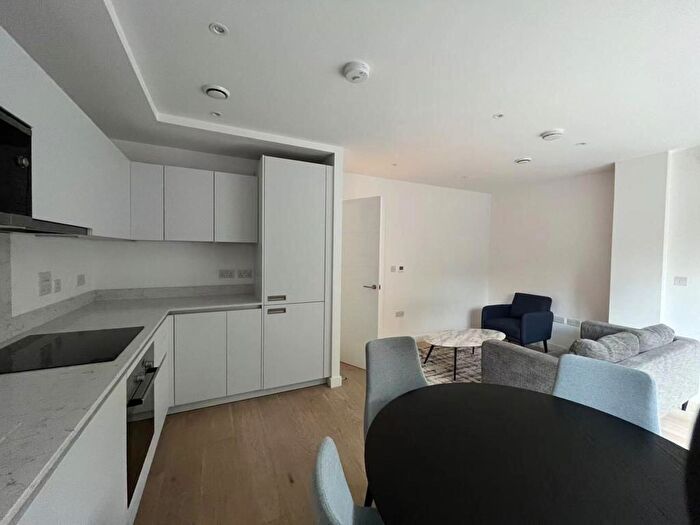
Houses and Flats for sale in N, North London

![]()
If you are looking to sell your house, let it out, or receive a property valuation, an expert can help you.
Click the button below to get started.
Postcode districts in N, North London
Navigate through our locations to find the location of your next house in N, North London, England for sale or to rent.
Transport in N, North London
Please see below transportation links in this area:
-
 Hornsey Station
 -
 Turnpike Lane Station
 -
Harringay Station
-
 Harringay Green Lanes Station
 -
Wood Green Station
-
Crouch Hill Station
-
Alexandra Palace Station
-
Manor House Station
-
Finsbury Park Station
-
Highgate Station
Frequently asked questions about N
What is the average price for a property for sale in N?
The average price for a property for sale in N is £730,018. This amount is 103% higher than the average price in England. There are 3,922 property listings for sale in N.
What locations have the most expensive properties for sale in N?
The locations with the most expensive properties for sale in N are N2 at an average of £1,343,062, N1C at an average of £1,335,274 and N6 at an average of £1,281,018.
What locations have the most affordable properties for sale in N?
The locations with the most affordable properties for sale in N are N9 at an average of £374,452, N18 at an average of £378,910 and N17 at an average of £451,746.
Which train stations are available in or near N?
Some of the train stations available in or near N are Hornsey, Harringay and Harringay Green Lanes.
Which tube stations are available in or near N?
Some of the tube stations available in or near N are Turnpike Lane, Wood Green and Manor House.