
Properties for sale in SE
South East London
- Info
- Price Paid By Year
- Property Type Price
House Prices in SE
Properties in SE have an average house price of £553,113 and had 33036 Property Transactions within the last 3 years.
The most expensive property was sold for £11,193,728.
Property Price Paid in SE by Year
The average sold property price by year was:
| Year | Average Sold Price | Sold Properties |
|---|---|---|
| 2026 | £542,936.00 | 713 Properties |
| 2025 | £555,325.00 | 10,469 Properties |
| 2024 | £559,288.00 | 11,707 Properties |
| 2023 | £544,423.00 | 10,147 Properties |
| 2022 | £562,709.00 | 13,121 Properties |
| 2021 | £549,823.00 | 15,265 Properties |
| 2020 | £570,041.00 | 11,391 Properties |
| 2019 | £549,569.00 | 13,142 Properties |
| 2018 | £542,484.00 | 14,151 Properties |
| 2017 | £520,342.00 | 14,591 Properties |
| 2016 | £493,738.00 | 15,420 Properties |
| 2015 | £446,130.00 | 17,121 Properties |
| 2014 | £397,361.00 | 16,947 Properties |
| 2013 | £354,834.00 | 14,865 Properties |
| 2012 | £328,106.00 | 11,652 Properties |
| 2011 | £321,417.00 | 10,610 Properties |
| 2010 | £315,582.00 | 10,197 Properties |
| 2009 | £280,431.00 | 7,790 Properties |
| 2008 | £278,723.00 | 9,465 Properties |
| 2007 | £276,218.00 | 20,792 Properties |
| 2006 | £246,936.00 | 20,985 Properties |
| 2005 | £229,961.00 | 17,385 Properties |
| 2004 | £217,526.00 | 20,210 Properties |
| 2003 | £202,221.00 | 18,699 Properties |
| 2002 | £183,678.00 | 21,389 Properties |
| 2001 | £162,345.00 | 20,193 Properties |
| 2000 | £140,980.00 | 18,709 Properties |
| 1999 | £114,971.00 | 19,472 Properties |
| 1998 | £99,216.00 | 16,795 Properties |
| 1997 | £85,541.00 | 16,983 Properties |
| 1996 | £75,663.00 | 13,560 Properties |
| 1995 | £69,931.00 | 10,777 Properties |
Property Price per Property Type in SE
Here you can find historic sold price data in order to help with your property search.
The average Property Paid Price for specific property types in the last three years are:
| Property Type | Average Sold Price | Sold Properties |
|---|---|---|
| Semi Detached House | £837,044.00 | 2,956 Semi Detached Houses |
| Terraced House | £681,533.00 | 9,610 Terraced Houses |
| Detached House | £1,172,545.00 | 618 Detached Houses |
| Flat | £429,387.00 | 19,852 Flats |
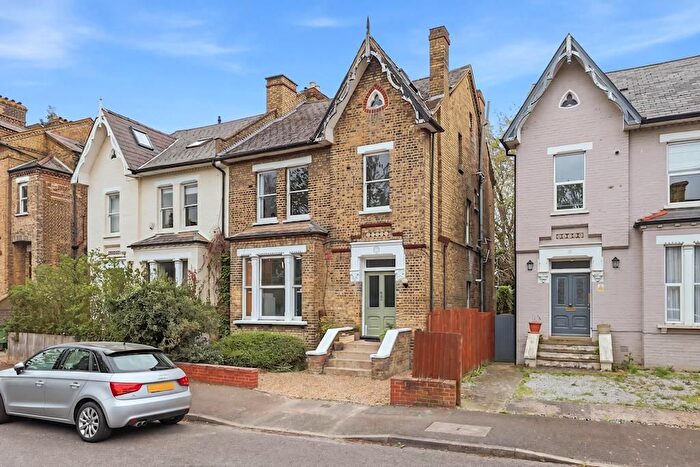
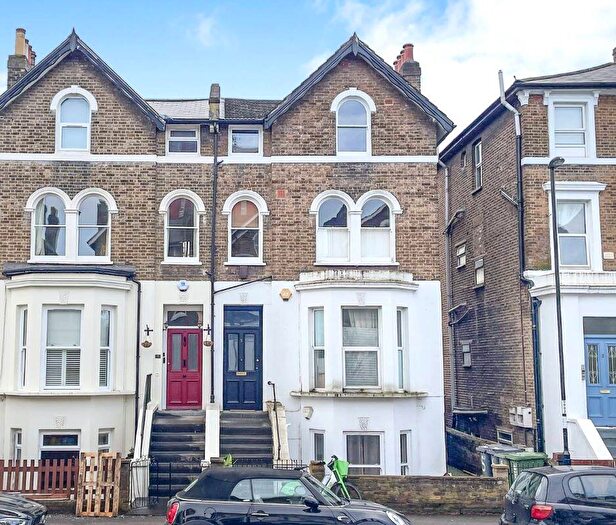
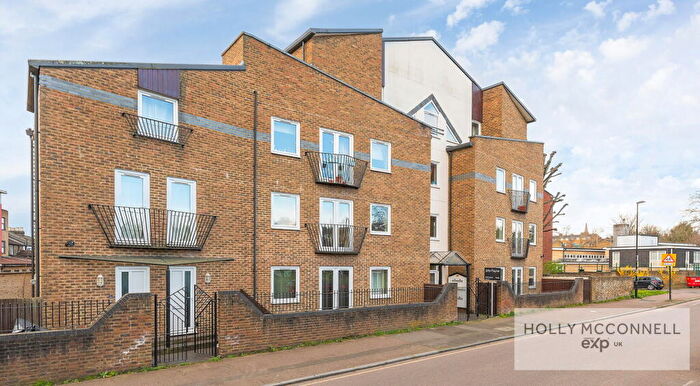
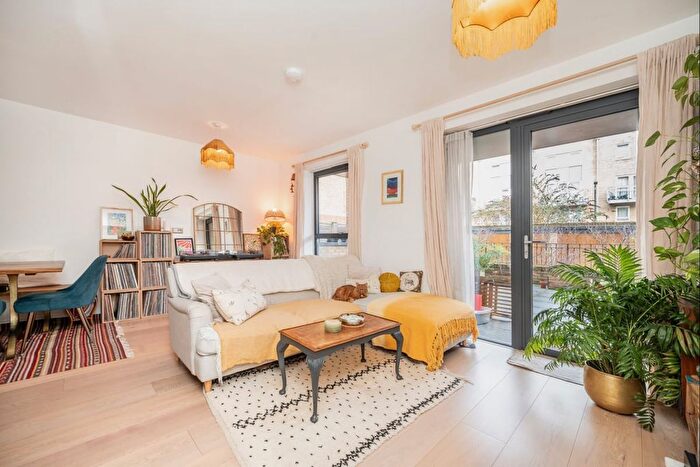
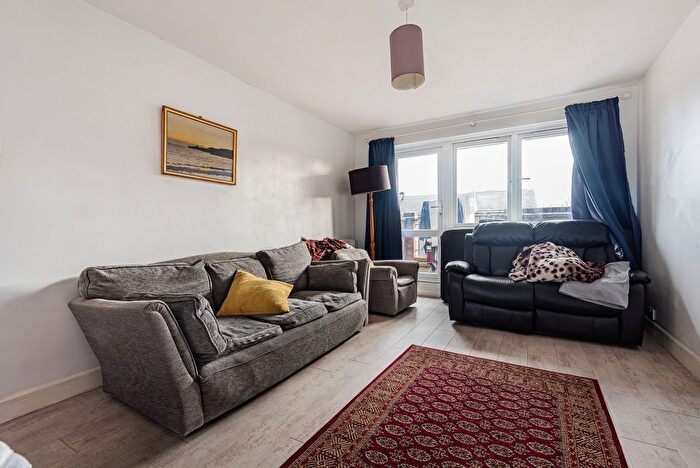
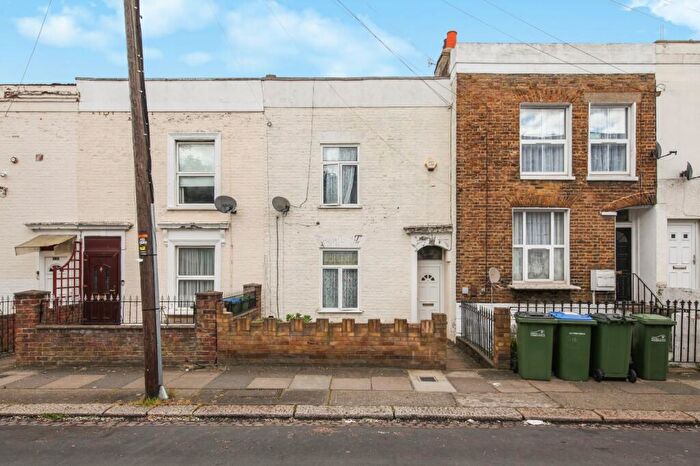
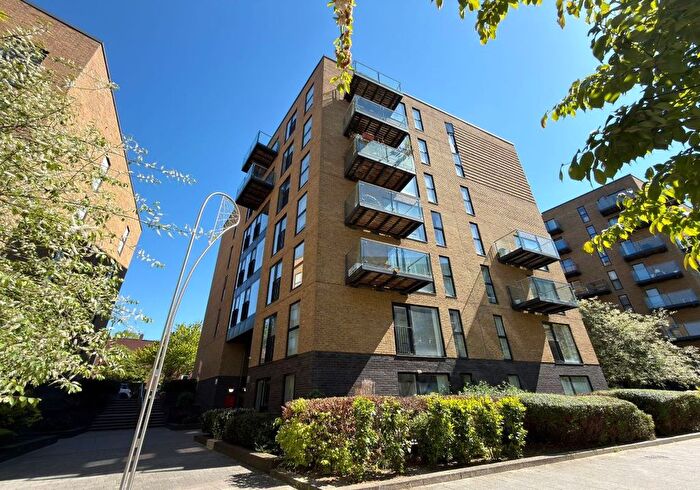
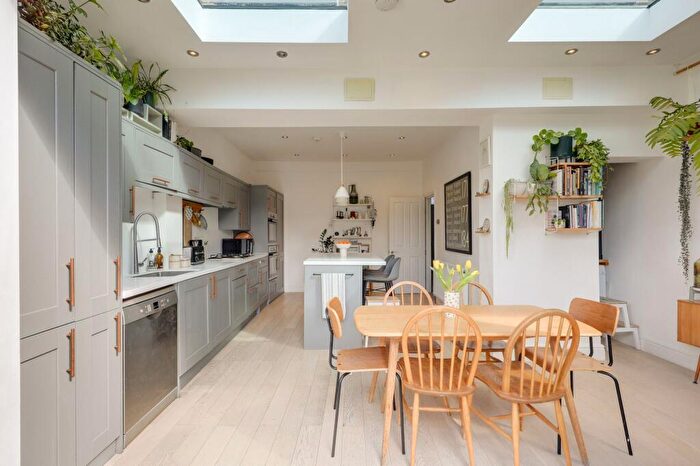
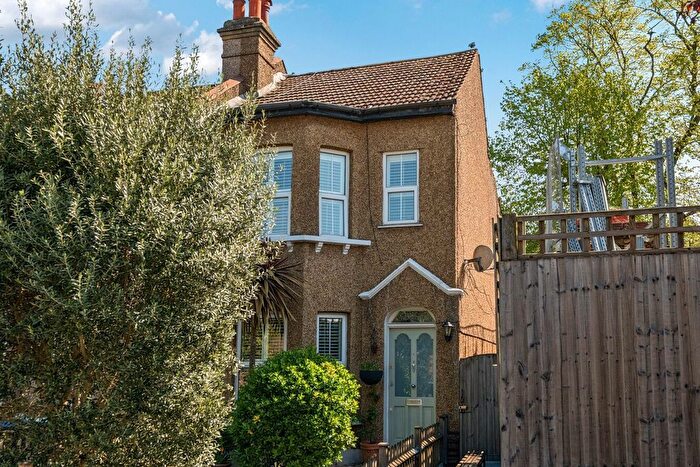
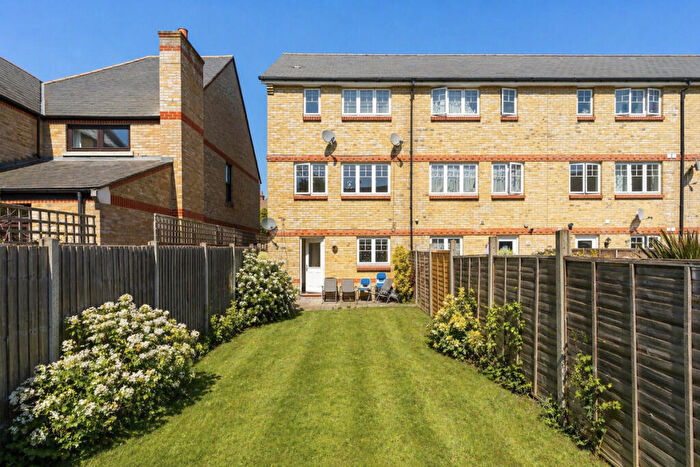
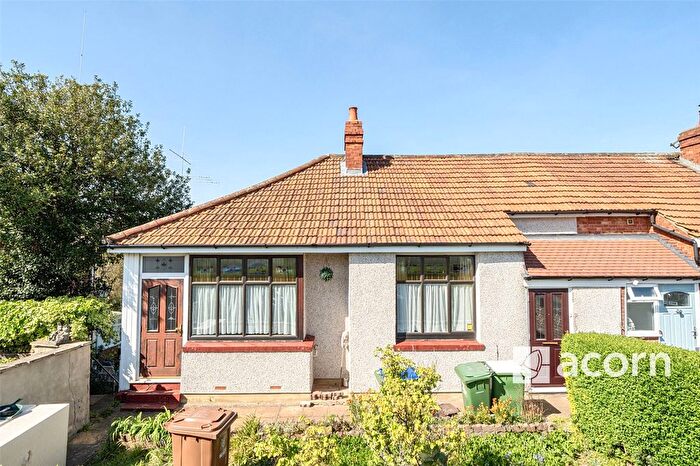
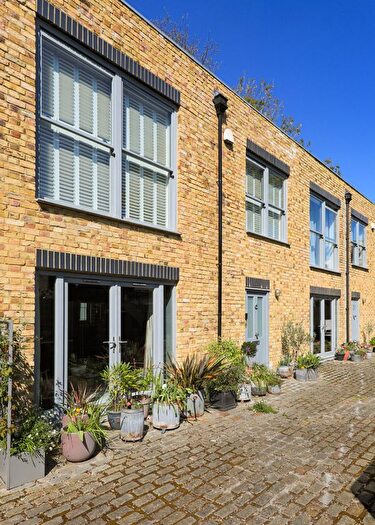
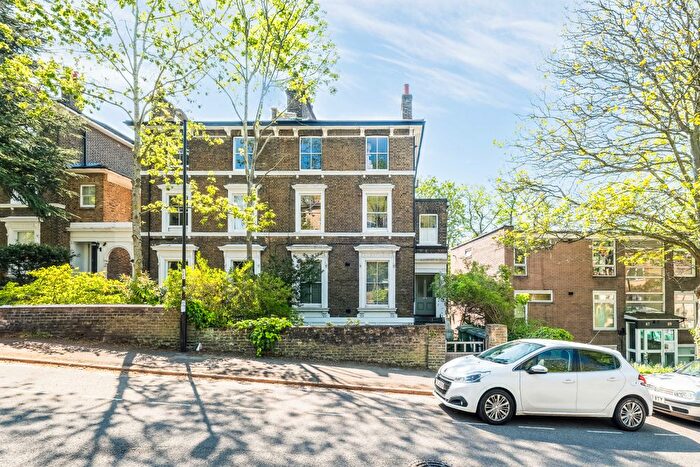
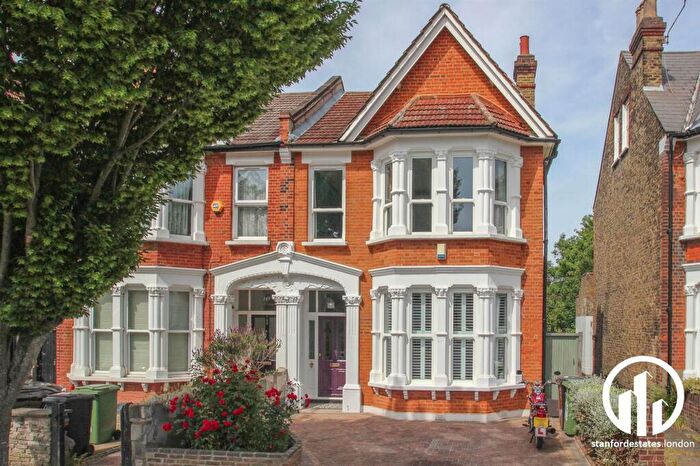
Houses and Flats for sale in SE, South East London
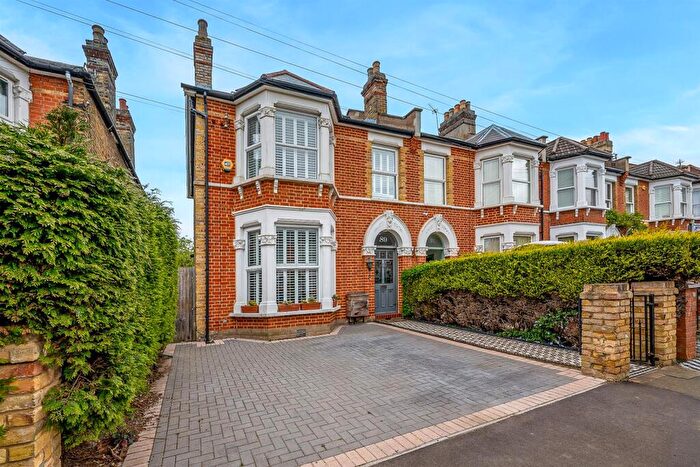
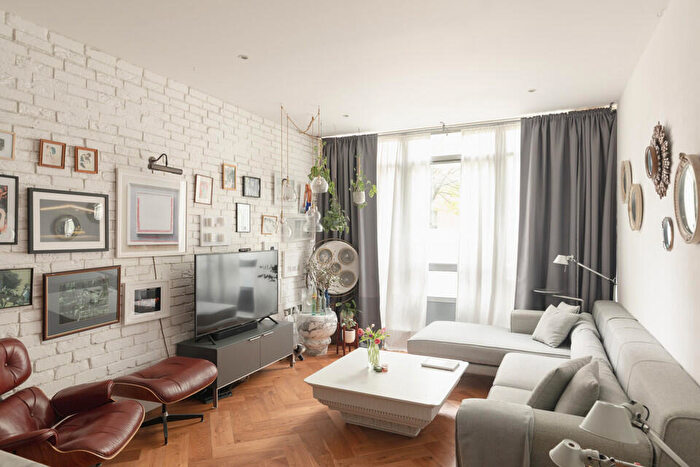
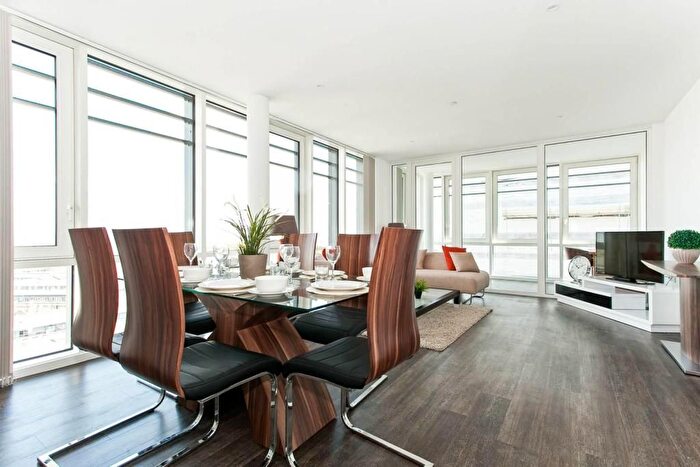
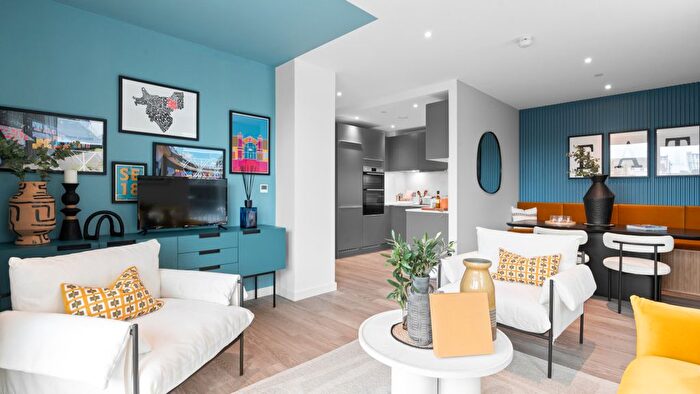
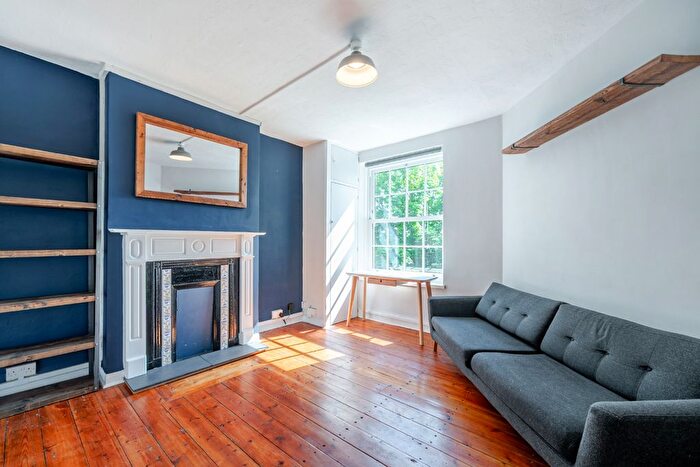
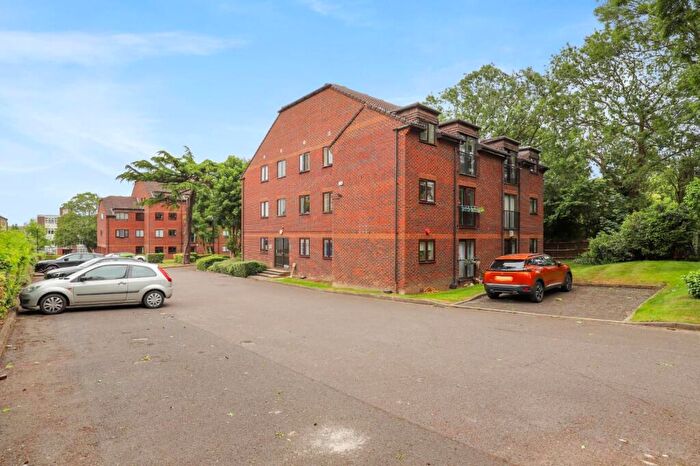
![]()
If you are looking to sell your house, let it out, or receive a property valuation, an expert can help you.
Click the button below to get started.

Postcode districts in SE, South East London
Navigate through our locations to find the location of your next house in SE, South East London, England for sale or to rent.
Transport in SE, South East London
Please see below transportation links in this area:
-

 Brockley Station
 -
St Johns Station
-
St.John's Station
-
New Cross Gate Station
-
New Cross Station
-
 Elverson Road Station
 -
Deptford Bridge Station
-
Lewisham Station
-
Crofton Park Station
-
Nunhead Station
Frequently asked questions about SE
What is the average price for a property for sale in SE?
The average price for a property for sale in SE is £553,113. This amount is 54% higher than the average price in England. There are 5,854 property listings for sale in SE.
What locations have the most expensive properties for sale in SE?
The locations with the most expensive properties for sale in SE are SE21 at an average of £1,032,662, SE24 at an average of £912,975 and SE22 at an average of £776,712.
What locations have the most affordable properties for sale in SE?
The locations with the most affordable properties for sale in SE are SE28 at an average of £321,776, SE25 at an average of £382,659 and SE2 at an average of £396,816.
Which train stations are available in or near SE?
Some of the train stations available in or near SE are Brockley, St Johns and St.John's.