
Properties for sale in AB33
Alford
- Info
- Price Paid By Year
- Transport
House Prices in AB33
Properties in AB33 have an average house price of £234,866.00 and had 102 Property Transactions within the last 3 years.
The most expensive property was sold for £700,000.00.
Property Price Paid in AB33 by Year
The average sold property price by year was:
| Year | Average Sold Price | Sold Properties |
|---|---|---|
| 2025 | £244,595.00 | 31 Properties |
| 2024 | £215,260.00 | 20 Properties |
| 2023 | £236,642.00 | 51 Properties |
| 2022 | £273,572.00 | 152 Properties |
| 2021 | £254,011.00 | 150 Properties |
| 2020 | £240,263.00 | 95 Properties |
| 2019 | £222,047.00 | 111 Properties |
| 2018 | £233,666.00 | 112 Properties |
| 2017 | £235,673.00 | 104 Properties |
| 2016 | £225,779.00 | 101 Properties |
| 2015 | £237,409.00 | 142 Properties |
| 2014 | £250,191.00 | 156 Properties |
| 2013 | £225,097.00 | 119 Properties |
| 2012 | £215,368.00 | 88 Properties |
| 2011 | £243,927.00 | 83 Properties |
| 2010 | £233,928.00 | 63 Properties |
| 2009 | £219,292.00 | 72 Properties |
| 2008 | £176,376.00 | 70 Properties |
| 2007 | £219,876.00 | 102 Properties |
| 2006 | £152,491.00 | 85 Properties |
| 2005 | £158,628.00 | 101 Properties |
| 2004 | £160,992.00 | 110 Properties |
| 2003 | £108,121.00 | 125 Properties |
| 2002 | £96,717.00 | 118 Properties |
| 2001 | £118,197.00 | 9 Properties |
Transport near AB33

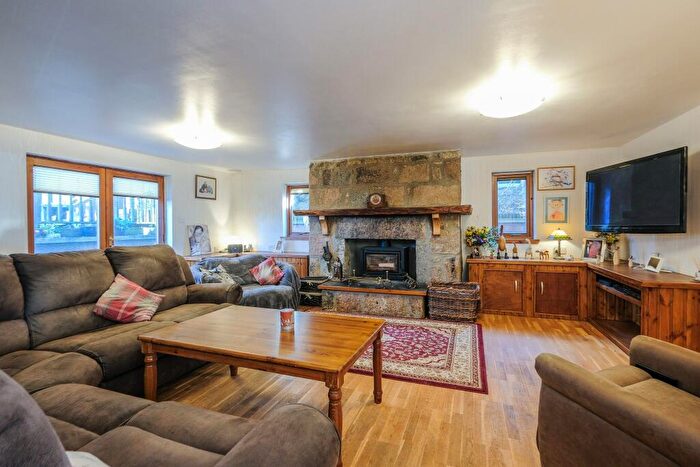
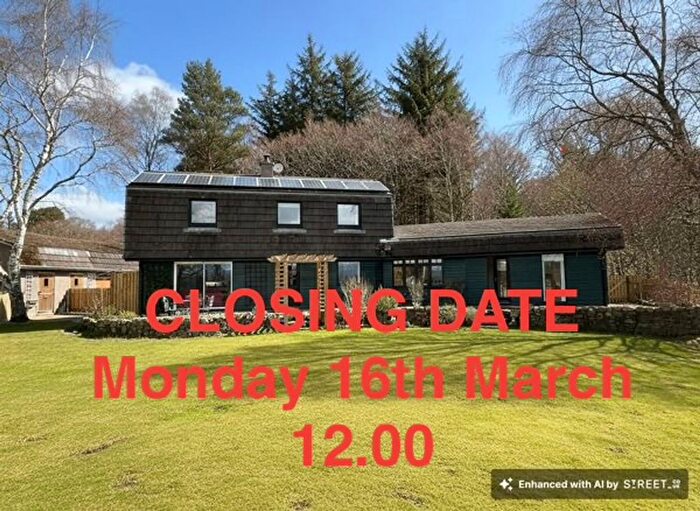
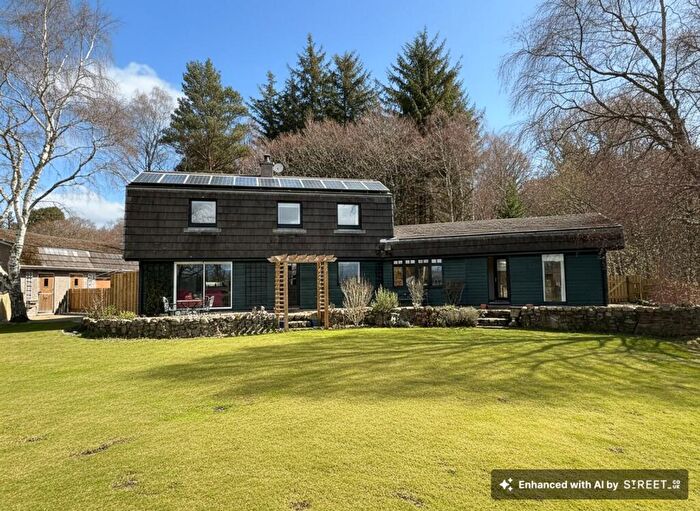
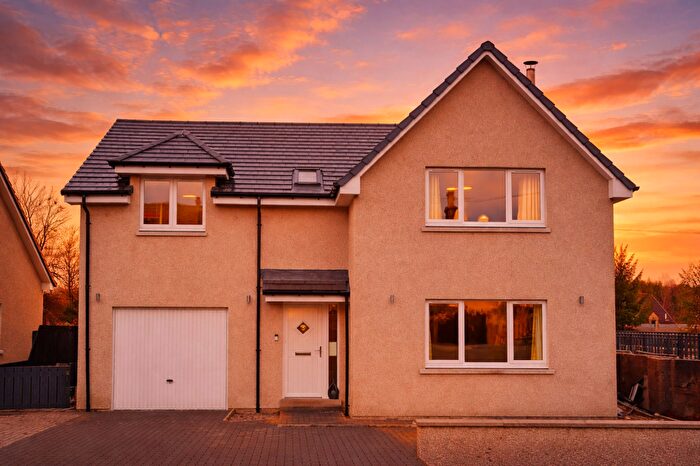
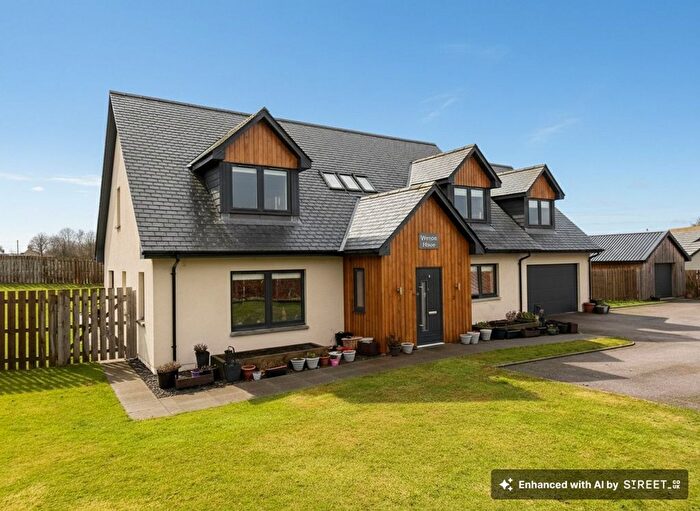
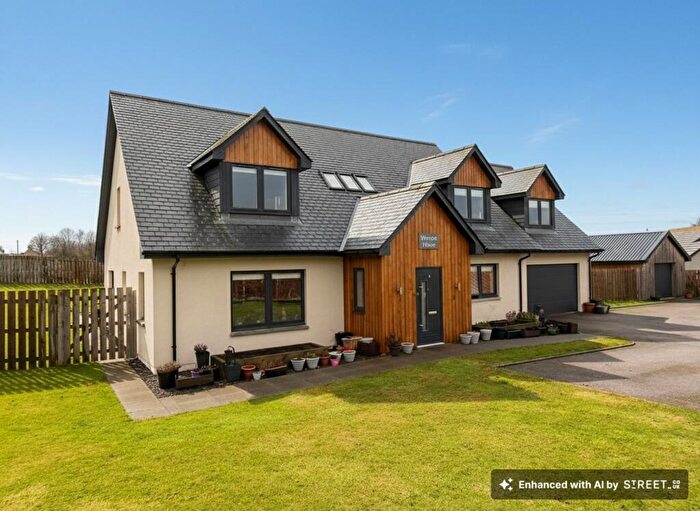
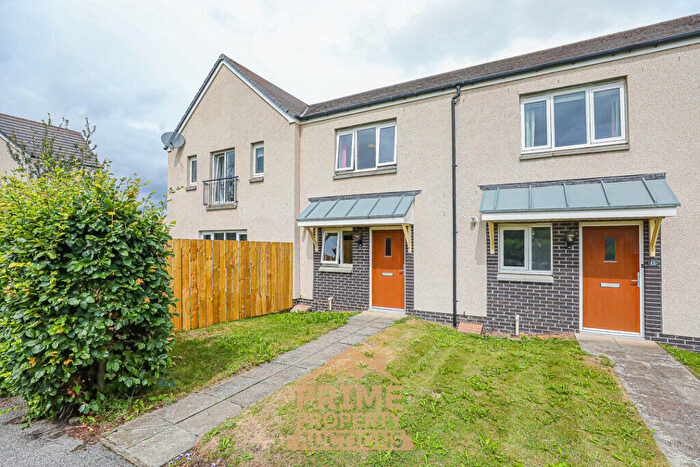
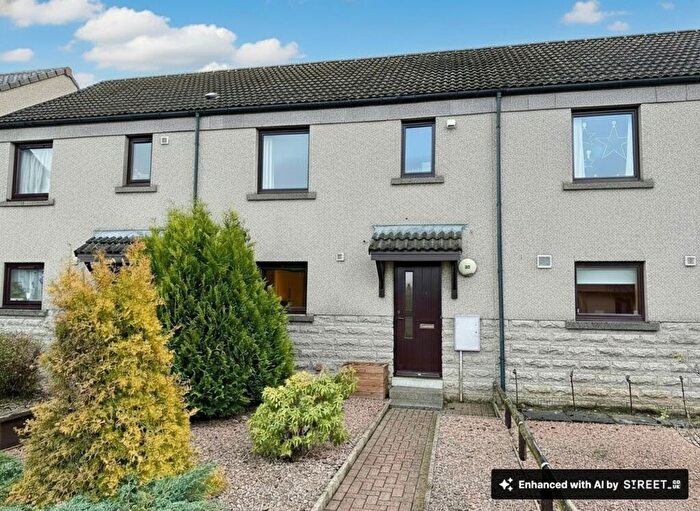
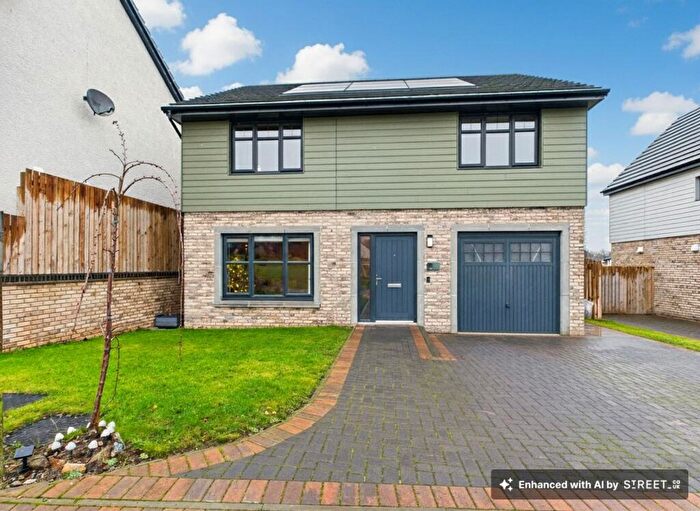
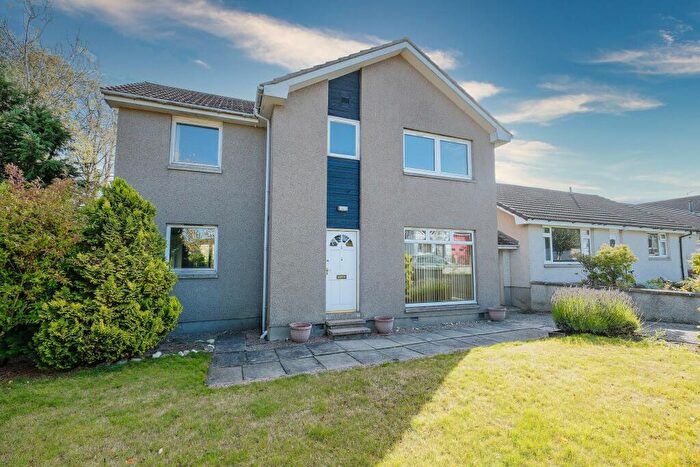
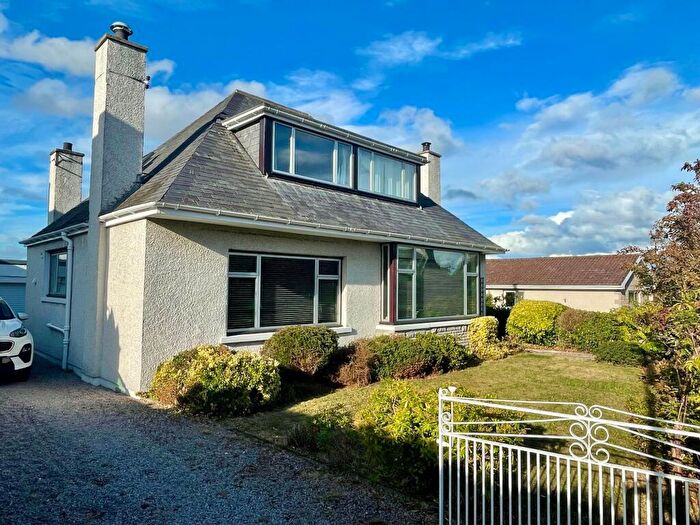
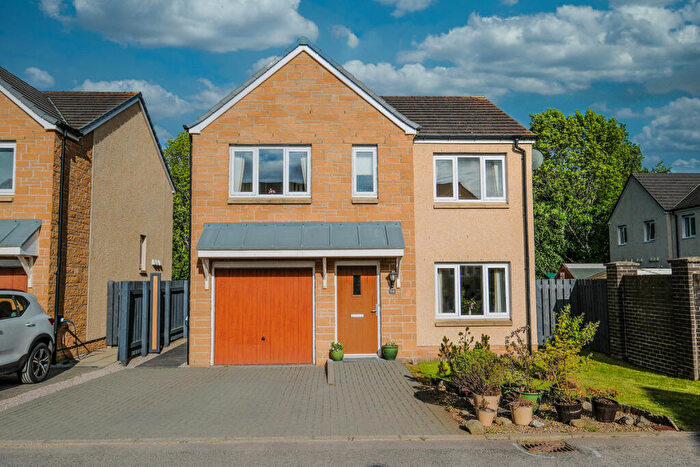
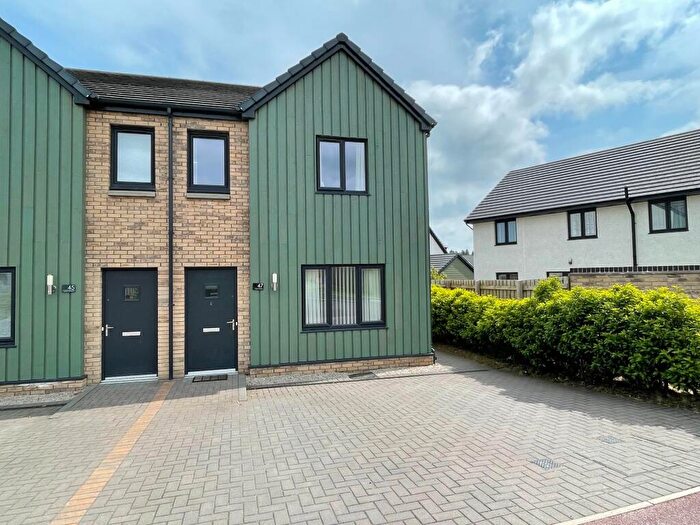
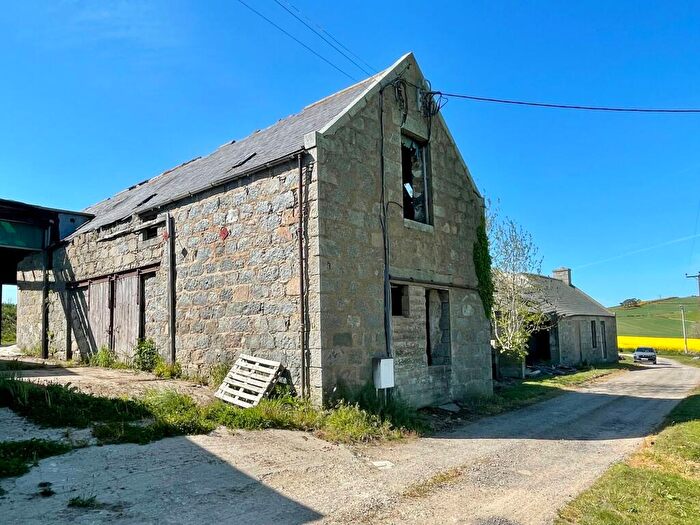
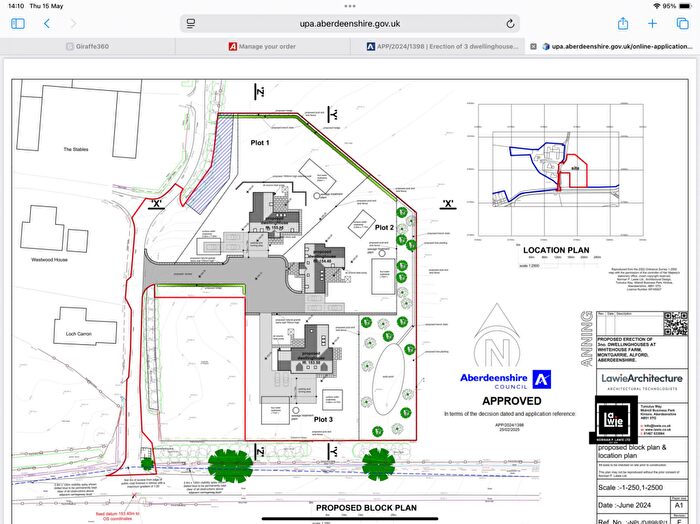
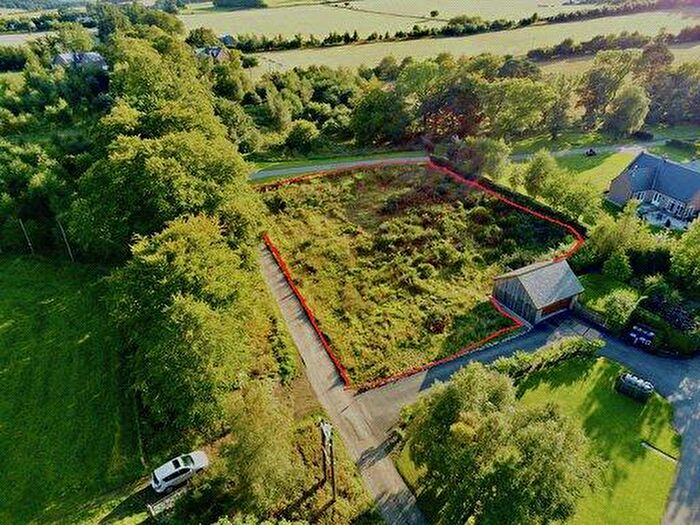
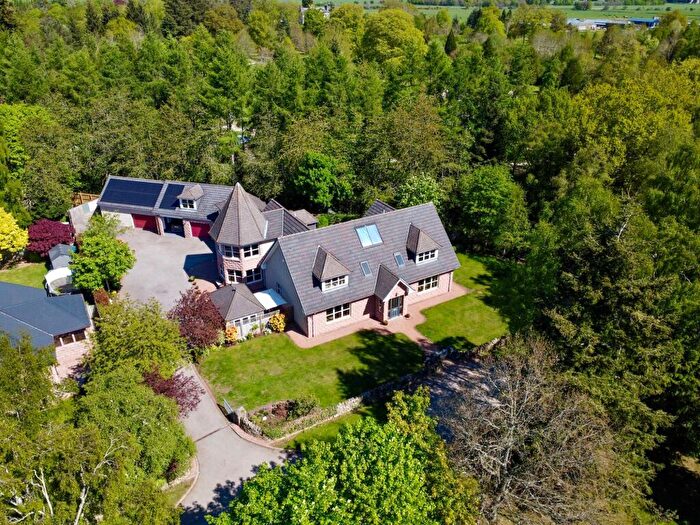
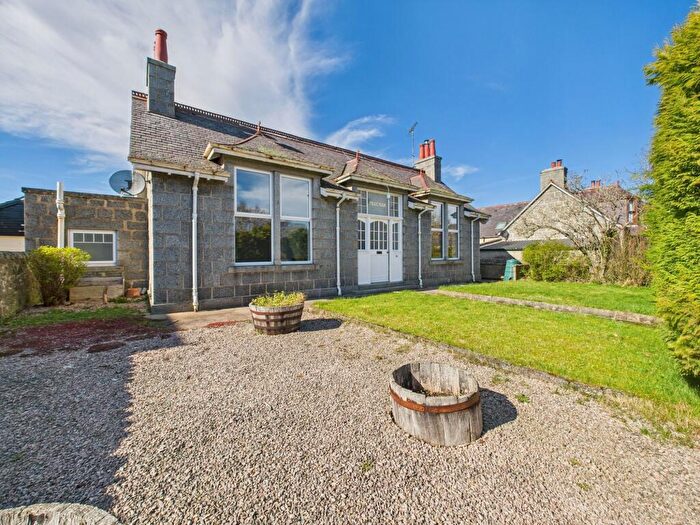
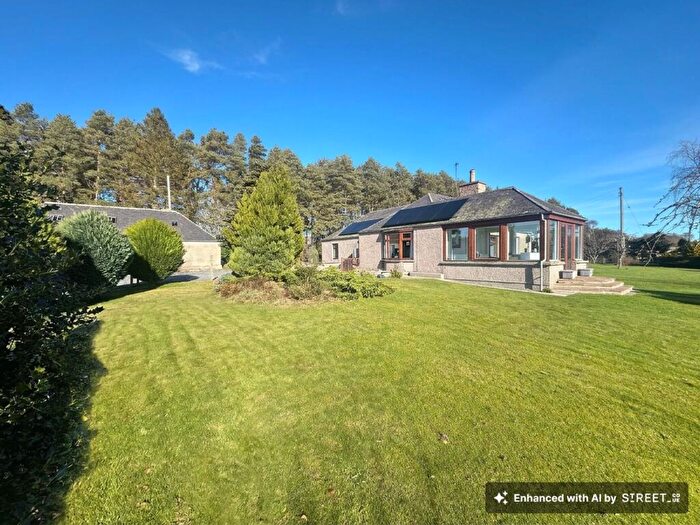
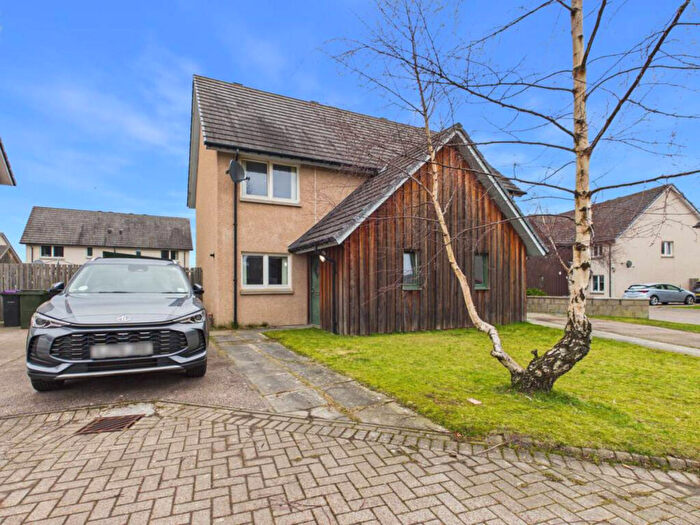
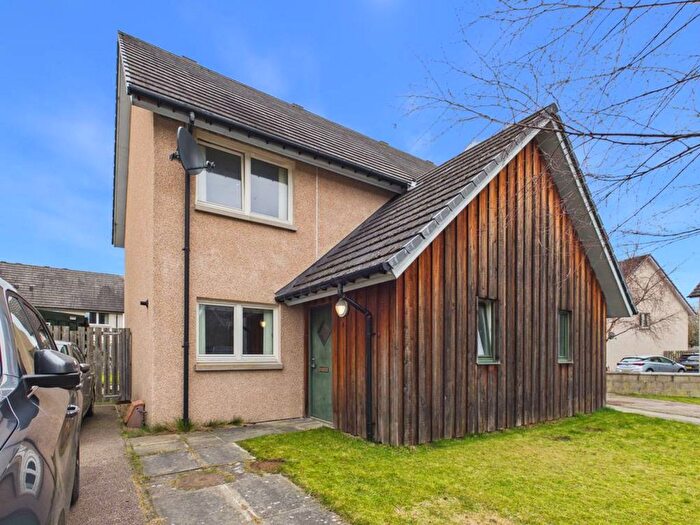
Houses and Flats for sale in AB33, Alford

![]()
If you are looking to sell your house, let it out, or receive a property valuation, an expert can help you.
Click the button below to get started.
Properties for sale near AB33

Frequently Asked Questions about AB33
What is the average price for a property for sale in AB33?
The average price for a property for sale in AB33 is £234,866. There are 19 property listings for sale in AB33.
Which areas are included in the AB33 postcode district?
The main area within AB33 is Alford.
What are the most common property types in AB33?
The most common property types in AB33 are Unknowns.
What has been the average sold property price in AB33 over the last three years?
Unknowns in AB33 have an average sold price of £234,866. The average sold property price in AB33 over the last three years is approximately £232,166.