
Properties for sale in B11
Sparkhill, Tyseley
- Info
- Price Paid By Year
- Property Type Price
- Transport
House Prices in B11
Properties in B11 have an average house price of £190,162.00 and had 697 Property Transactions within the last 3 years.
The most expensive property was sold for £790,000.00.
Property Price Paid in B11 by Year
The average sold property price by year was:
| Year | Average Sold Price | Sold Properties |
|---|---|---|
| 2026 | £208,600.00 | 5 Properties |
| 2025 | £198,207.00 | 234 Properties |
| 2024 | £186,315.00 | 245 Properties |
| 2023 | £185,316.00 | 213 Properties |
| 2022 | £184,326.00 | 261 Properties |
| 2021 | £166,004.00 | 321 Properties |
| 2020 | £172,204.00 | 302 Properties |
| 2019 | £165,092.00 | 386 Properties |
| 2018 | £148,280.00 | 370 Properties |
| 2017 | £133,844.00 | 308 Properties |
| 2016 | £128,375.00 | 286 Properties |
| 2015 | £116,148.00 | 259 Properties |
| 2014 | £118,956.00 | 241 Properties |
| 2013 | £105,999.00 | 196 Properties |
| 2012 | £115,941.00 | 207 Properties |
| 2011 | £116,965.00 | 219 Properties |
| 2010 | £120,058.00 | 275 Properties |
| 2009 | £118,848.00 | 244 Properties |
| 2008 | £129,399.00 | 347 Properties |
| 2007 | £131,733.00 | 569 Properties |
| 2006 | £132,009.00 | 642 Properties |
| 2005 | £123,396.00 | 516 Properties |
| 2004 | £113,725.00 | 602 Properties |
| 2003 | £98,654.00 | 605 Properties |
| 2002 | £70,983.00 | 661 Properties |
| 2001 | £58,574.00 | 589 Properties |
| 2000 | £47,324.00 | 572 Properties |
| 1999 | £42,640.00 | 565 Properties |
| 1998 | £40,607.00 | 480 Properties |
| 1997 | £39,025.00 | 507 Properties |
| 1996 | £37,146.00 | 418 Properties |
| 1995 | £37,032.00 | 395 Properties |
Property Price per Property Type in B11
Here you can find historic sold price data in order to help with your property search.
The average Property Paid Price for specific property types in the last three years are:
| Property Type | Average Sold Price | Sold Properties |
|---|---|---|
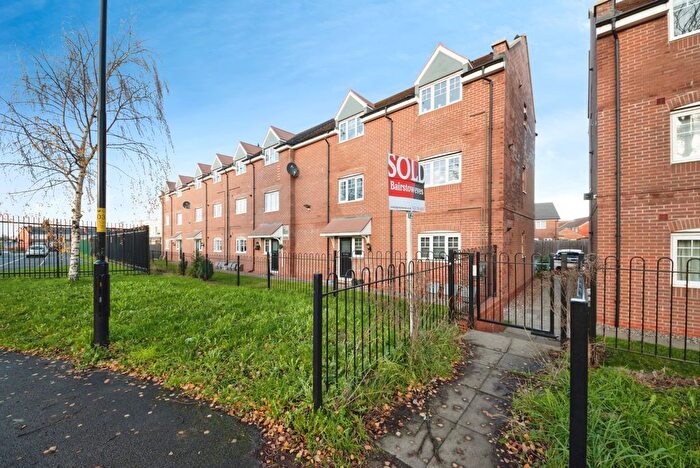
| Semi Detached House | £231,094.00 | 109 Semi Detached Houses |
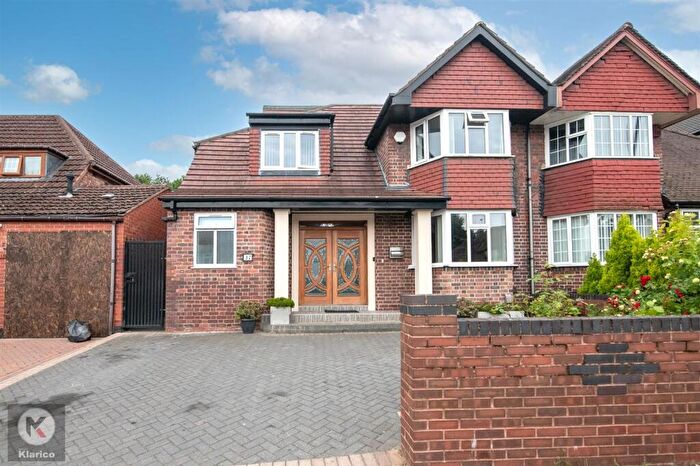
| Detached House | £320,500.00 | 12 Detached Houses |
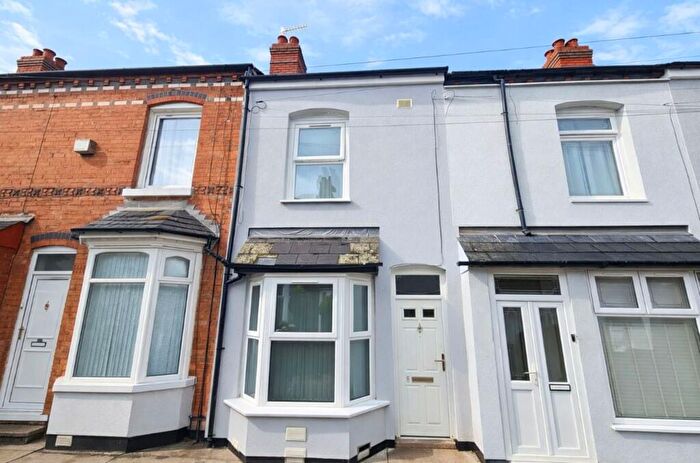
| Terraced House | £185,452.00 | 530 Terraced Houses |
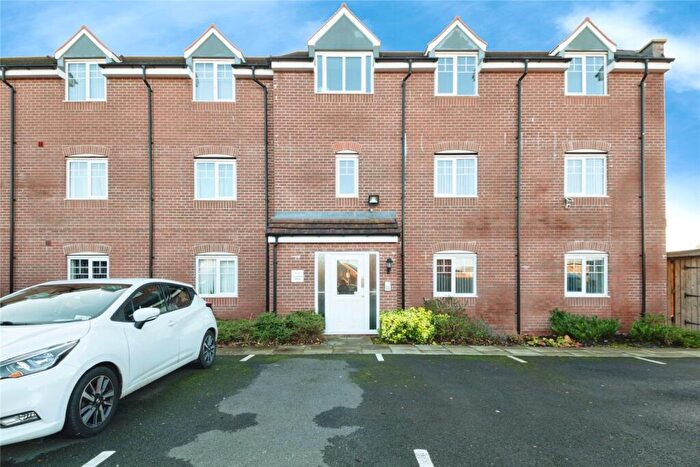
| Flat | £113,444.00 | 46 Flats |

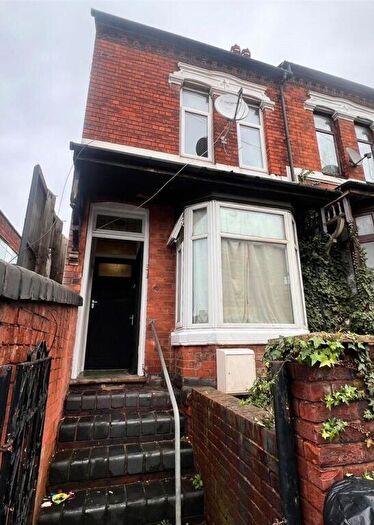
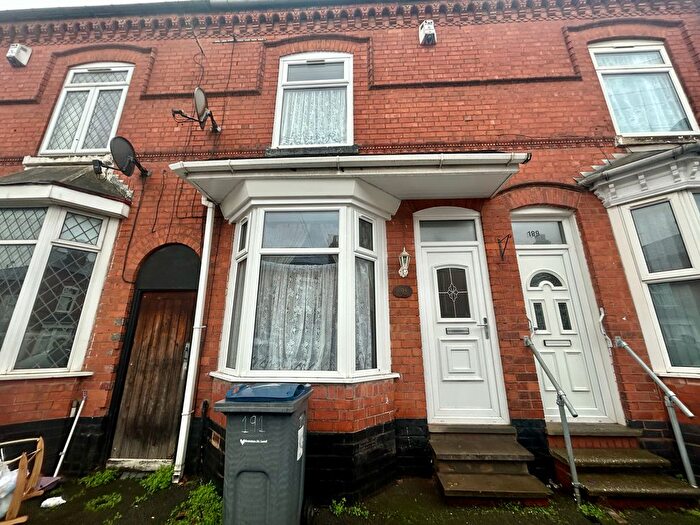
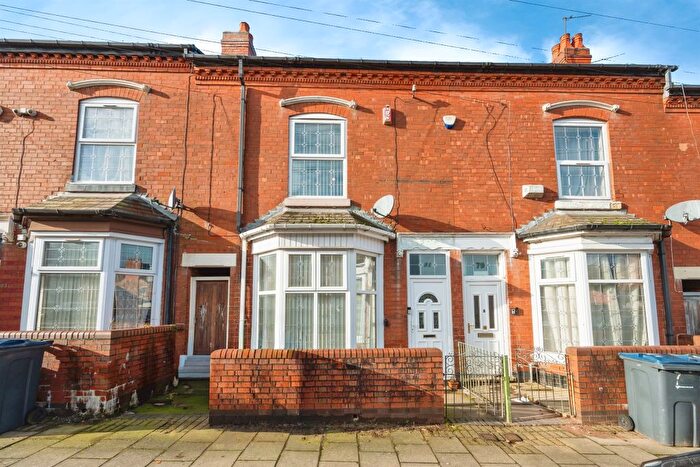
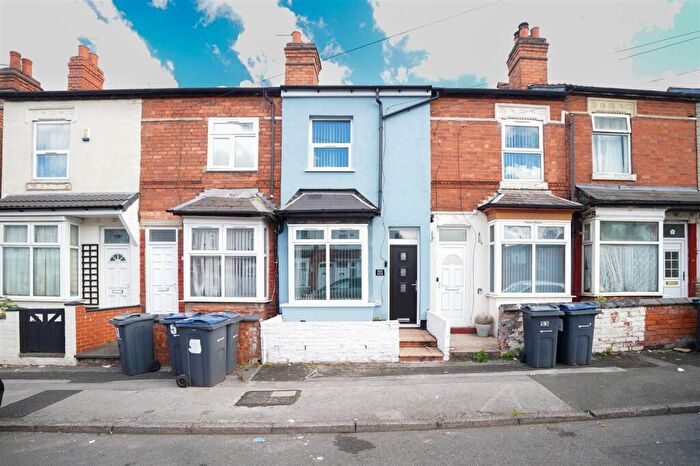
Houses and Flats for sale in B11, Sparkhill, Tyseley
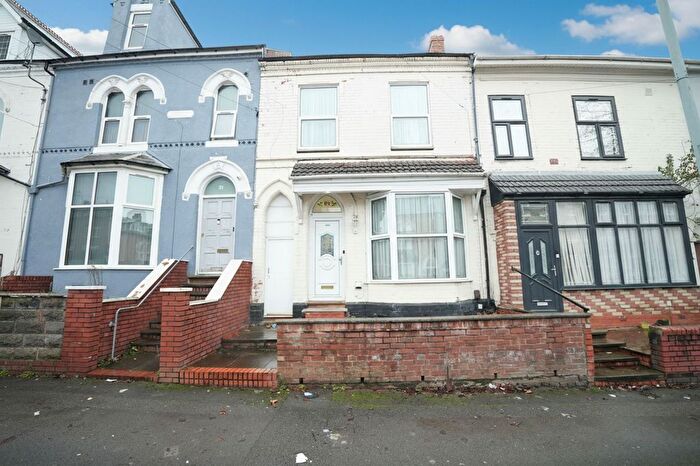
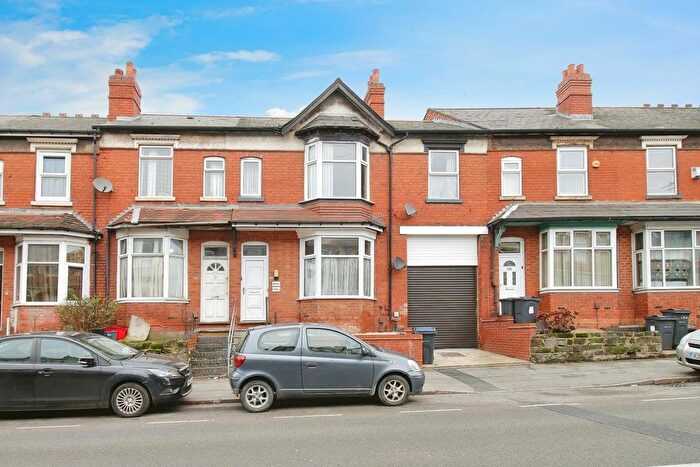
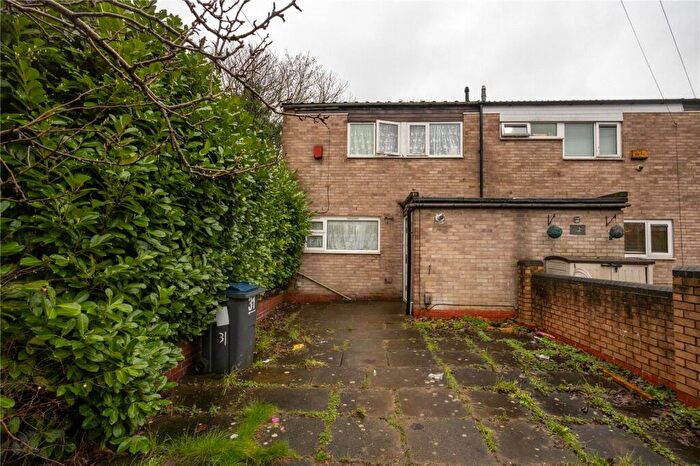
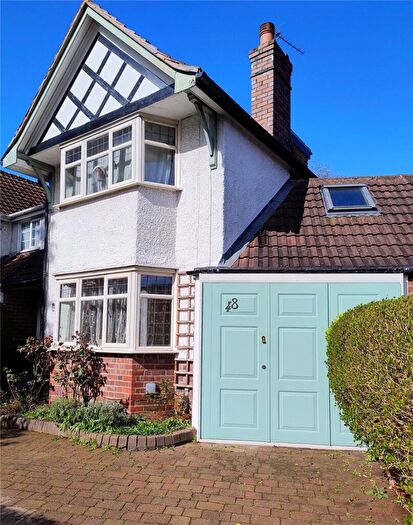
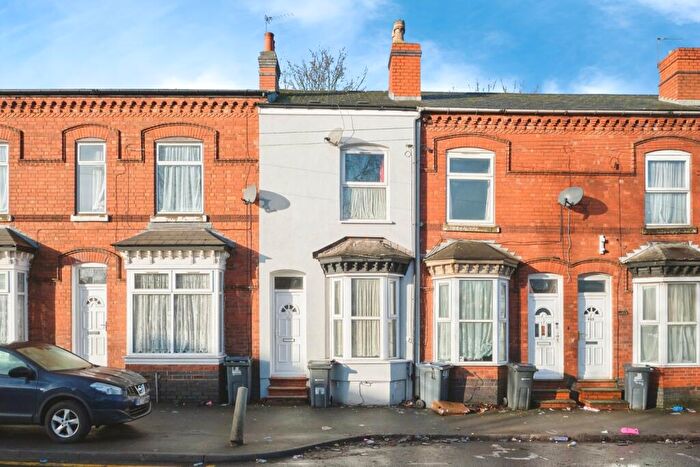

![]()
If you are looking to sell your house, let it out, or receive a property valuation, an expert can help you.
Click the button below to get started.

Frequently Asked Questions about B11
What is the average price for a property for sale in B11?
The average price for a property for sale in B11 is £190,162. There are 51 property listings for sale in B11.
Which areas are included in the B11 postcode district?
The main areas within B11 include Sparkhill and Tyseley.
What are the most common property types in B11?
The most common property types in B11 are Terraced Houses, Semi Detached Houses, Flats and Detached Houses.
What has been the average sold property price in B11 over the last three years?
Terraced Houses in B11 have an average sold price of £185,452, while Semi Detached Houses have an average of £231,094. Flats have an average of £113,444 and Detached Houses have an average of £320,500. The average sold property price in B11 over the last three years is approximately £197,707.
Which train stations are available in B11?
The train stations available in B11 are Spring Road Station and Tyseley Station..