
Properties for sale in B73
Boldmere, New Oscott, Wylde Green
- Info
- Price Paid By Year
- Property Type Price
- Transport
House Prices in B73
Properties in B73 have an average house price of £362,921.00 and had 961 Property Transactions within the last 3 years.
The most expensive property was sold for £1,150,000.00.
Property Price Paid in B73 by Year
The average sold property price by year was:
| Year | Average Sold Price | Sold Properties |
|---|---|---|
| 2026 | £359,075.00 | 24 Properties |
| 2025 | £357,330.00 | 361 Properties |
| 2024 | £372,761.00 | 312 Properties |
| 2023 | £359,288.00 | 264 Properties |
| 2022 | £371,519.00 | 377 Properties |
| 2021 | £351,493.00 | 470 Properties |
| 2020 | £348,324.00 | 298 Properties |
| 2019 | £308,788.00 | 385 Properties |
| 2018 | £306,813.00 | 422 Properties |
| 2017 | £290,778.00 | 428 Properties |
| 2016 | £270,893.00 | 451 Properties |
| 2015 | £260,208.00 | 425 Properties |
| 2014 | £253,339.00 | 443 Properties |
| 2013 | £234,647.00 | 337 Properties |
| 2012 | £225,013.00 | 329 Properties |
| 2011 | £213,897.00 | 313 Properties |
| 2010 | £234,903.00 | 343 Properties |
| 2009 | £215,604.00 | 251 Properties |
| 2008 | £235,812.00 | 306 Properties |
| 2007 | £239,304.00 | 503 Properties |
| 2006 | £213,957.00 | 560 Properties |
| 2005 | £214,405.00 | 463 Properties |
| 2004 | £201,943.00 | 539 Properties |
| 2003 | £185,300.00 | 560 Properties |
| 2002 | £153,787.00 | 630 Properties |
| 2001 | £136,311.00 | 543 Properties |
| 2000 | £117,614.00 | 458 Properties |
| 1999 | £100,750.00 | 632 Properties |
| 1998 | £93,429.00 | 487 Properties |
| 1997 | £89,060.00 | 481 Properties |
| 1996 | £80,482.00 | 430 Properties |
| 1995 | £76,118.00 | 355 Properties |
Property Price per Property Type in B73
Here you can find historic sold price data in order to help with your property search.
The average Property Paid Price for specific property types in the last three years are:
| Property Type | Average Sold Price | Sold Properties |
|---|---|---|
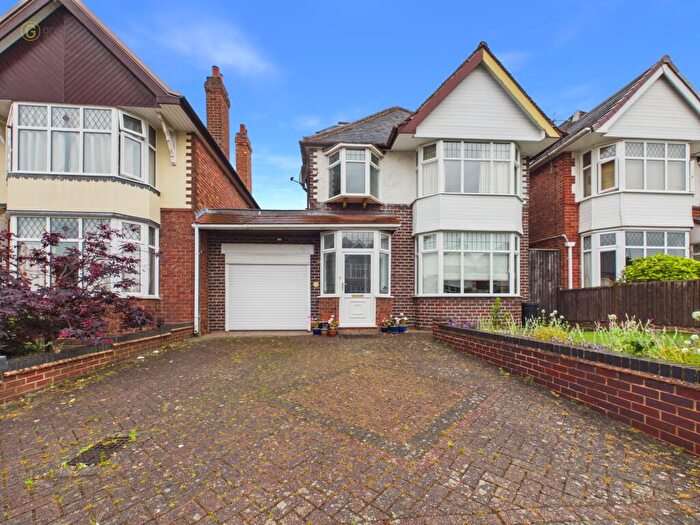
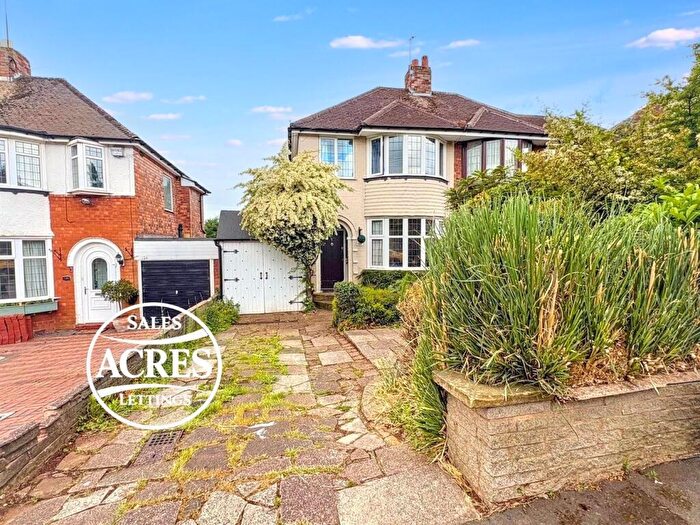
| Semi Detached House | £398,560.00 | 316 Semi Detached Houses |
| Detached House | £538,819.00 | 241 Detached Houses |
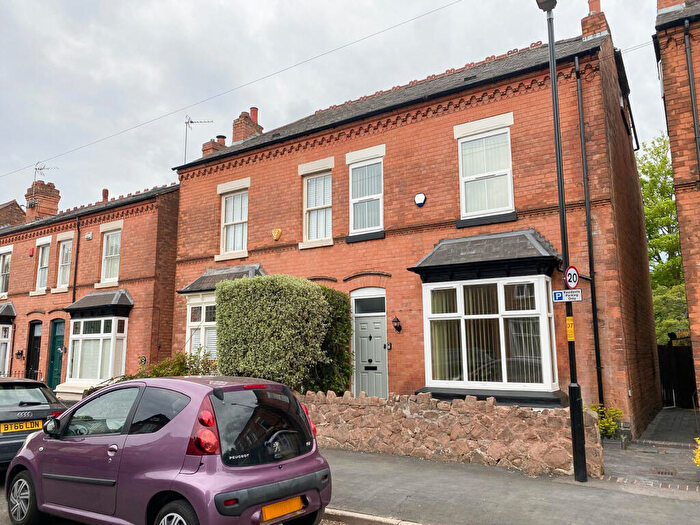
| Terraced House | £310,079.00 | 190 Terraced Houses |
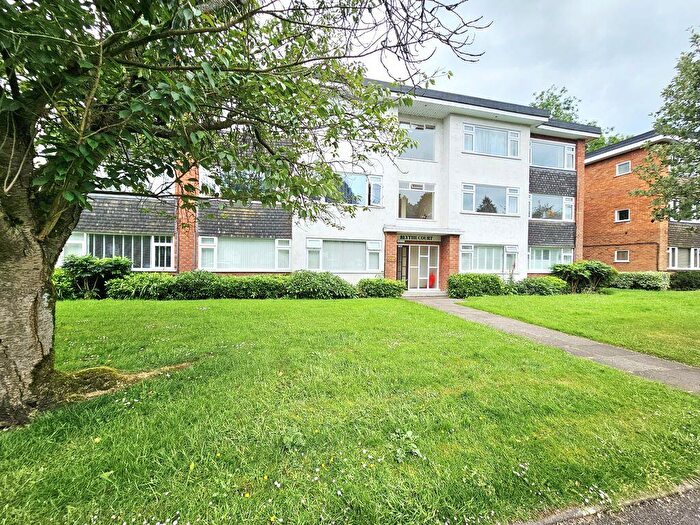
| Flat | £159,120.00 | 214 Flats |

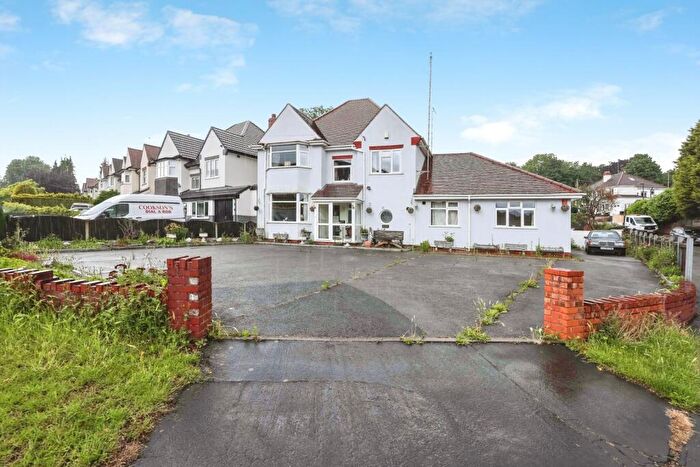
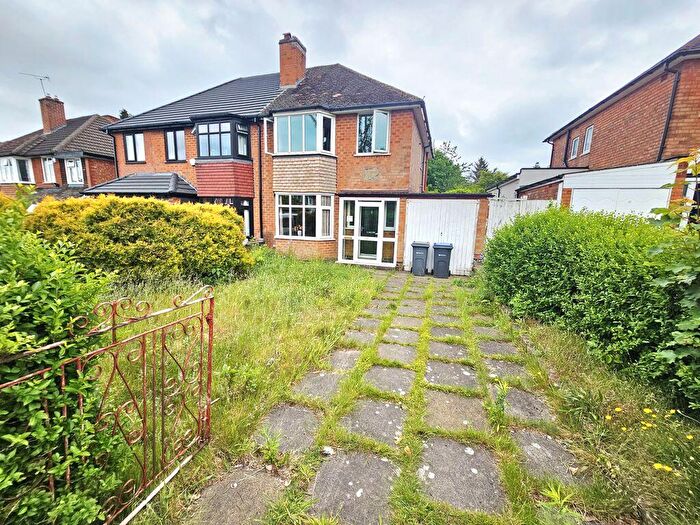
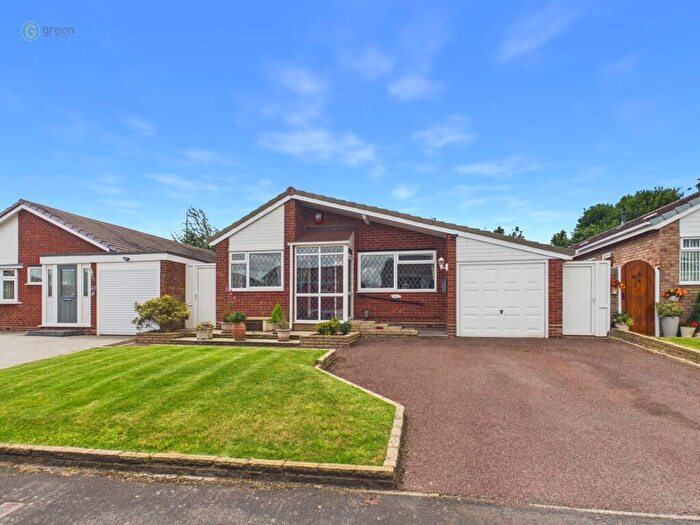
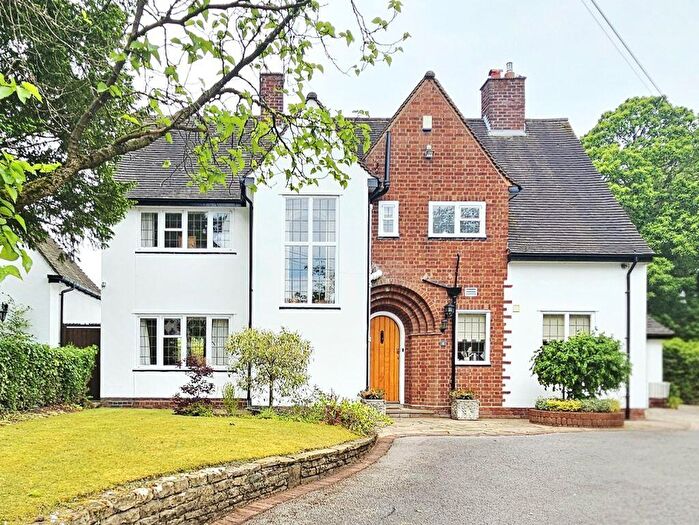
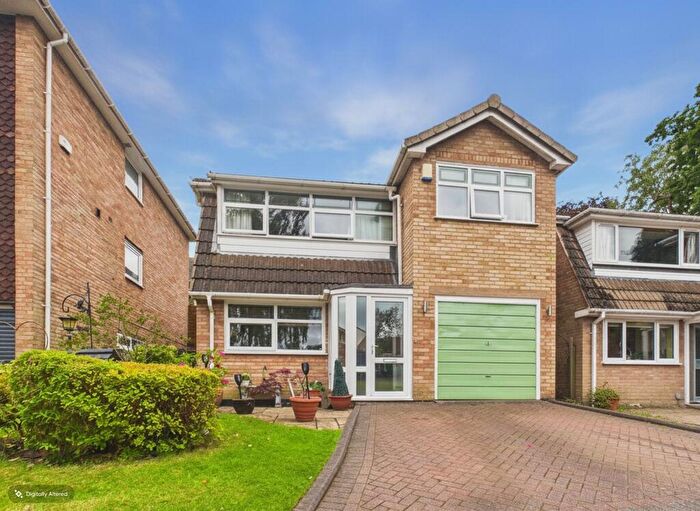
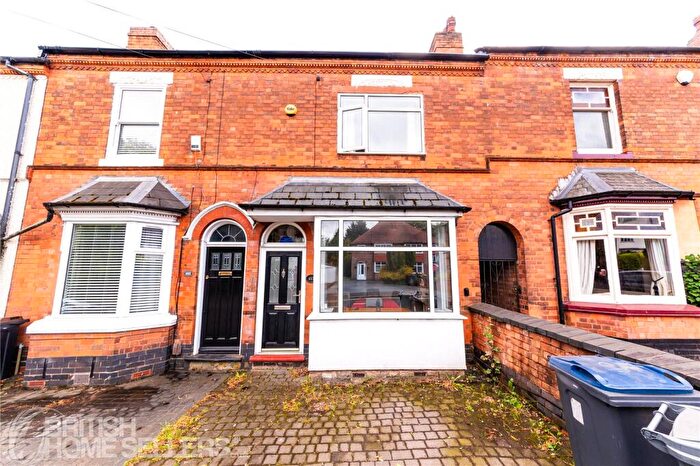
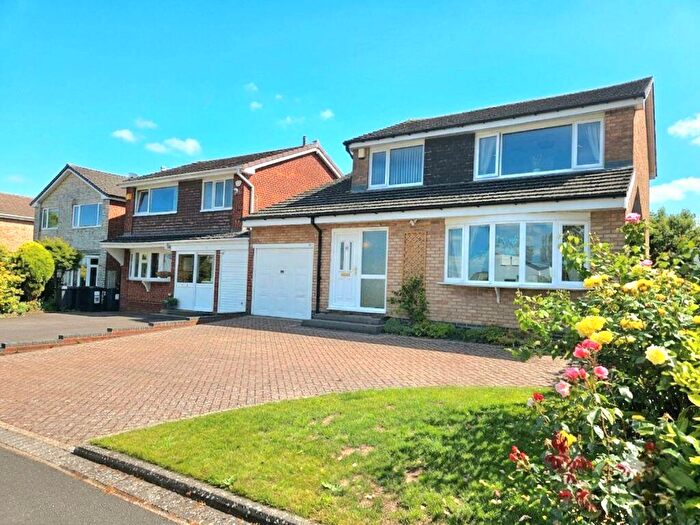
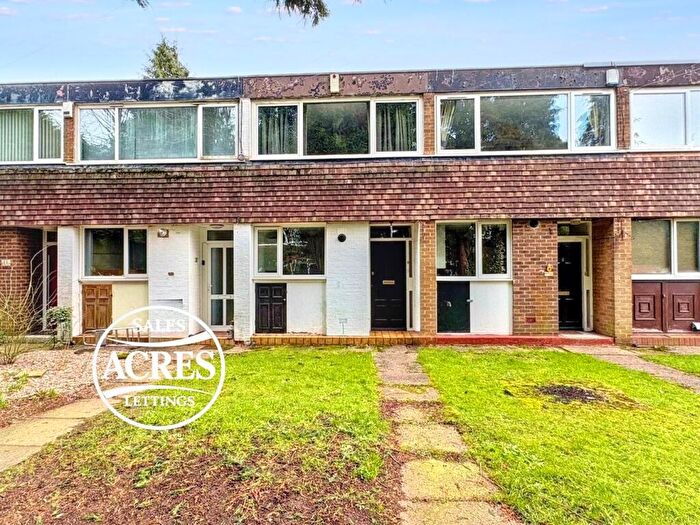
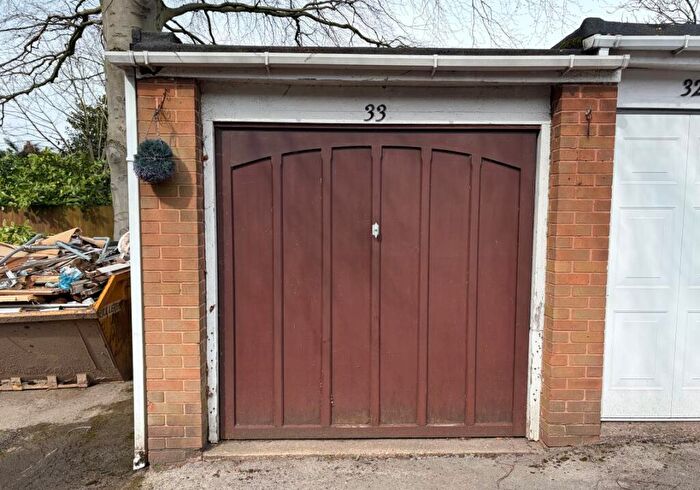
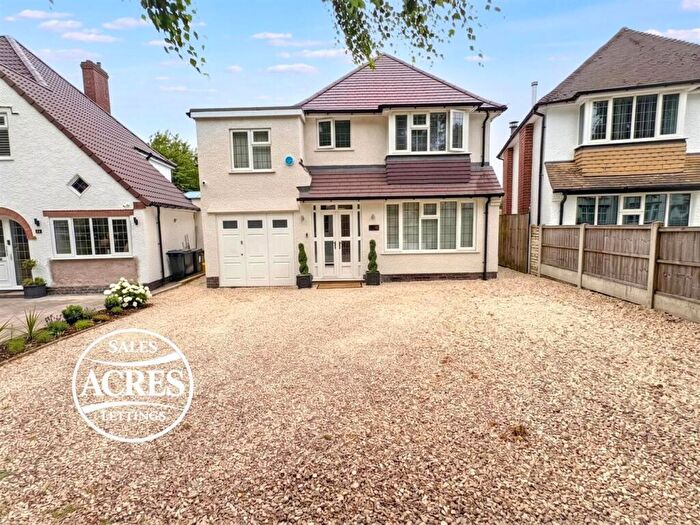
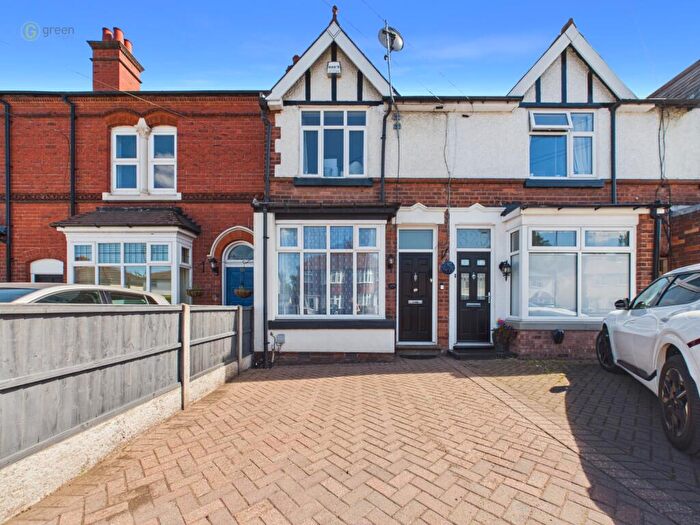
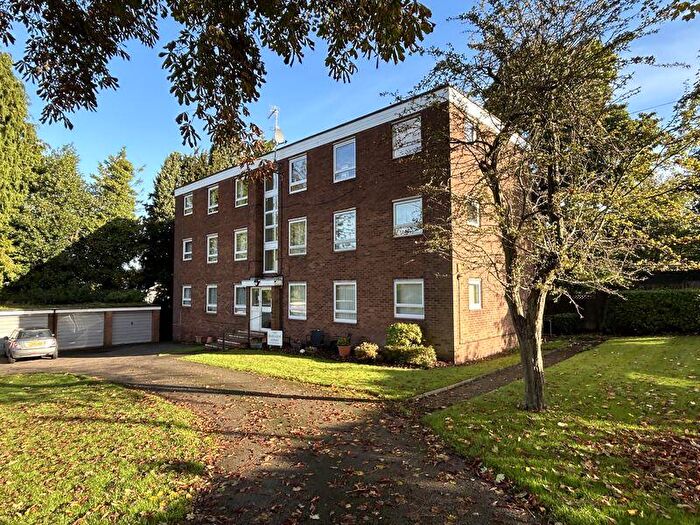
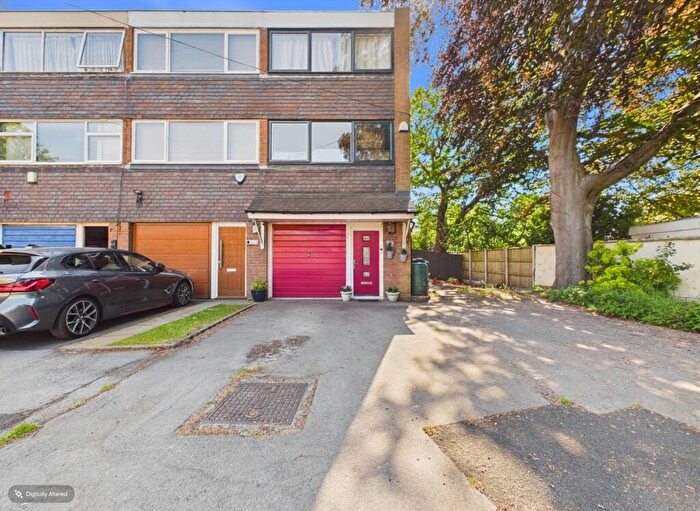
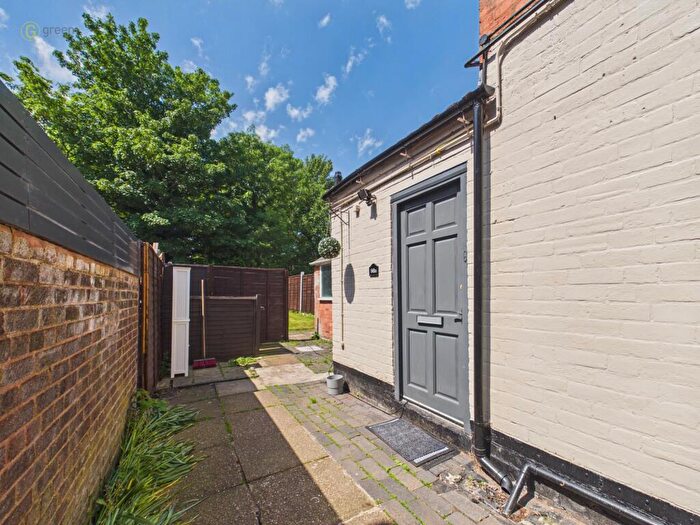
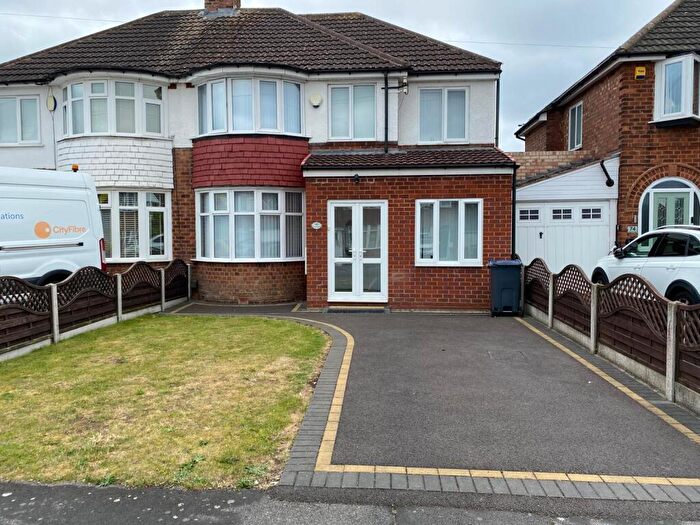
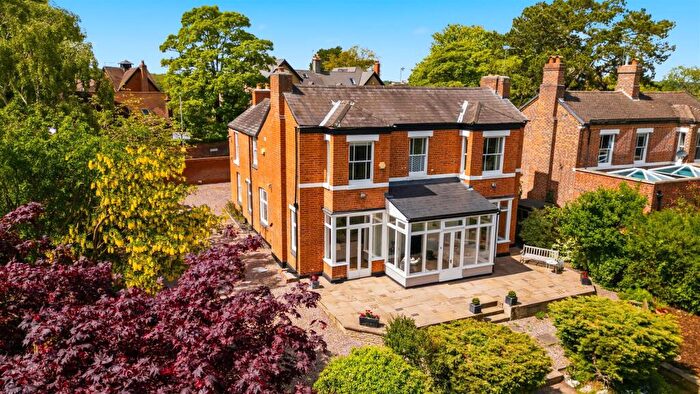
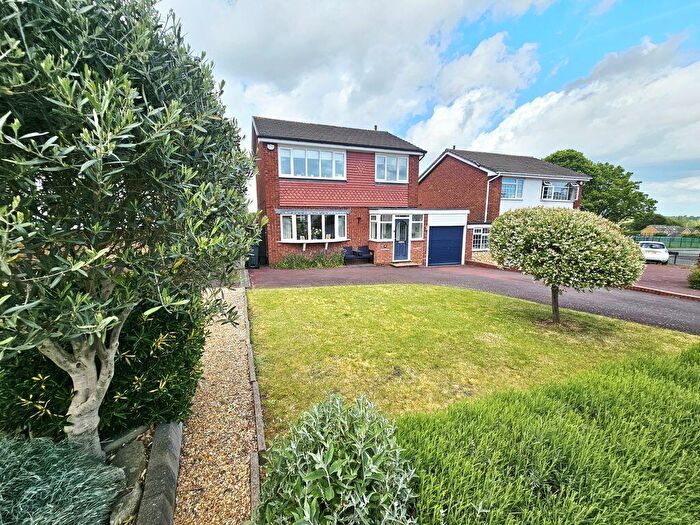
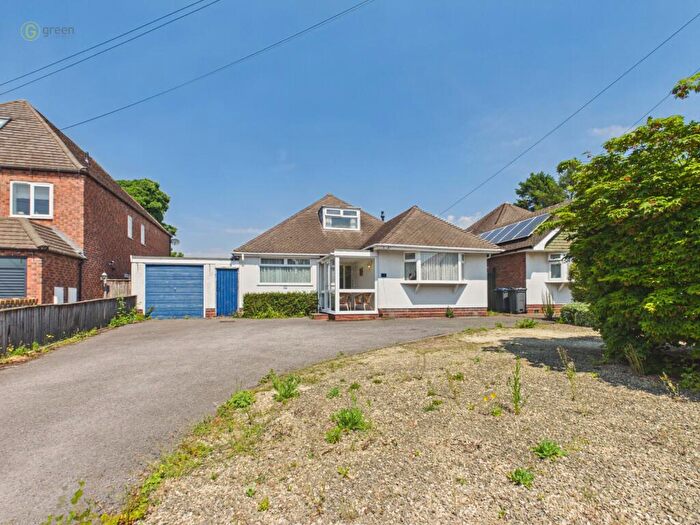
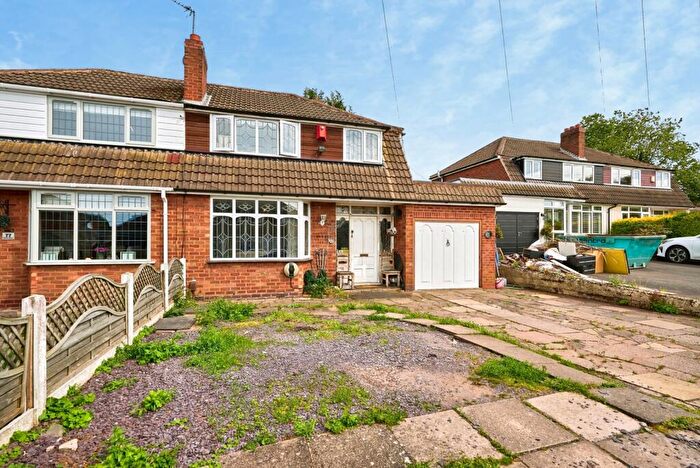
Houses and Flats for sale in B73, Boldmere, New Oscott, Wylde Green
There are 187 results. Property prices in B73 range from £80k to £1.3M with an average price of £411k.
![]()
If you are looking to sell your house, let it out, or receive a property valuation, an expert can help you.
Click the button below to get started.

Frequently Asked Questions about B73
What is the average price for a property for sale in B73?
The average price for a property for sale in B73 is £362,921. There are 187 property listings for sale in B73.
Which areas are included in the B73 postcode district?
The main areas within B73 include Boldmere, New Oscott and Wylde Green.
What are the most common property types in B73?
The most common property types in B73 are Semi Detached Houses, Detached Houses, Flats and Terraced Houses.
What has been the average sold property price in B73 over the last three years?
Semi Detached Houses in B73 have an average sold price of £398,560, while Detached Houses have an average of £538,819. Flats have an average of £159,120 and Terraced Houses have an average of £310,079. The average sold property price in B73 over the last three years is approximately £363,055.
Which train stations are available in B73?
The train stations available in B73 are Chester Road Station, Sutton Coldfield Station and Wylde Green Station..