
Properties for sale in B91
Olton, Solihull
- Info
- Price Paid By Year
- Property Type Price
- Transport
House Prices in B91
Properties in B91 have an average house price of £478,150.00 and had 1438 Property Transactions within the last 3 years.
The most expensive property was sold for £3,300,000.00.
Property Price Paid in B91 by Year
The average sold property price by year was:
| Year | Average Sold Price | Sold Properties |
|---|---|---|
| 2026 | £423,056.00 | 40 Properties |
| 2025 | £479,687.00 | 440 Properties |
| 2024 | £482,256.00 | 478 Properties |
| 2023 | £477,243.00 | 480 Properties |
| 2022 | £490,034.00 | 602 Properties |
| 2021 | £463,449.00 | 815 Properties |
| 2020 | £408,223.00 | 562 Properties |
| 2019 | £402,794.00 | 592 Properties |
| 2018 | £409,867.00 | 592 Properties |
| 2017 | £388,459.00 | 613 Properties |
| 2016 | £378,102.00 | 593 Properties |
| 2015 | £363,156.00 | 656 Properties |
| 2014 | £337,135.00 | 687 Properties |
| 2013 | £307,917.00 | 575 Properties |
| 2012 | £298,789.00 | 485 Properties |
| 2011 | £300,146.00 | 532 Properties |
| 2010 | £332,632.00 | 434 Properties |
| 2009 | £296,208.00 | 438 Properties |
| 2008 | £307,427.00 | 434 Properties |
| 2007 | £311,125.00 | 795 Properties |
| 2006 | £306,186.00 | 890 Properties |
| 2005 | £288,041.00 | 666 Properties |
| 2004 | £287,692.00 | 766 Properties |
| 2003 | £262,200.00 | 615 Properties |
| 2002 | £235,778.00 | 761 Properties |
| 2001 | £202,302.00 | 753 Properties |
| 2000 | £183,409.00 | 597 Properties |
| 1999 | £152,289.00 | 656 Properties |
| 1998 | £138,090.00 | 647 Properties |
| 1997 | £124,871.00 | 802 Properties |
| 1996 | £114,127.00 | 806 Properties |
| 1995 | £116,840.00 | 669 Properties |
Property Price per Property Type in B91
Here you can find historic sold price data in order to help with your property search.
The average Property Paid Price for specific property types in the last three years are:
| Property Type | Average Sold Price | Sold Properties |
|---|---|---|
| Semi Detached House | £455,228.00 | 330 Semi Detached Houses |
| Detached House | £742,578.00 | 540 Detached Houses |
| Terraced House | £350,593.00 | 103 Terraced Houses |
| Flat | £215,593.00 | 465 Flats |
Transport near B91

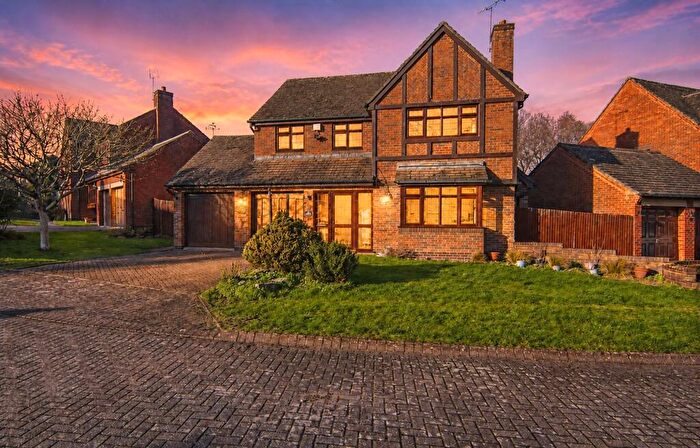
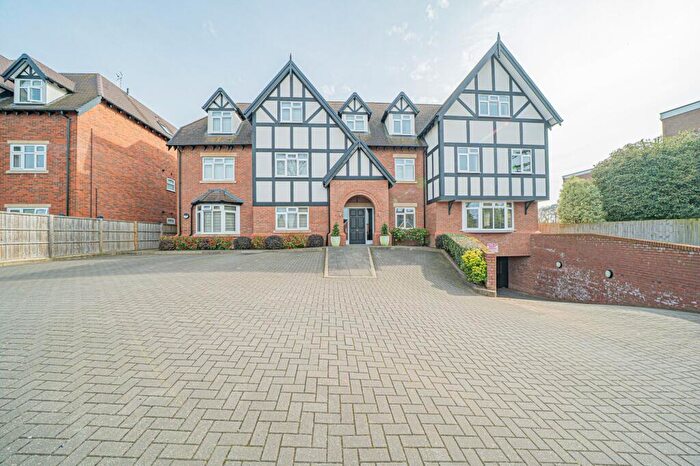
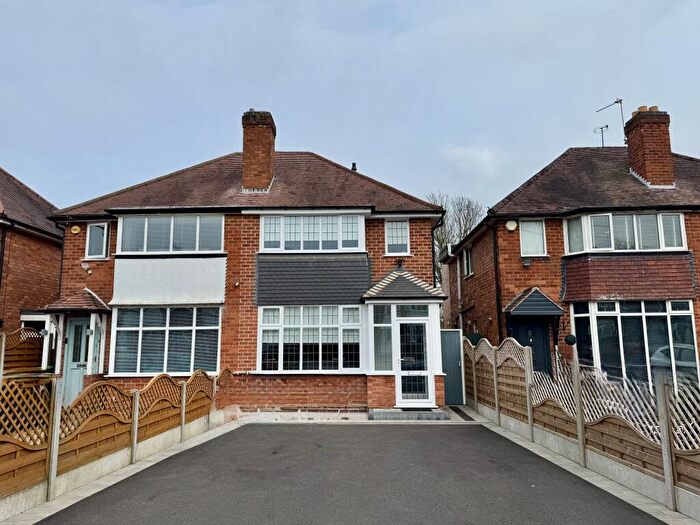
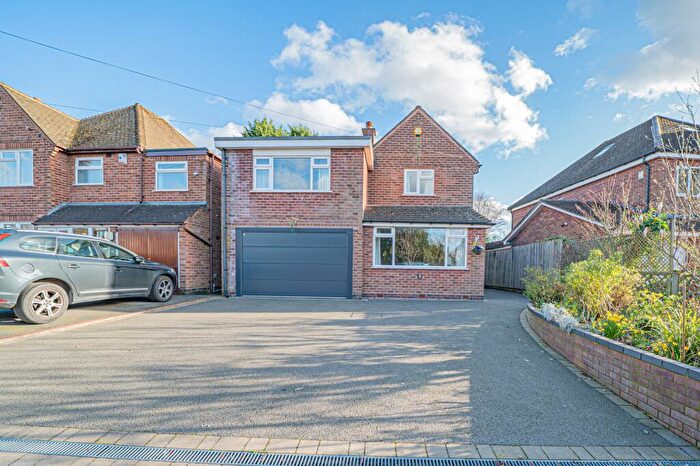
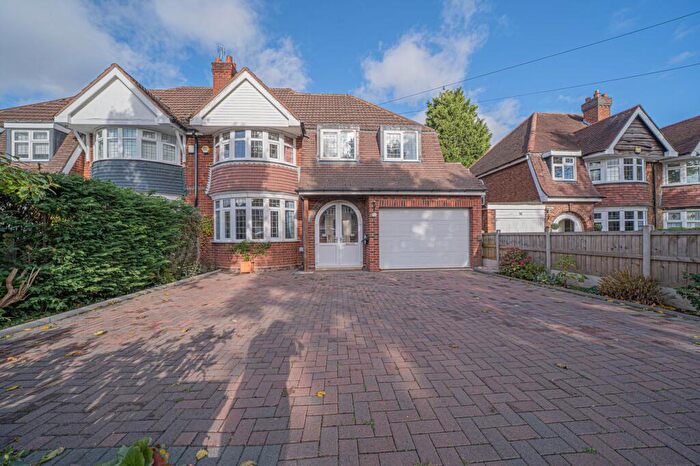
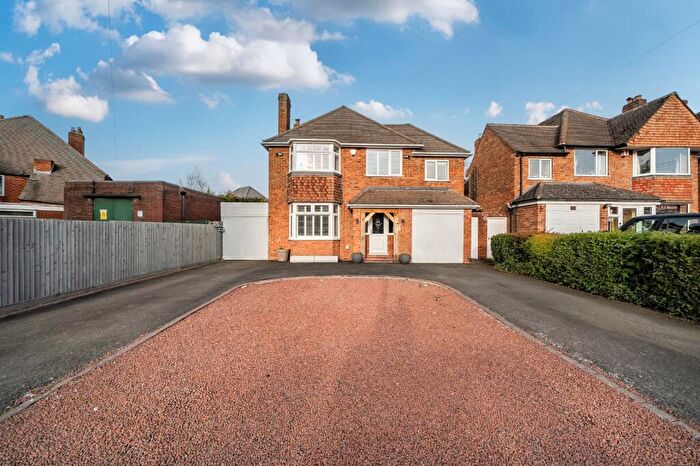
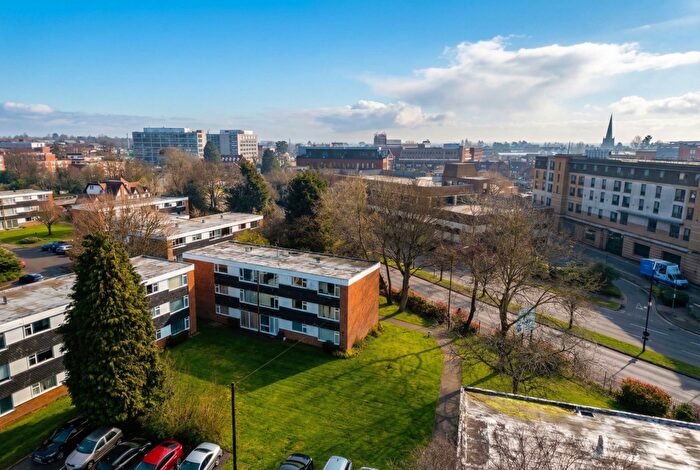
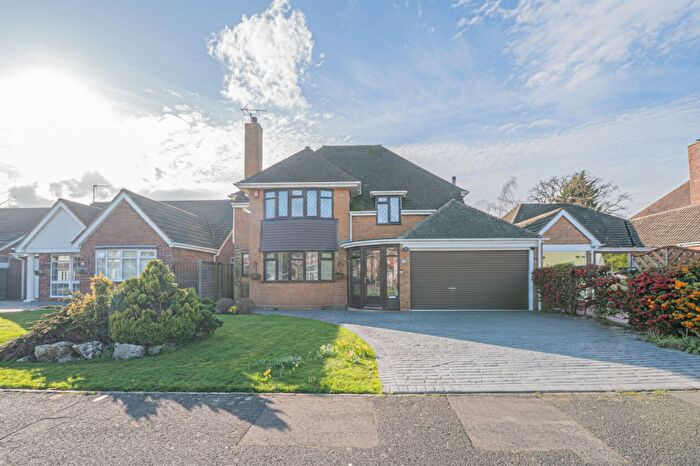
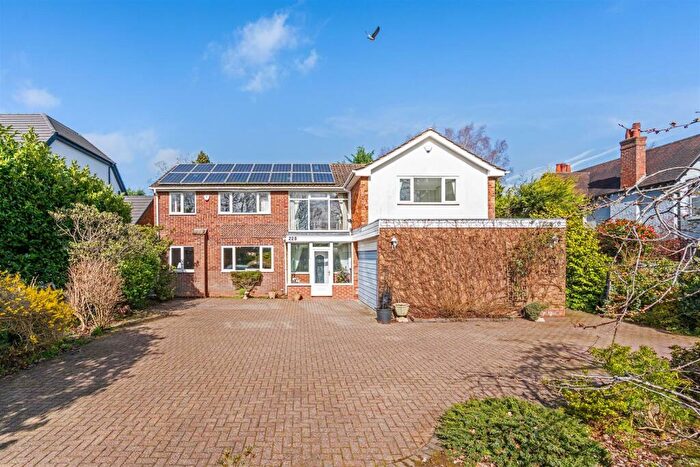
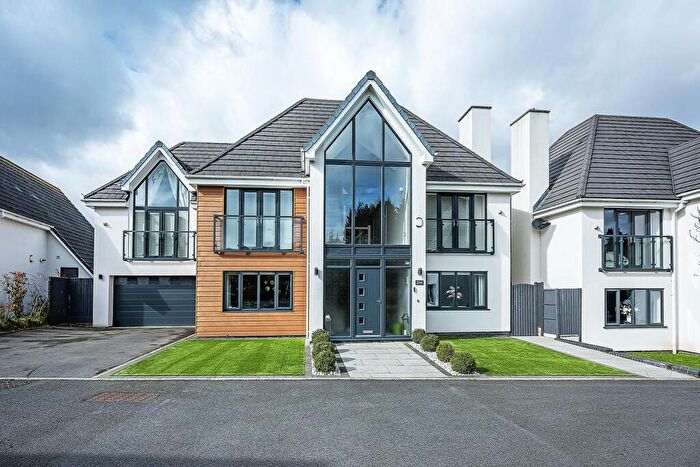
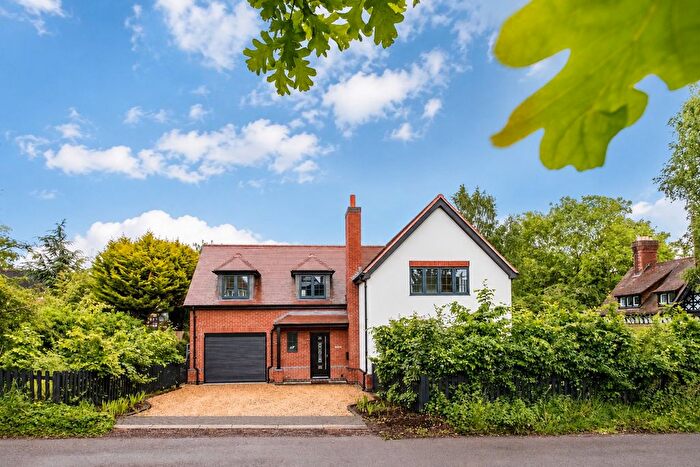
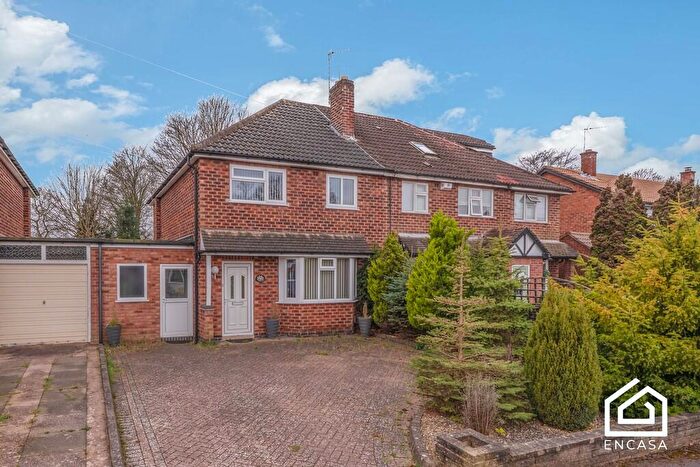
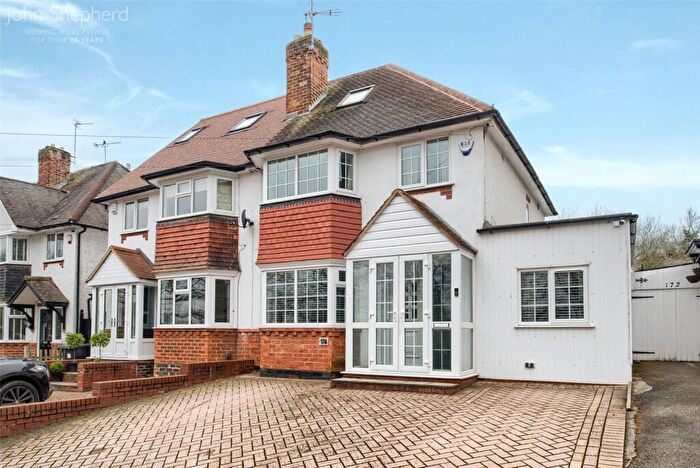
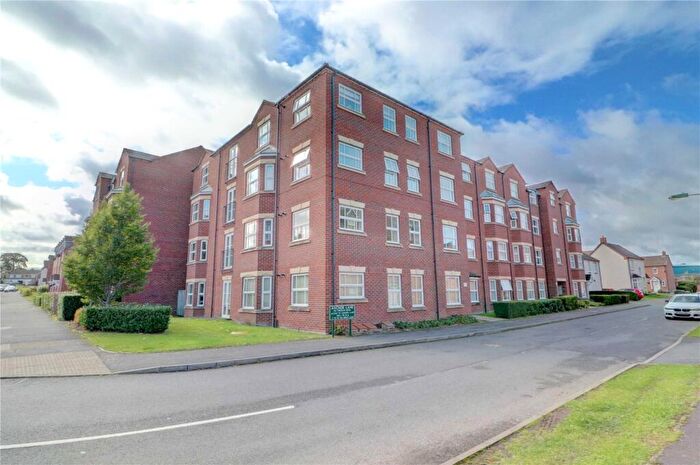
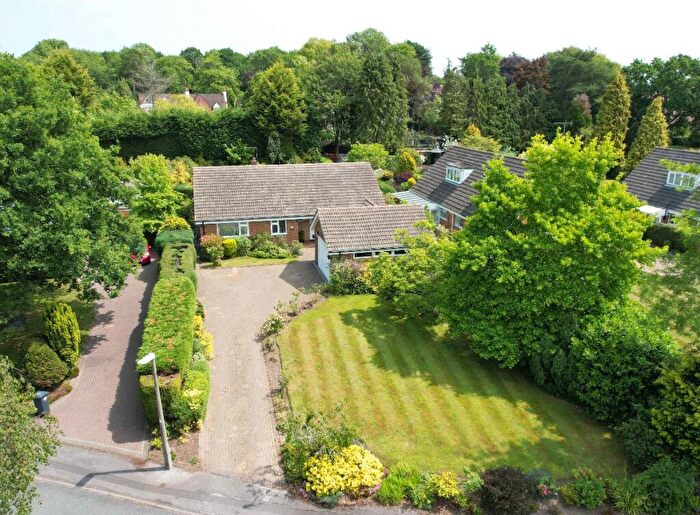
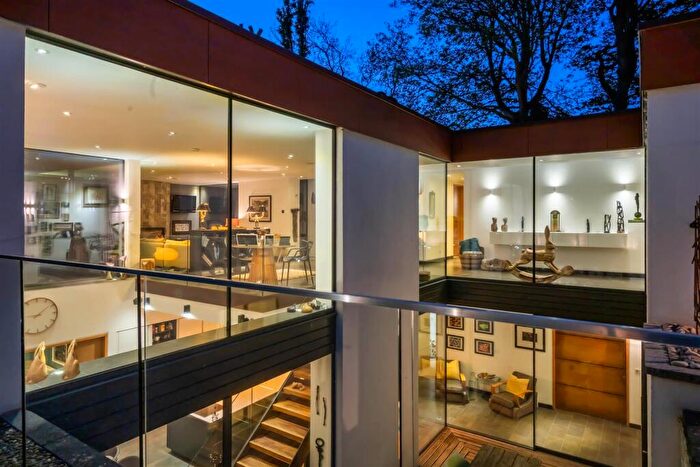
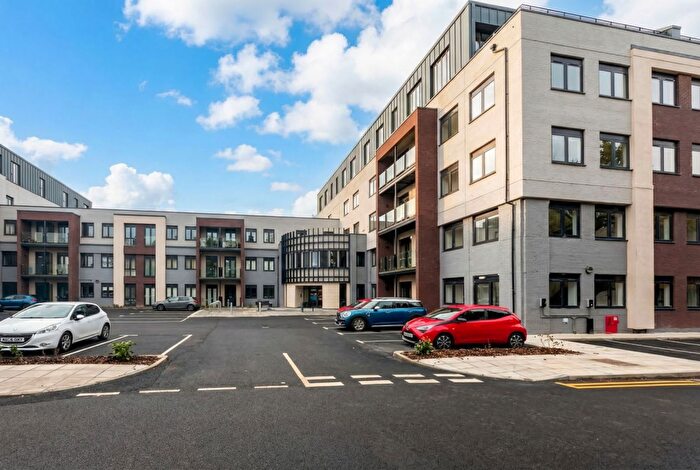
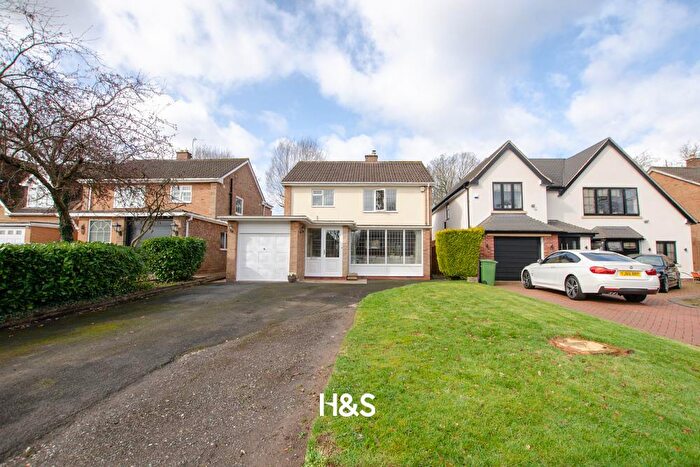
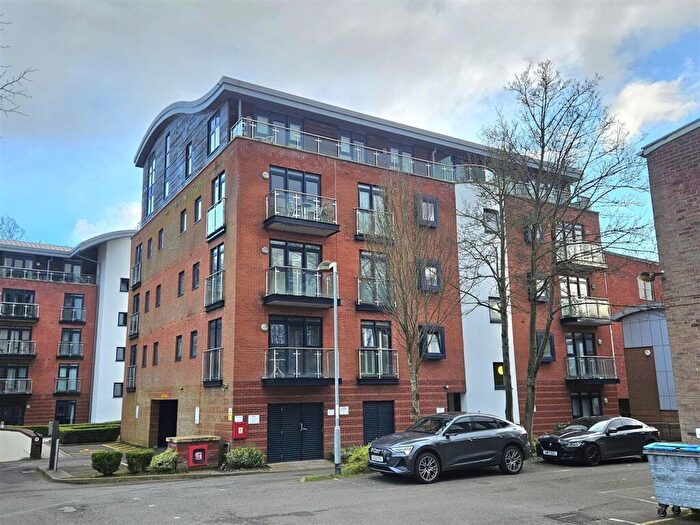
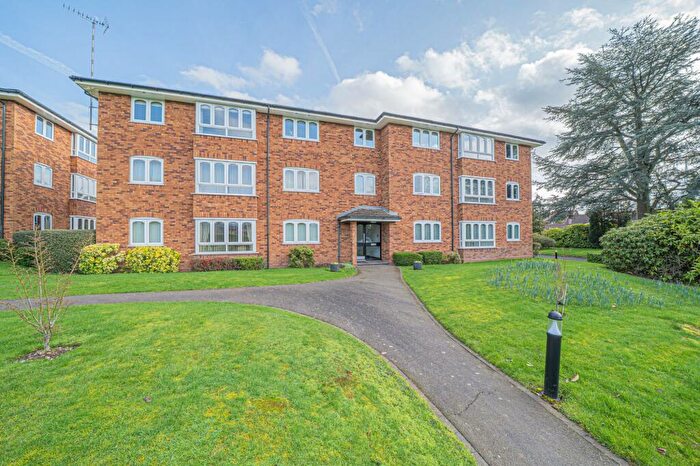
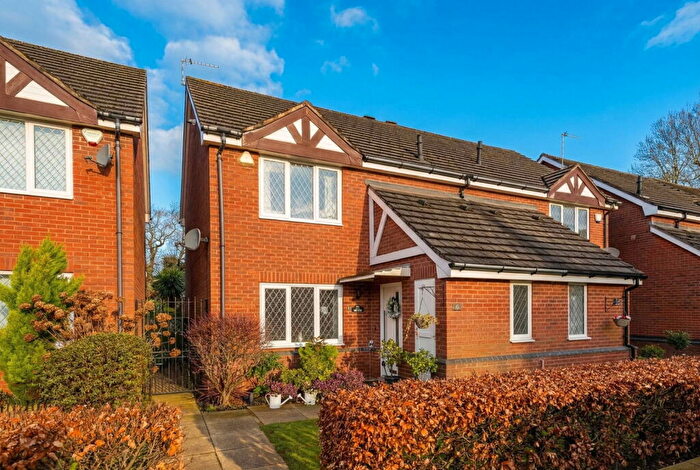
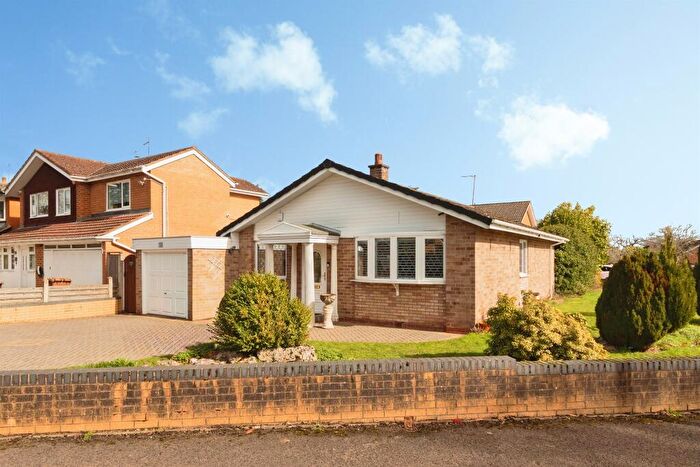
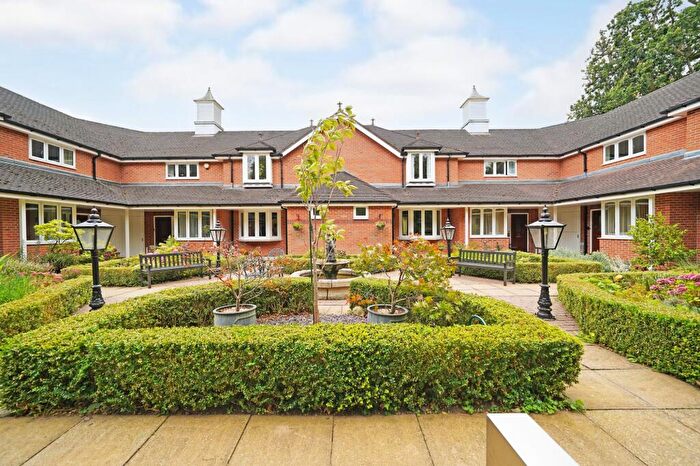
Houses and Flats for sale in B91, Olton, Solihull
![]()
If you are looking to sell your house, let it out, or receive a property valuation, an expert can help you.
Click the button below to get started.
Frequently Asked Questions about B91
What is the average price for a property for sale in B91?
The average price for a property for sale in B91 is £478,150. There are 291 property listings for sale in B91.
Which areas are included in the B91 postcode district?
The main areas within B91 include Olton and Solihull.
What are the most common property types in B91?
The most common property types in B91 are Detached Houses, Flats, Semi Detached Houses and Terraced Houses.
What has been the average sold property price in B91 over the last three years?
Detached Houses in B91 have an average sold price of £742,578, while Flats have an average of £215,593. Semi Detached Houses have an average of £455,228 and Terraced Houses have an average of £350,593. The average sold property price in B91 over the last three years is approximately £461,666.
Which train stations are available in B91?
The train stations available in B91 are Solihull Station and Widney Manor Station..