
Properties for sale in BN43
Shoreham-by-Sea
- Info
- Price Paid By Year
- Property Type Price
- Transport
House Prices in BN43
Properties in BN43 have an average house price of £448,178.00 and had 968 Property Transactions within the last 3 years.
The most expensive property was sold for £2,785,000.00.
Property Price Paid in BN43 by Year
The average sold property price by year was:
| Year | Average Sold Price | Sold Properties |
|---|---|---|
| 2026 | £397,216.00 | 6 Properties |
| 2025 | £448,193.00 | 256 Properties |
| 2024 | £435,876.00 | 385 Properties |
| 2023 | £463,873.00 | 321 Properties |
| 2022 | £480,758.00 | 393 Properties |
| 2021 | £423,742.00 | 518 Properties |
| 2020 | £414,733.00 | 337 Properties |
| 2019 | £366,183.00 | 428 Properties |
| 2018 | £374,307.00 | 411 Properties |
| 2017 | £361,773.00 | 457 Properties |
| 2016 | £369,780.00 | 471 Properties |
| 2015 | £325,505.00 | 466 Properties |
| 2014 | £303,443.00 | 486 Properties |
| 2013 | £258,807.00 | 456 Properties |
| 2012 | £263,372.00 | 420 Properties |
| 2011 | £253,177.00 | 420 Properties |
| 2010 | £257,067.00 | 337 Properties |
| 2009 | £228,205.00 | 317 Properties |
| 2008 | £228,264.00 | 313 Properties |
| 2007 | £244,454.00 | 660 Properties |
| 2006 | £217,399.00 | 733 Properties |
| 2005 | £215,681.00 | 626 Properties |
| 2004 | £201,510.00 | 496 Properties |
| 2003 | £179,921.00 | 493 Properties |
| 2002 | £161,617.00 | 574 Properties |
| 2001 | £132,455.00 | 567 Properties |
| 2000 | £118,053.00 | 481 Properties |
| 1999 | £99,390.00 | 521 Properties |
| 1998 | £81,701.00 | 486 Properties |
| 1997 | £72,099.00 | 474 Properties |
| 1996 | £65,175.00 | 462 Properties |
| 1995 | £65,265.00 | 434 Properties |
Property Price per Property Type in BN43
Here you can find historic sold price data in order to help with your property search.
The average Property Paid Price for specific property types in the last three years are:
| Property Type | Average Sold Price | Sold Properties |
|---|---|---|
| Semi Detached House | £485,979.00 | 294 Semi Detached Houses |
| Detached House | £708,174.00 | 164 Detached Houses |
| Terraced House | £408,463.00 | 269 Terraced Houses |
| Flat | £269,465.00 | 241 Flats |
Transport near BN43

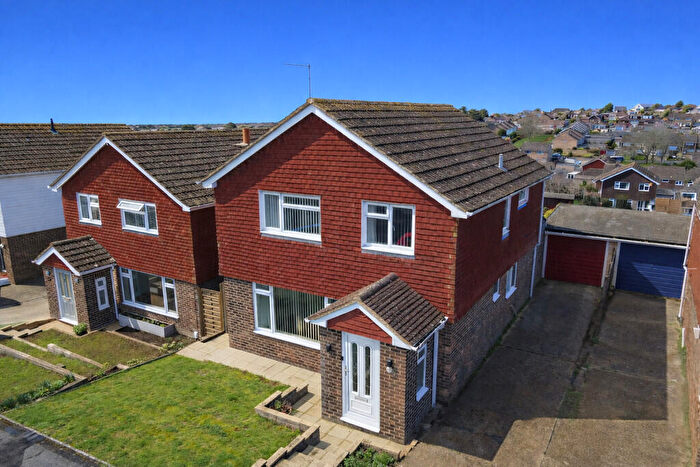
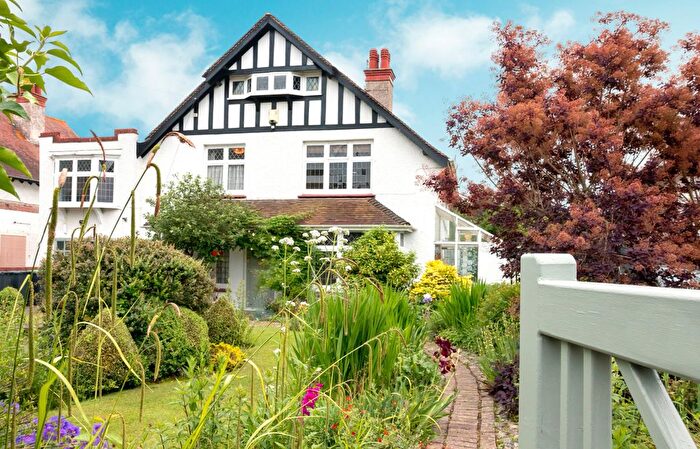
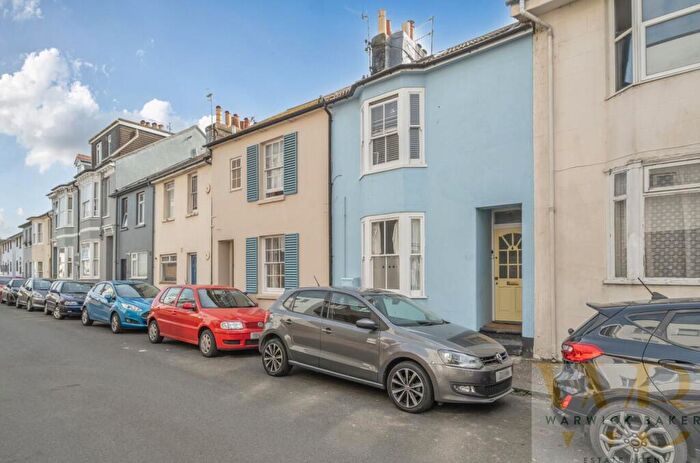
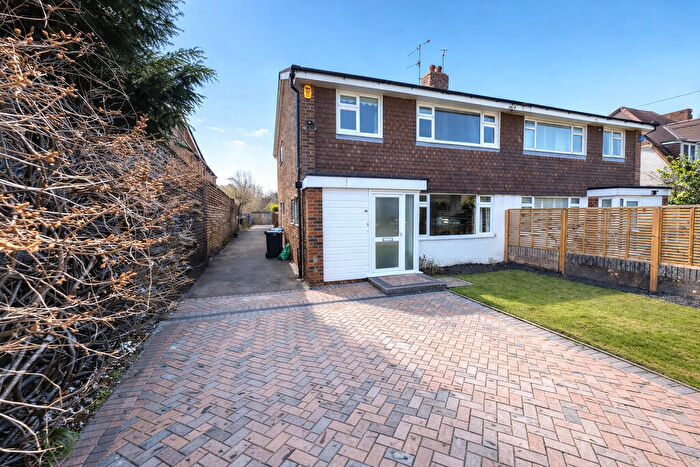
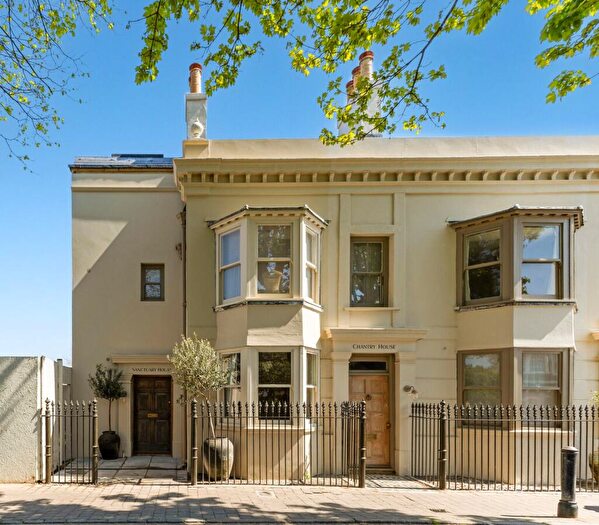
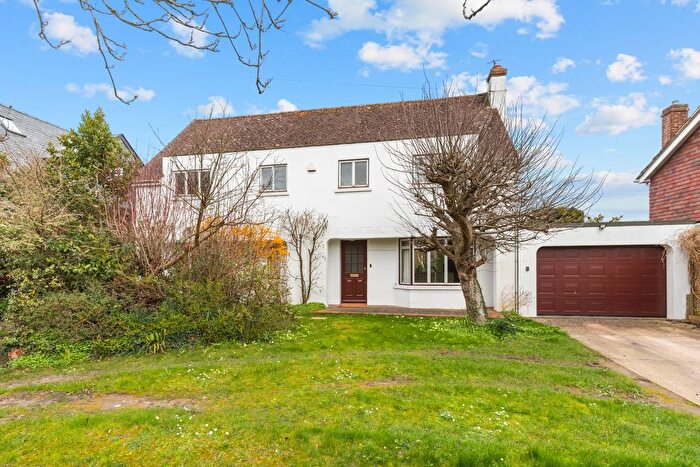
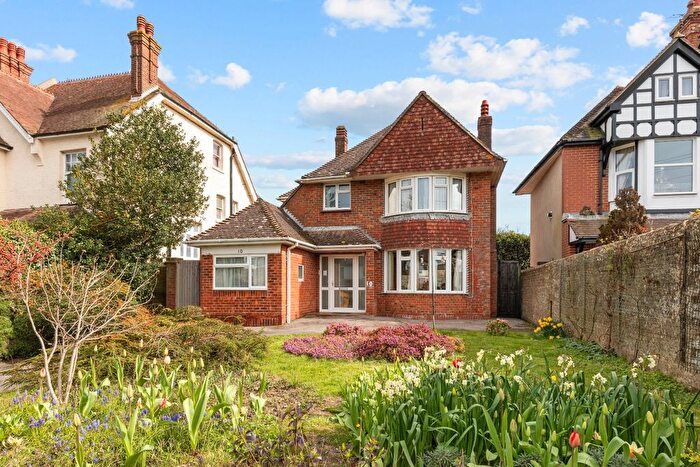
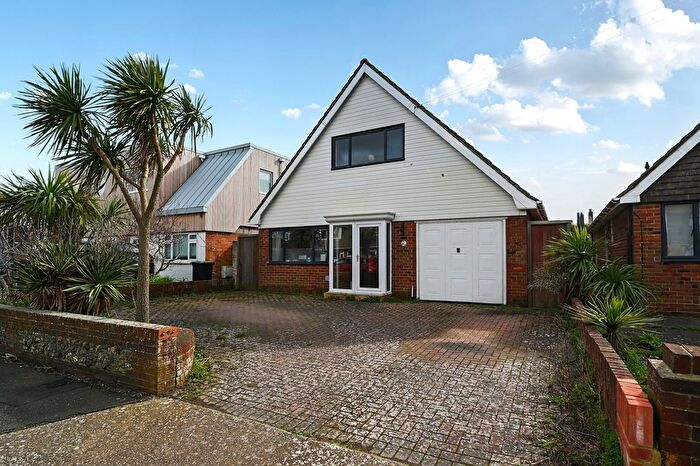
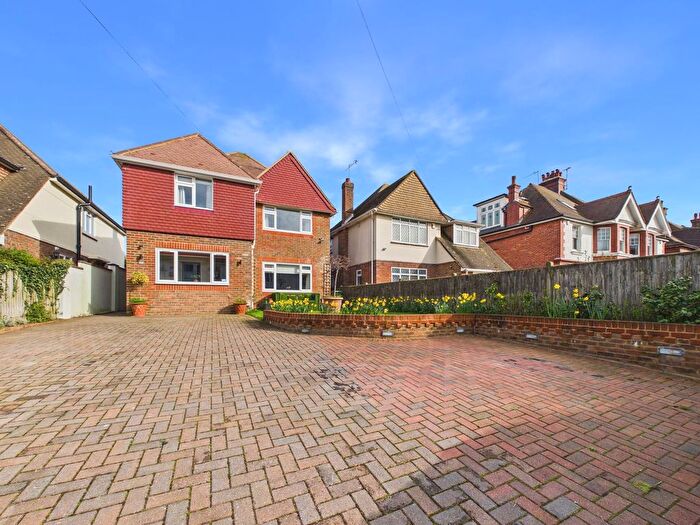
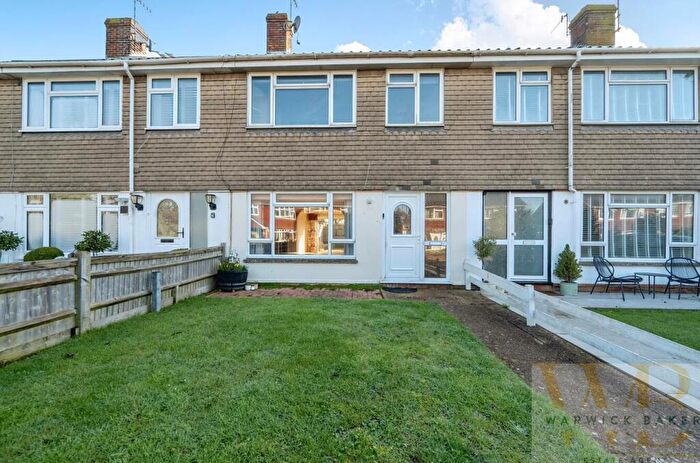
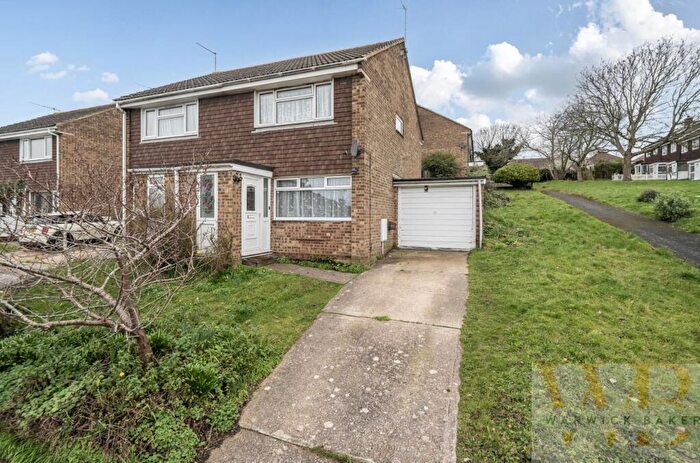
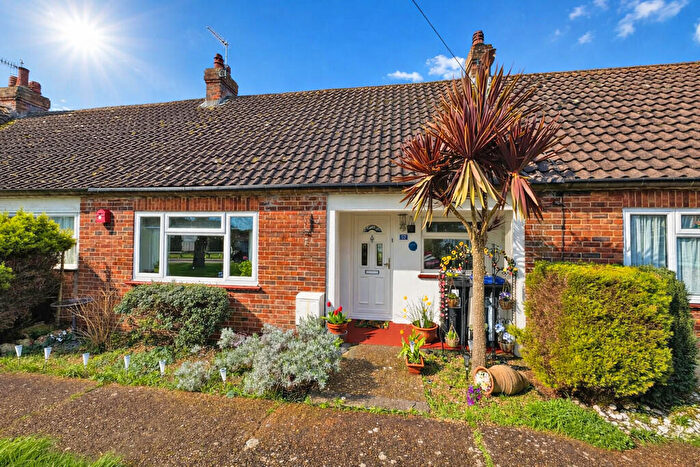
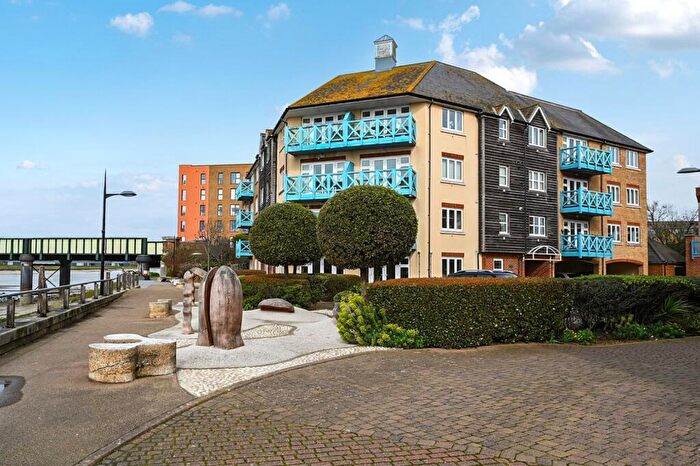
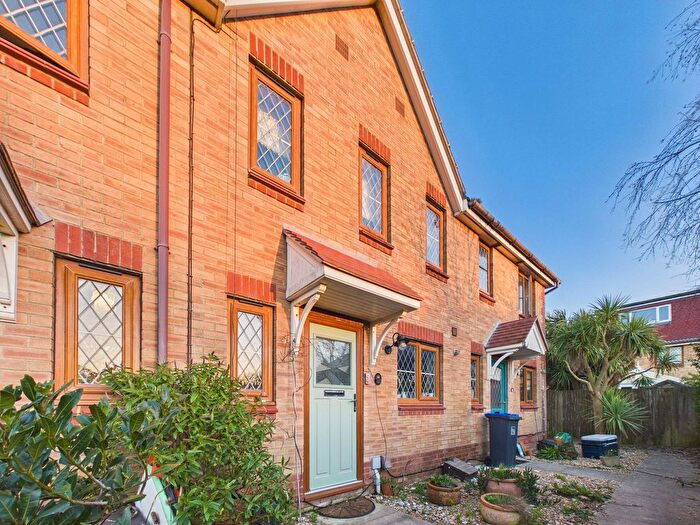
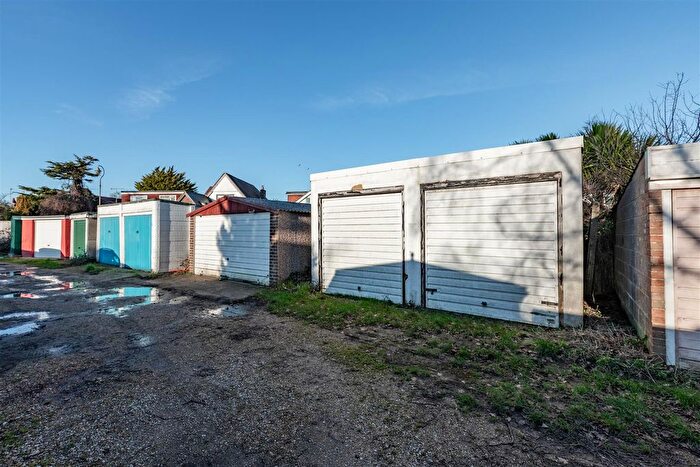
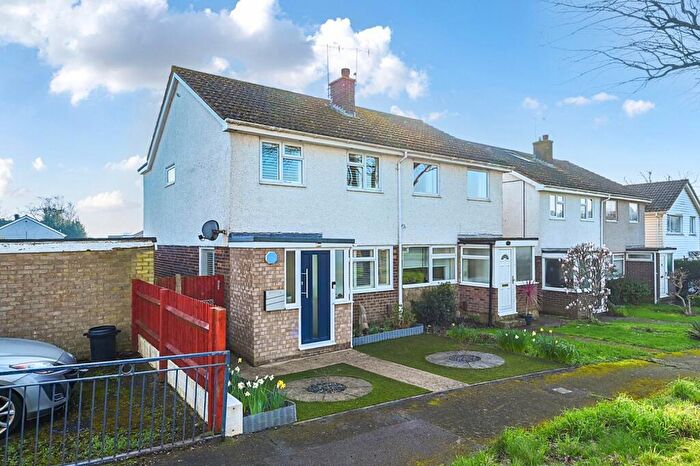
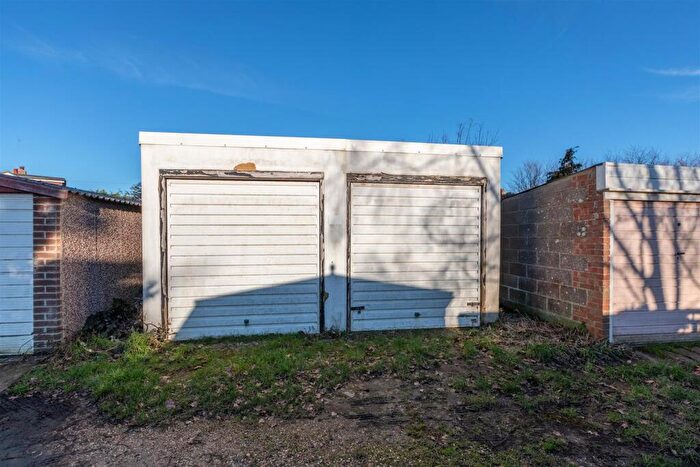
Houses and Flats for sale in BN43, Shoreham-by-Sea
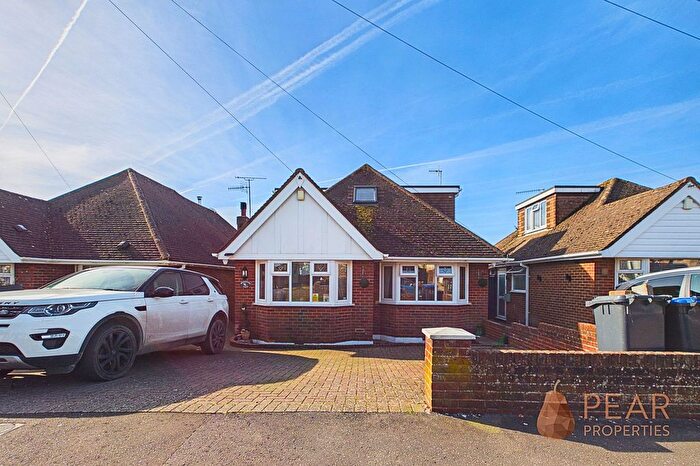
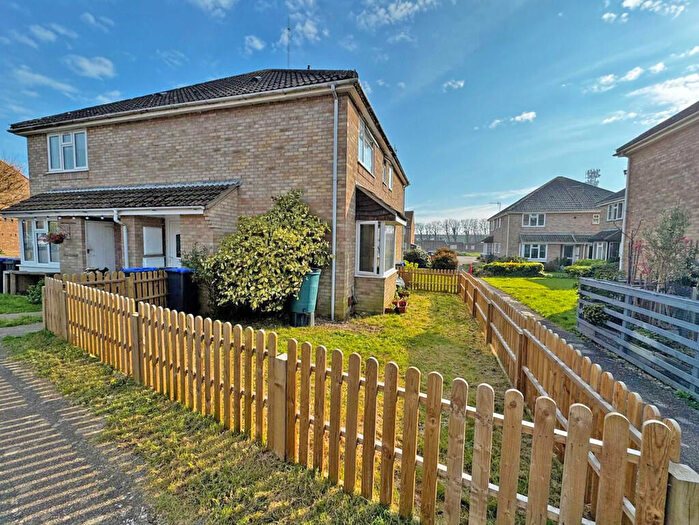
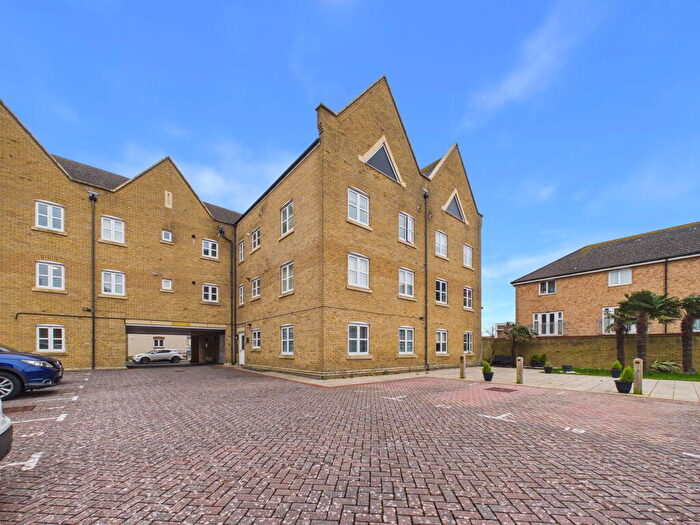
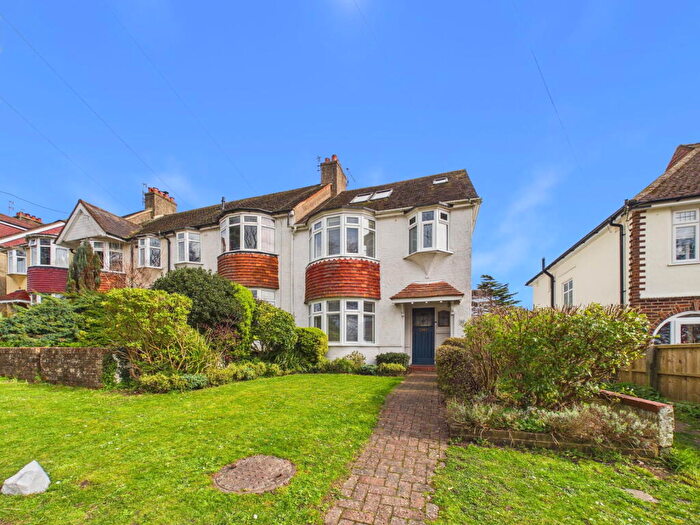
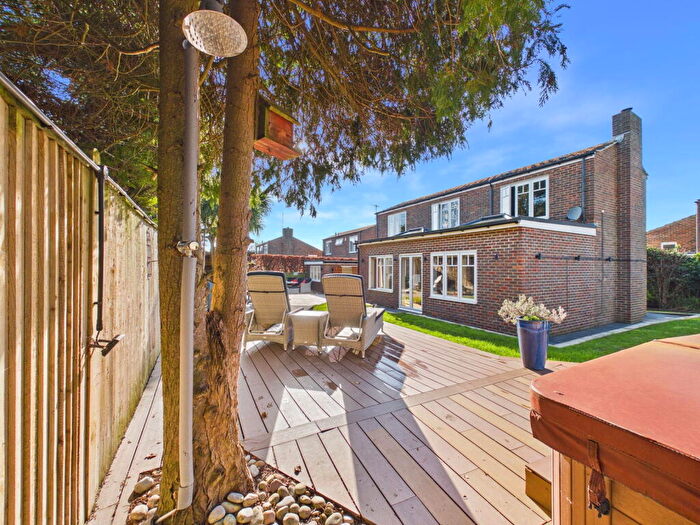
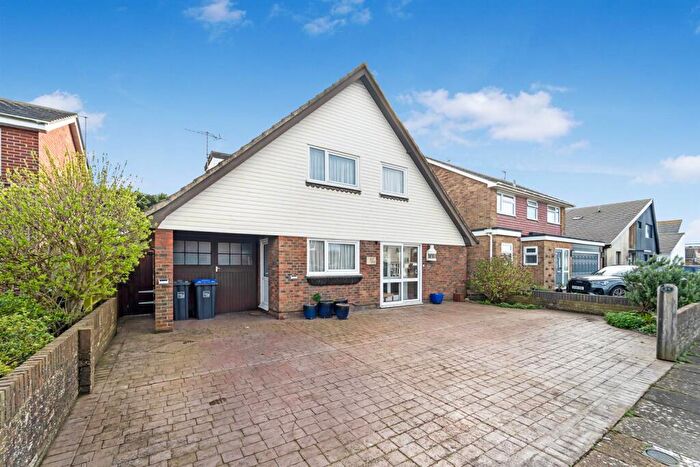
![]()
If you are looking to sell your house, let it out, or receive a property valuation, an expert can help you.
Click the button below to get started.

Frequently Asked Questions about BN43
What is the average price for a property for sale in BN43?
The average price for a property for sale in BN43 is £448,178. There are 184 property listings for sale in BN43.
Which areas are included in the BN43 postcode district?
The main area within BN43 is Shoreham-by-Sea.
What are the most common property types in BN43?
The most common property types in BN43 are Semi Detached Houses, Terraced Houses, Flats and Detached Houses.
What has been the average sold property price in BN43 over the last three years?
Semi Detached Houses in BN43 have an average sold price of £485,979, while Terraced Houses have an average of £408,463. Flats have an average of £269,465 and Detached Houses have an average of £708,174. The average sold property price in BN43 over the last three years is approximately £427,095.
Which train stations are available in BN43?
The train station available in BN43 is Shoreham-By-Sea Station..