
Properties for sale in CT5
Whitstable
- Info
- Price Paid By Year
- Property Type Price
- Transport
House Prices in CT5
Properties in CT5 have an average house price of £458,626.00 and had 1455 Property Transactions within the last 3 years.
The most expensive property was sold for £3,125,000.00.
Property Price Paid in CT5 by Year
The average sold property price by year was:
| Year | Average Sold Price | Sold Properties |
|---|---|---|
| 2026 | £430,344.00 | 39 Properties |
| 2025 | £437,975.00 | 465 Properties |
| 2024 | £478,936.00 | 521 Properties |
| 2023 | £458,915.00 | 430 Properties |
| 2022 | £475,107.00 | 550 Properties |
| 2021 | £428,989.00 | 895 Properties |
| 2020 | £413,887.00 | 613 Properties |
| 2019 | £391,073.00 | 588 Properties |
| 2018 | £381,973.00 | 584 Properties |
| 2017 | £367,557.00 | 616 Properties |
| 2016 | £344,601.00 | 679 Properties |
| 2015 | £307,248.00 | 826 Properties |
| 2014 | £280,165.00 | 909 Properties |
| 2013 | £256,210.00 | 756 Properties |
| 2012 | £246,862.00 | 677 Properties |
| 2011 | £240,131.00 | 648 Properties |
| 2010 | £256,650.00 | 562 Properties |
| 2009 | £222,230.00 | 590 Properties |
| 2008 | £238,235.00 | 444 Properties |
| 2007 | £233,778.00 | 1,067 Properties |
| 2006 | £215,347.00 | 999 Properties |
| 2005 | £208,804.00 | 729 Properties |
| 2004 | £200,529.00 | 1,003 Properties |
| 2003 | £176,919.00 | 817 Properties |
| 2002 | £152,513.00 | 977 Properties |
| 2001 | £127,970.00 | 783 Properties |
| 2000 | £111,206.00 | 696 Properties |
| 1999 | £90,983.00 | 679 Properties |
| 1998 | £75,851.00 | 640 Properties |
| 1997 | £68,818.00 | 748 Properties |
| 1996 | £63,017.00 | 667 Properties |
| 1995 | £61,647.00 | 560 Properties |
Property Price per Property Type in CT5
Here you can find historic sold price data in order to help with your property search.
The average Property Paid Price for specific property types in the last three years are:
| Property Type | Average Sold Price | Sold Properties |
|---|---|---|
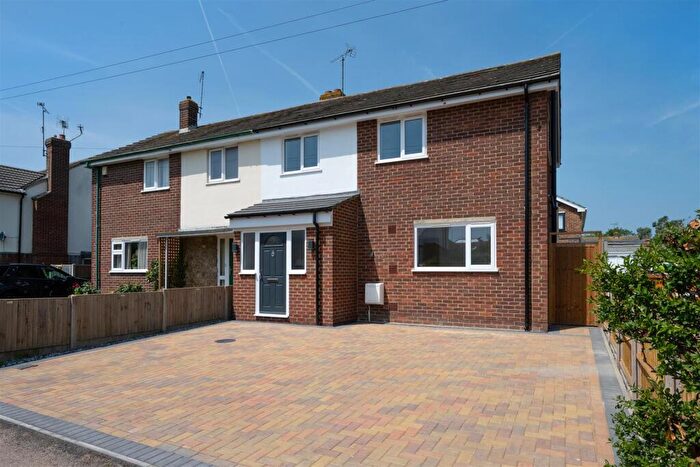
| Semi Detached House | £400,372.00 | 447 Semi Detached Houses |
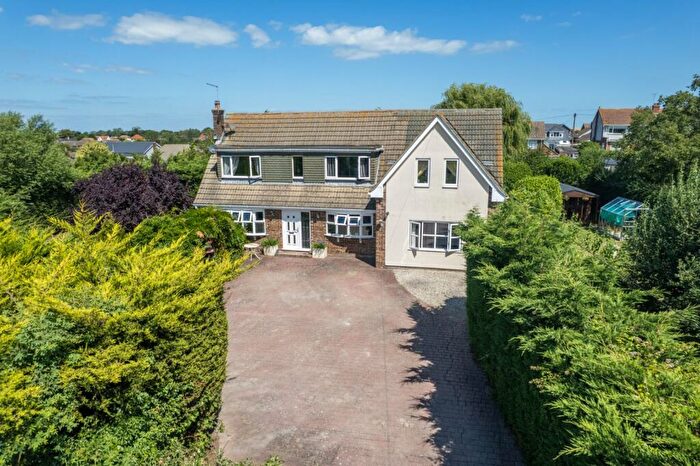
| Detached House | £603,216.00 | 550 Detached Houses |
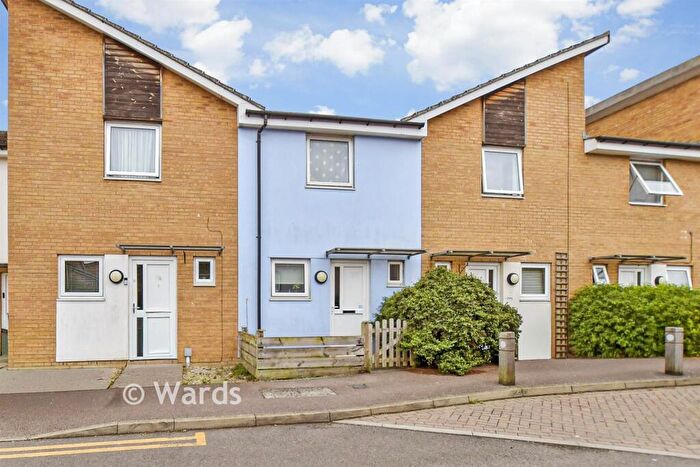
| Terraced House | £408,120.00 | 253 Terraced Houses |
| Flat | £260,055.00 | 205 Flats |
Transport near CT5

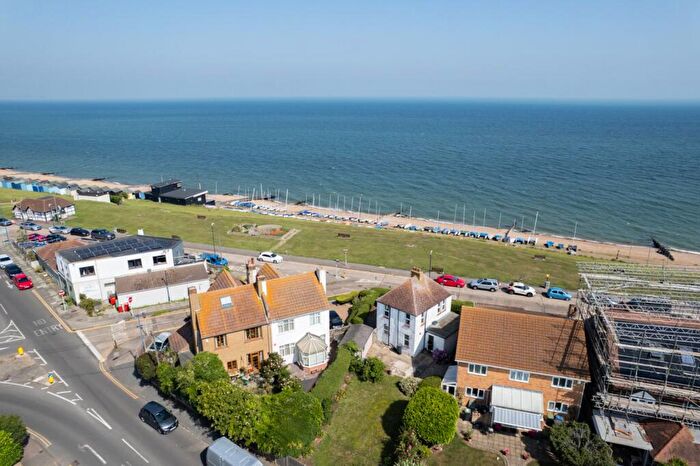
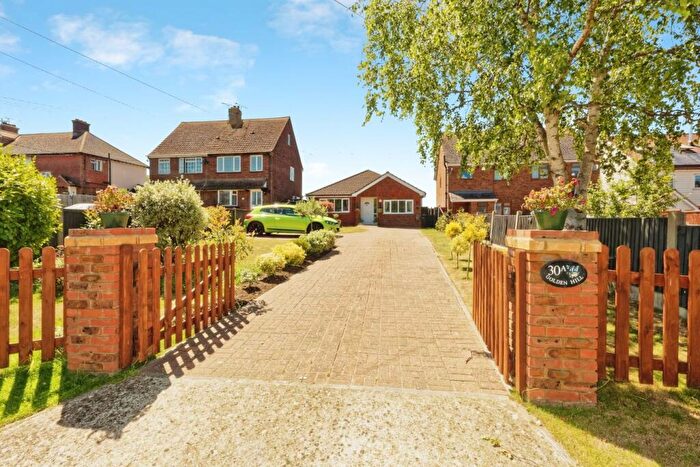
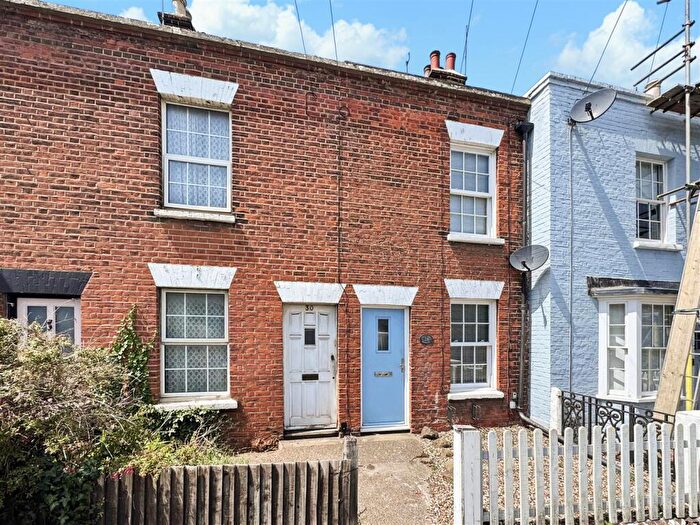
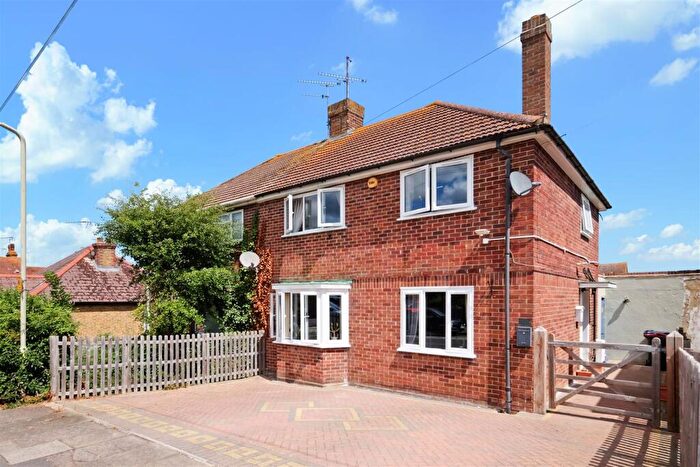
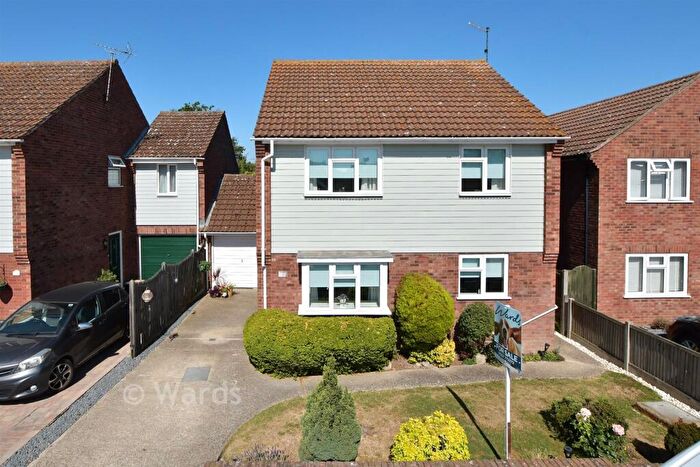
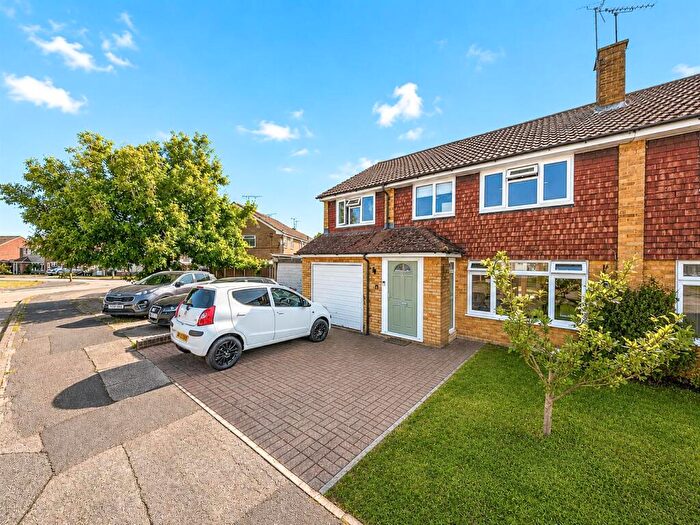
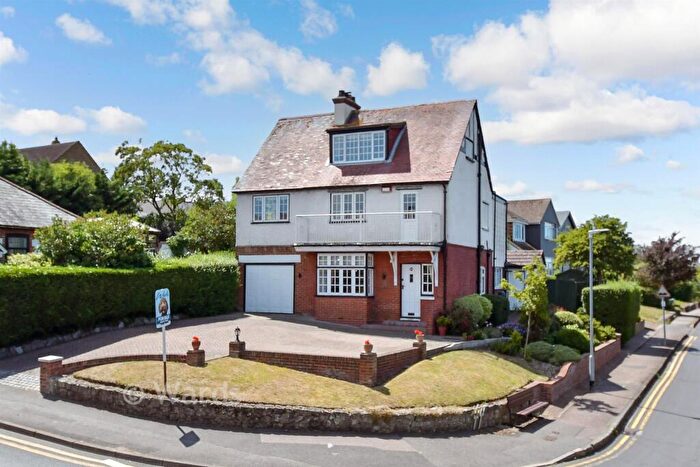
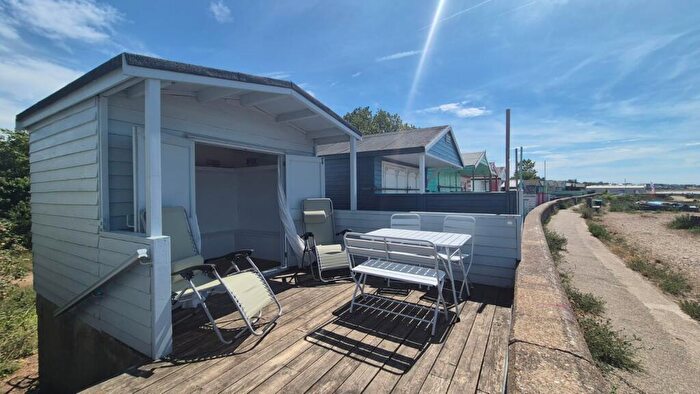
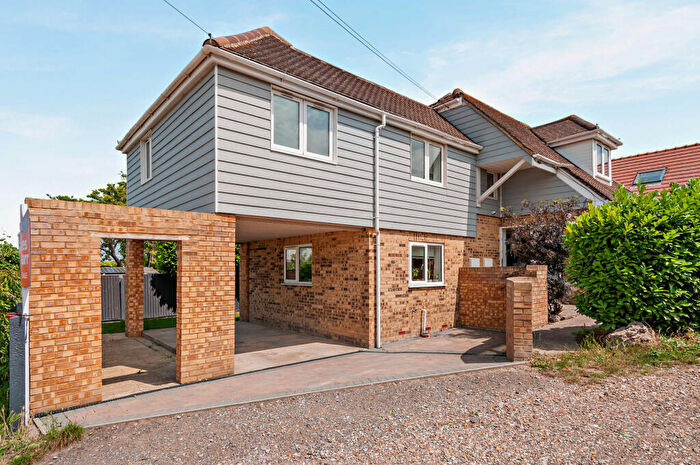
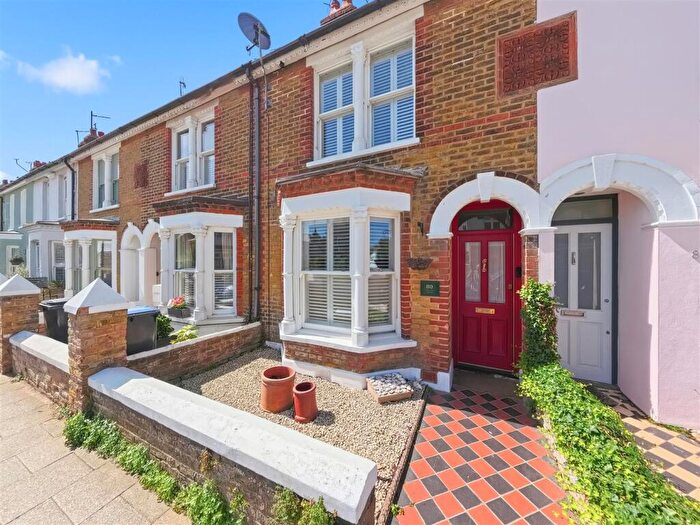
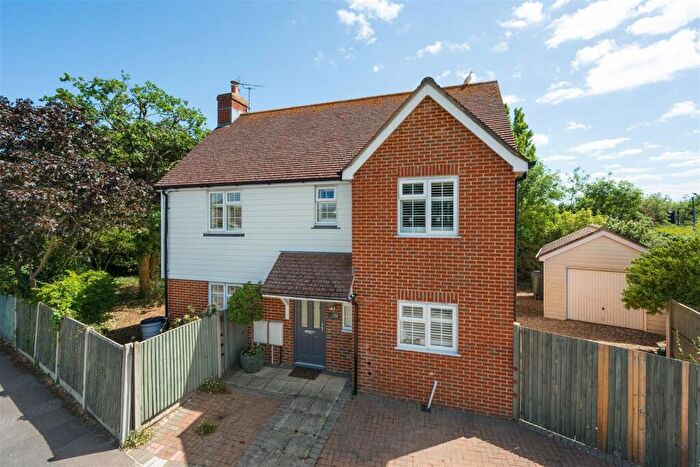
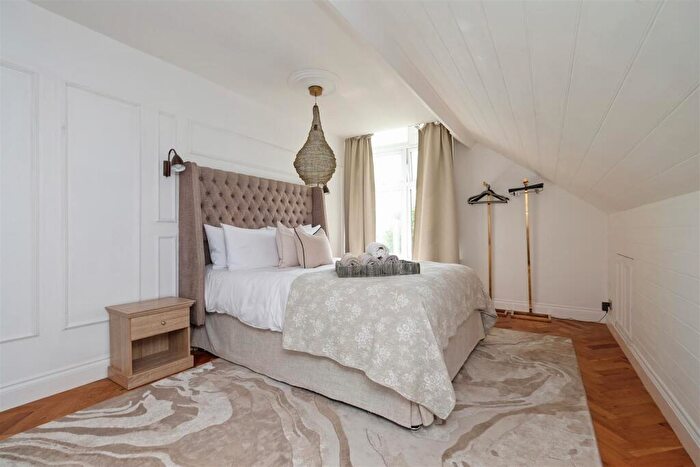
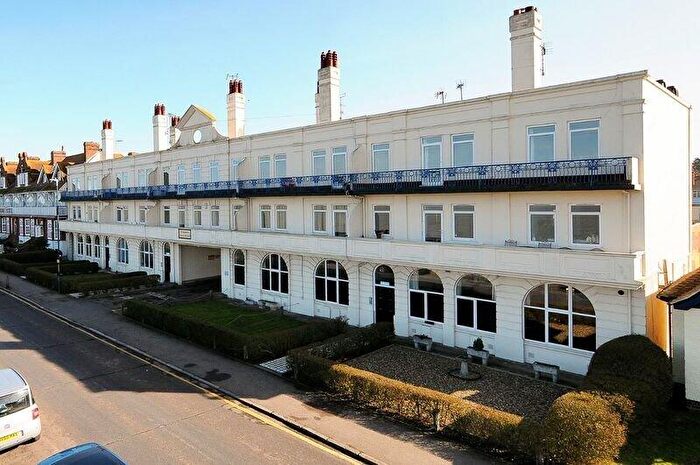
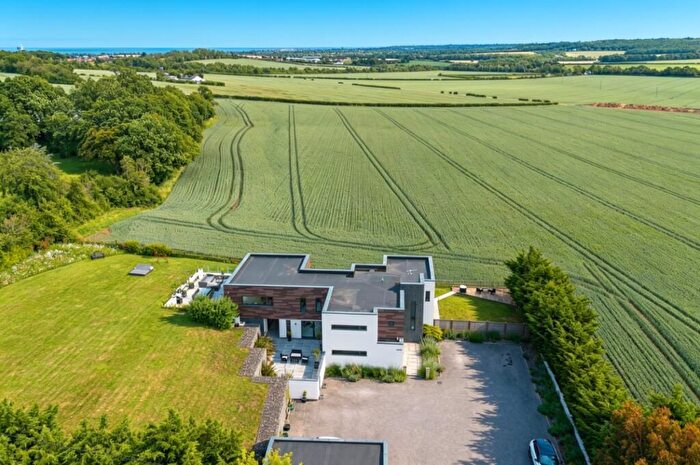
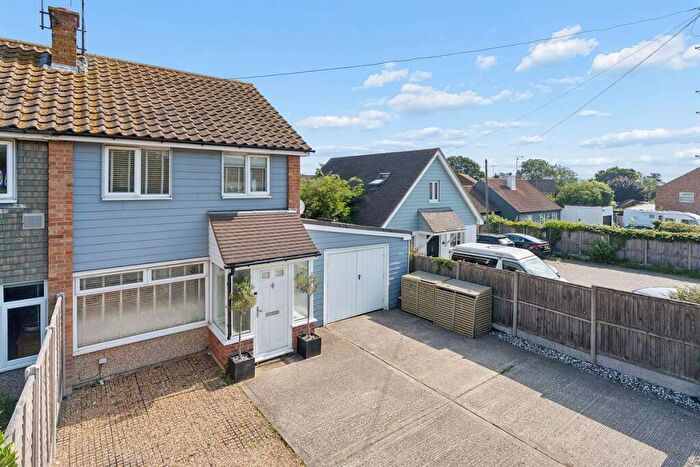
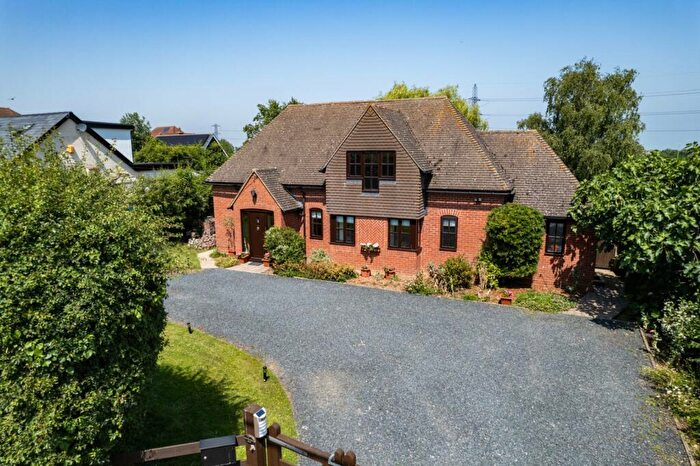
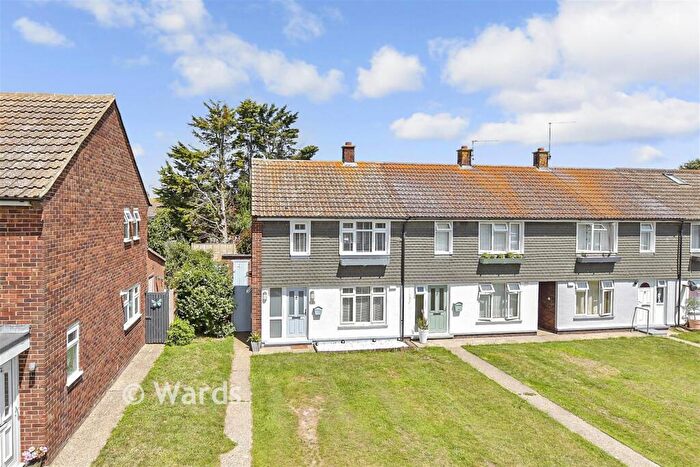
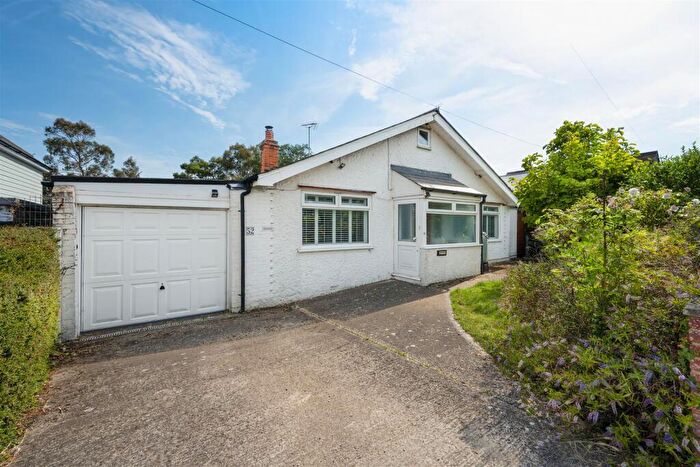
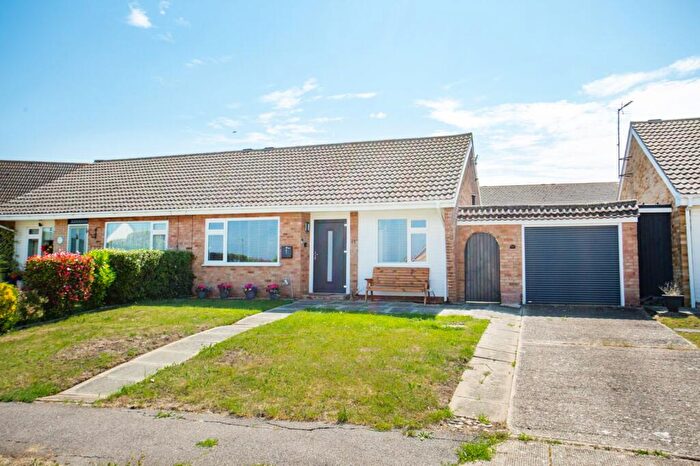
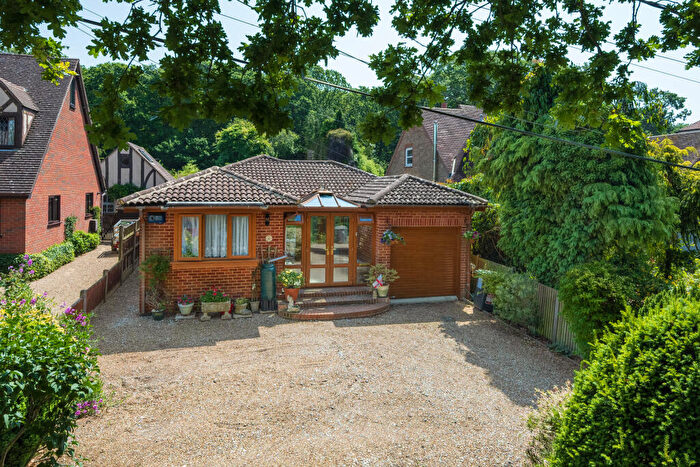
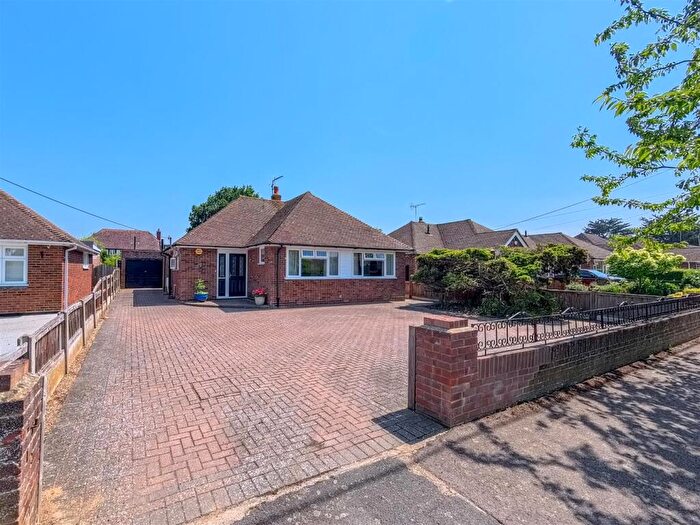
Houses and Flats for sale in CT5, Whitstable
There are 272 results. Property prices in CT5 range from £20k to £2.75M with an average price of £456k.
![]()
If you are looking to sell your house, let it out, or receive a property valuation, an expert can help you.
Click the button below to get started.
Frequently Asked Questions about CT5
What is the average price for a property for sale in CT5?
The average price for a property for sale in CT5 is £458,626. There are 272 property listings for sale in CT5.
Which areas are included in the CT5 postcode district?
The main area within CT5 is Whitstable.
What are the most common property types in CT5?
The most common property types in CT5 are Detached Houses, Semi Detached Houses, Terraced Houses and Flats.
What has been the average sold property price in CT5 over the last three years?
Detached Houses in CT5 have an average sold price of £603,216, while Semi Detached Houses have an average of £400,372. Terraced Houses have an average of £408,120 and Flats have an average of £260,055. The average sold property price in CT5 over the last three years is approximately £449,085.
Which train stations are available in CT5?
The train stations available in CT5 are Chestfield and Swalecliffe Station and Whitstable Station..