
Properties for sale in G1
Merchant City
- Info
- Price Paid By Year
- Transport
House Prices in G1
Properties in G1 have an average house price of £165,596.00 and had 58 Property Transactions within the last 3 years.
The most expensive property was sold for £300,000.00.
Property Price Paid in G1 by Year
Loading ...
The average sold property price by year was:
| Year | Average Sold Price | Sold Properties |
|---|---|---|
| 2026 | £182,047.00 | 2 Properties |
| 2025 | £146,525.00 | 2 Properties |
| 2024 | £196,250.00 | 2 Properties |
| 2023 | £164,517.00 | 52 Properties |
| 2022 | £183,218.00 | 247 Properties |
| 2021 | £177,790.00 | 315 Properties |
| 2020 | £182,324.00 | 160 Properties |
| 2019 | £170,670.00 | 253 Properties |
| 2018 | £174,918.00 | 255 Properties |
| 2017 | £174,483.00 | 244 Properties |
| 2016 | £154,706.00 | 303 Properties |
| 2015 | £156,261.00 | 252 Properties |
| 2014 | £125,486.00 | 395 Properties |
| 2013 | £109,047.00 | 326 Properties |
| 2012 | £137,057.00 | 166 Properties |
| 2011 | £172,493.00 | 161 Properties |
| 2010 | £184,218.00 | 263 Properties |
| 2009 | £430,466.00 | 332 Properties |
| 2008 | £270,517.00 | 350 Properties |
| 2007 | £246,282.00 | 517 Properties |
| 2006 | £263,557.00 | 431 Properties |
| 2005 | £260,168.00 | 349 Properties |
| 2004 | £142,224.00 | 497 Properties |
| 2003 | £180,807.00 | 353 Properties |
| 2002 | £429,281.00 | 295 Properties |
| 2001 | £301,270.00 | 17 Properties |

Houses and Flats for sale in G1, Merchant City

There are 84 results. Property prices in G1 range from £21k to £290k with an average price of £144k.
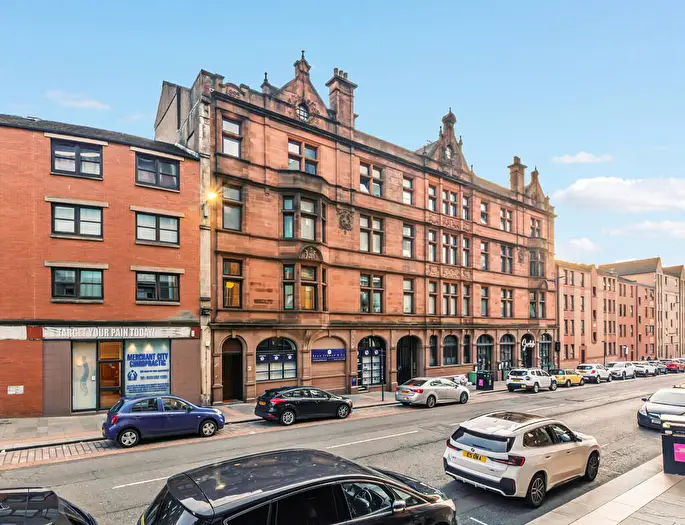

 1 Bedroom
 1 Bathroom


If you are looking to sell your house, let it out, or receive a property valuation, an expert can help you.
Click the button below to get started.


