
Properties for sale in GL56
Moreton-in-Marsh
- Info
- Price Paid By Year
- Property Type Price
- Transport
House Prices in GL56
Properties in GL56 have an average house price of £563,054.00 and had 506 Property Transactions within the last 3 years.
The most expensive property was sold for £7,950,000.00.
Property Price Paid in GL56 by Year
The average sold property price by year was:
| Year | Average Sold Price | Sold Properties |
|---|---|---|
| 2025 | £568,783.00 | 156 Properties |
| 2024 | £590,534.00 | 177 Properties |
| 2023 | £529,774.00 | 173 Properties |
| 2022 | £577,874.00 | 216 Properties |
| 2021 | £472,777.00 | 252 Properties |
| 2020 | £510,732.00 | 204 Properties |
| 2019 | £407,039.00 | 198 Properties |
| 2018 | £376,935.00 | 239 Properties |
| 2017 | £401,261.00 | 277 Properties |
| 2016 | £372,626.00 | 231 Properties |
| 2015 | £342,997.00 | 239 Properties |
| 2014 | £353,620.00 | 286 Properties |
| 2013 | £326,296.00 | 190 Properties |
| 2012 | £342,746.00 | 172 Properties |
| 2011 | £383,335.00 | 157 Properties |
| 2010 | £351,613.00 | 165 Properties |
| 2009 | £302,882.00 | 186 Properties |
| 2008 | £305,457.00 | 155 Properties |
| 2007 | £312,385.00 | 184 Properties |
| 2006 | £331,397.00 | 252 Properties |
| 2005 | £290,710.00 | 228 Properties |
| 2004 | £268,578.00 | 233 Properties |
| 2003 | £274,893.00 | 195 Properties |
| 2002 | £239,283.00 | 225 Properties |
| 2001 | £188,353.00 | 195 Properties |
| 2000 | £176,606.00 | 189 Properties |
| 1999 | £171,324.00 | 186 Properties |
| 1998 | £145,472.00 | 158 Properties |
| 1997 | £122,468.00 | 229 Properties |
| 1996 | £101,088.00 | 198 Properties |
| 1995 | £113,548.00 | 190 Properties |
Property Price per Property Type in GL56
Here you can find historic sold price data in order to help with your property search.
The average Property Paid Price for specific property types in the last three years are:
| Property Type | Average Sold Price | Sold Properties |
|---|---|---|
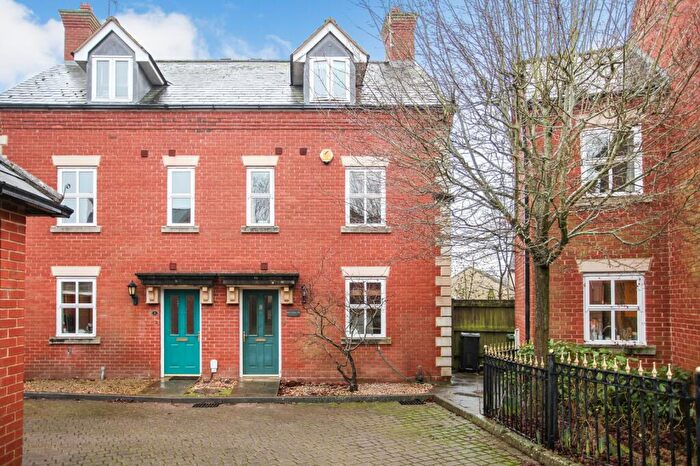
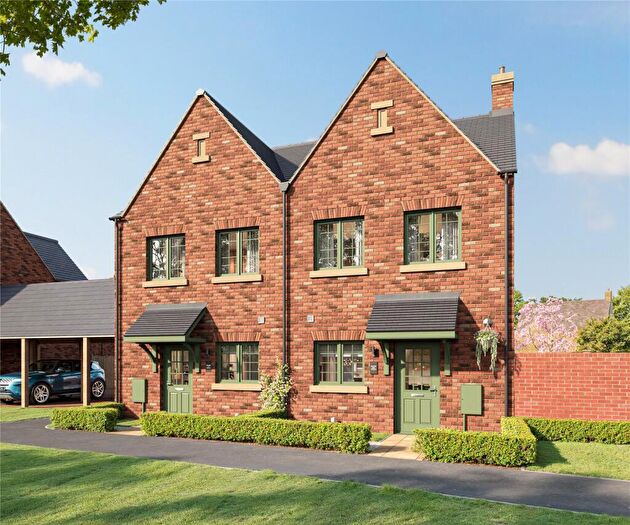
| Semi Detached House | £444,134.00 | 148 Semi Detached Houses |
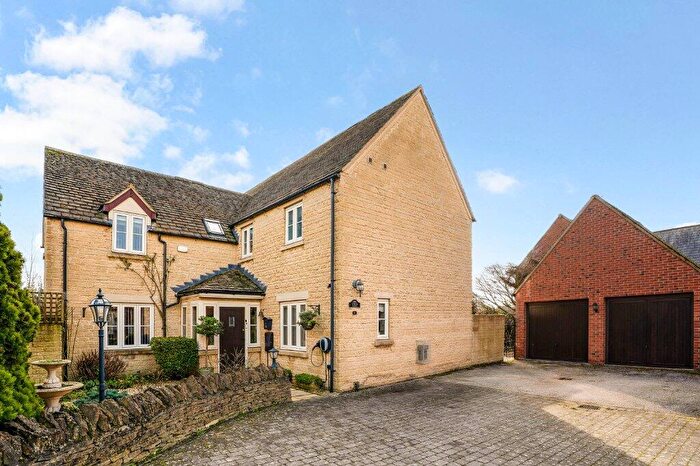
| Detached House | £902,189.00 | 170 Detached Houses |
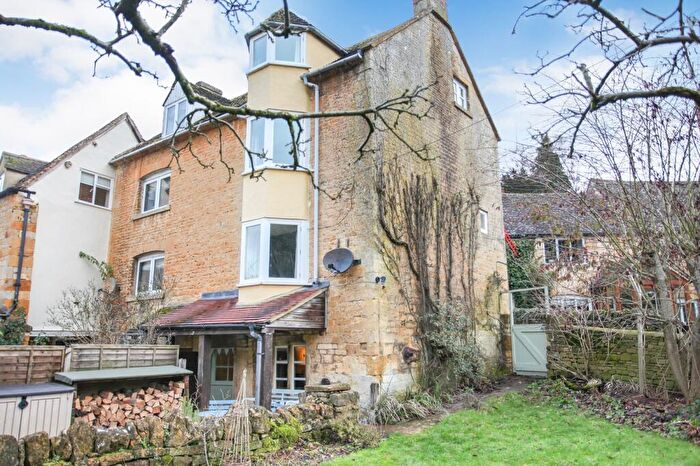
| Terraced House | £400,215.00 | 135 Terraced Houses |
| Flat | £222,124.00 | 53 Flats |
Transport near GL56

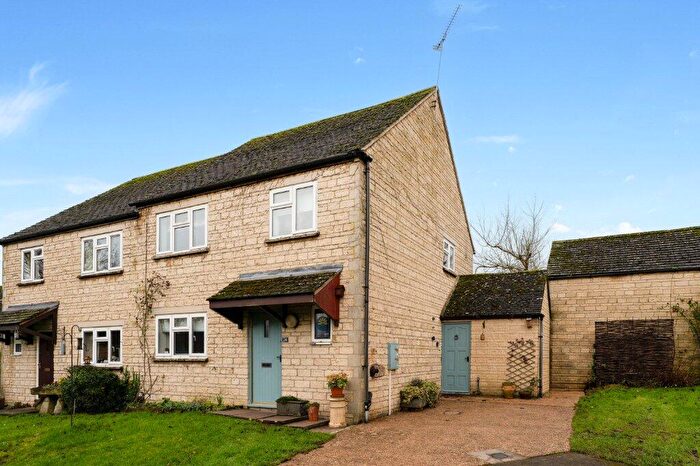
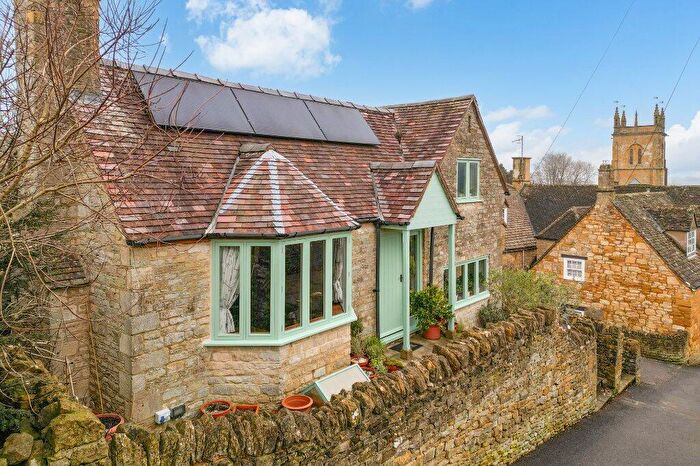
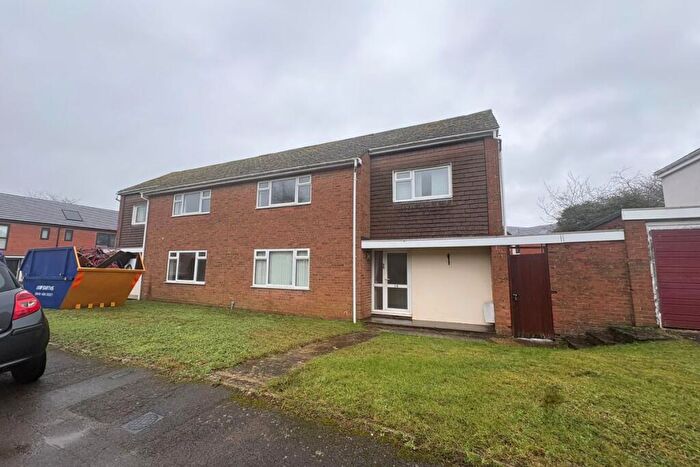
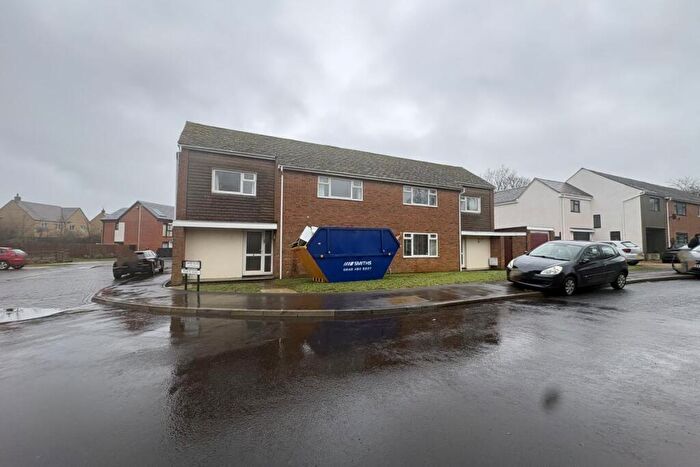
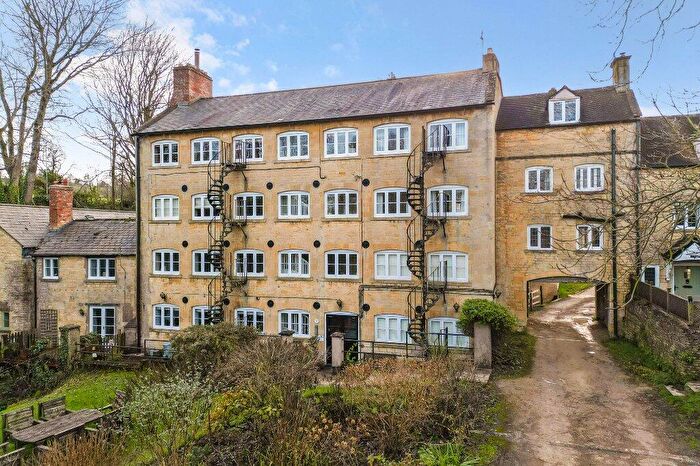
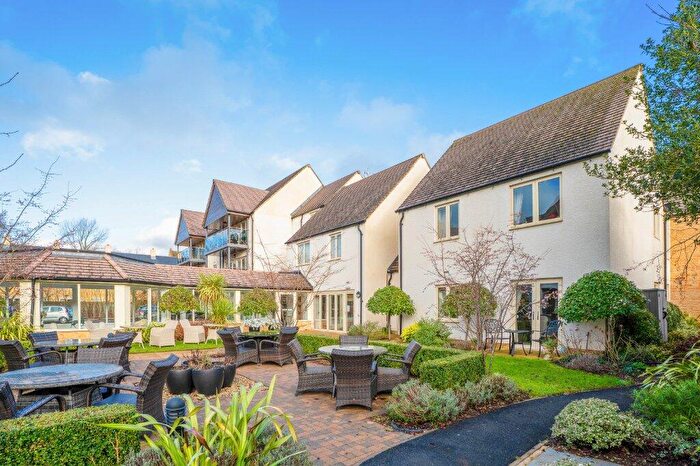
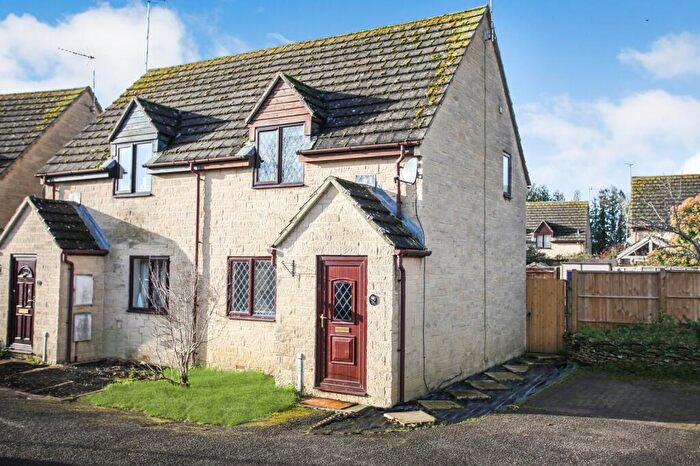
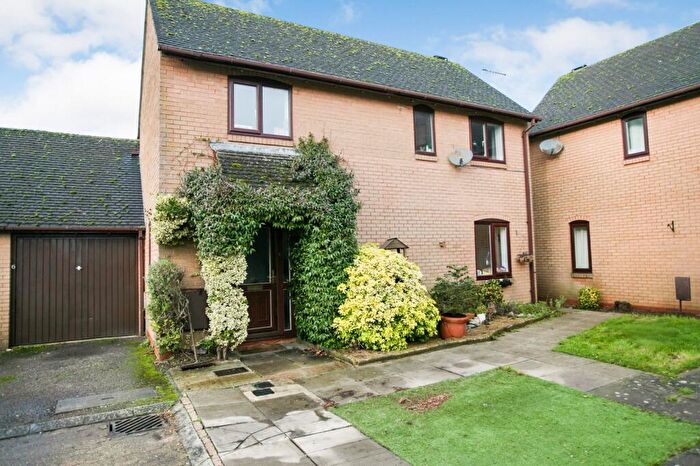
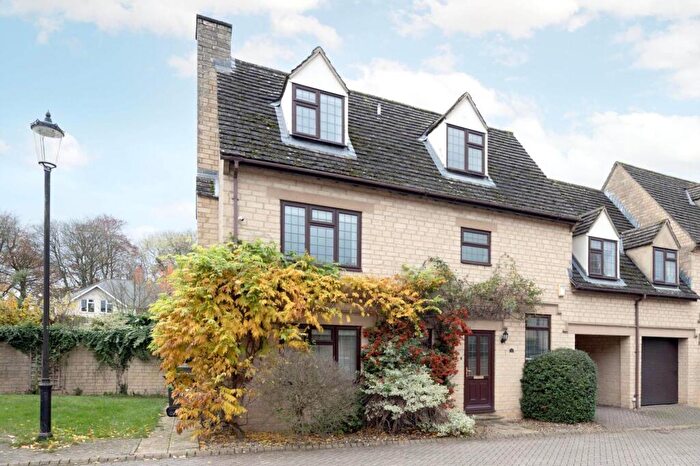
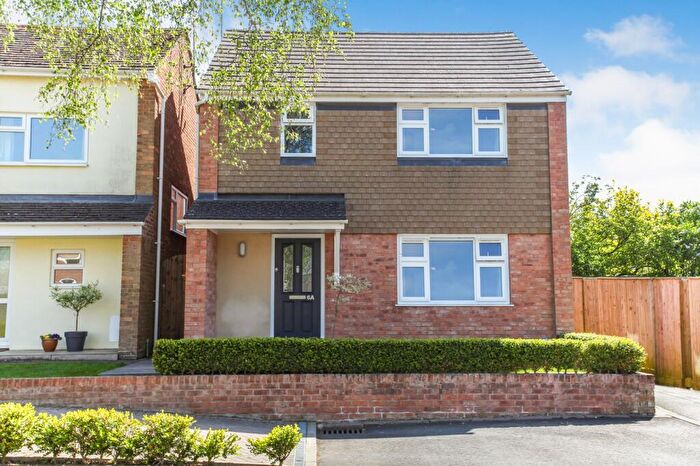
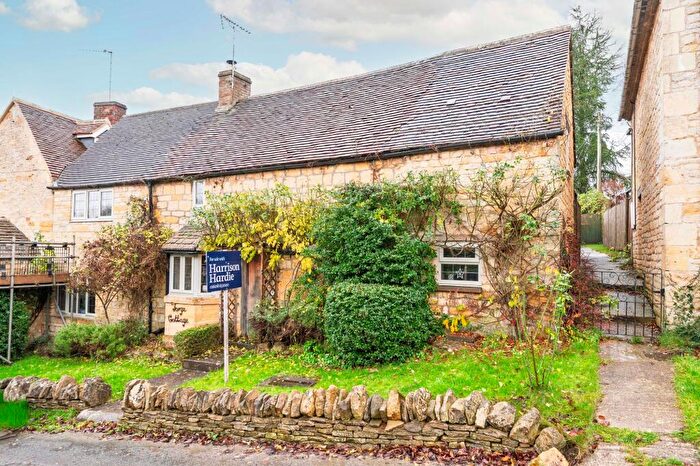
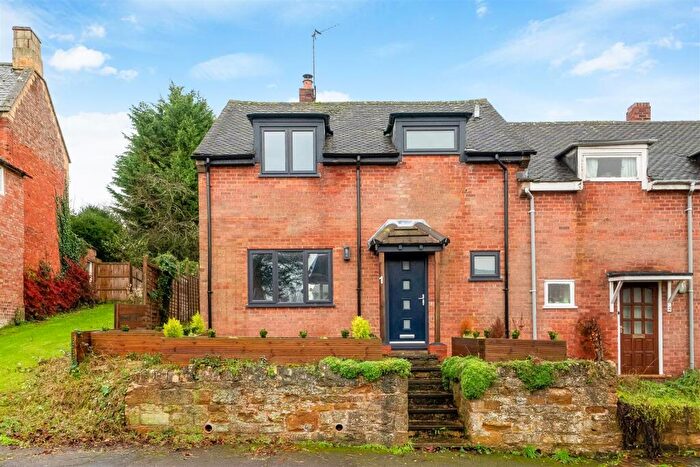
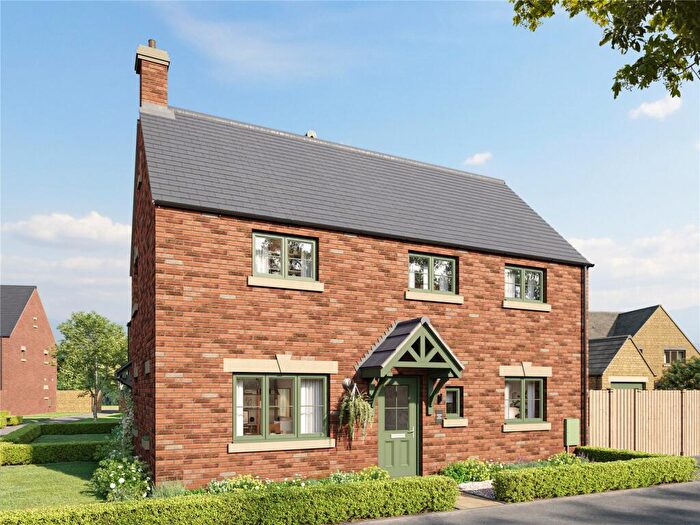
Houses and Flats for sale in GL56, Moreton-in-Marsh
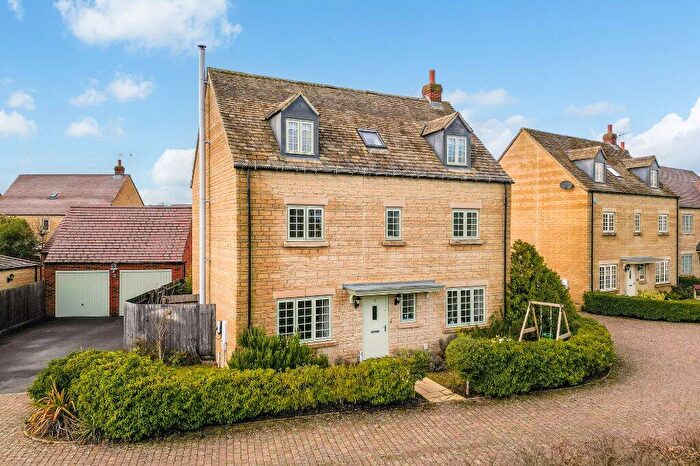
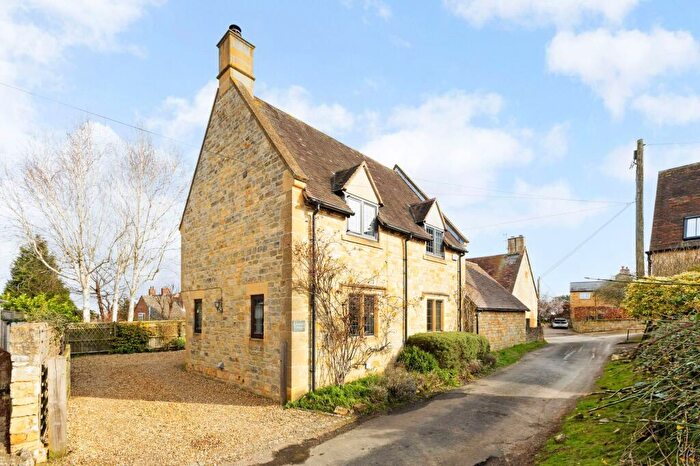
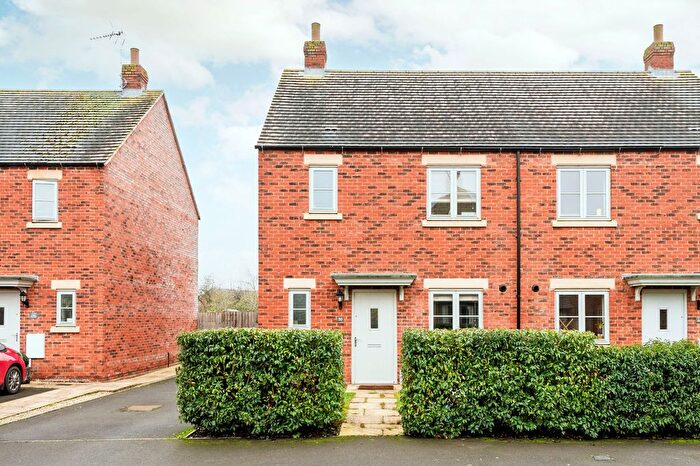
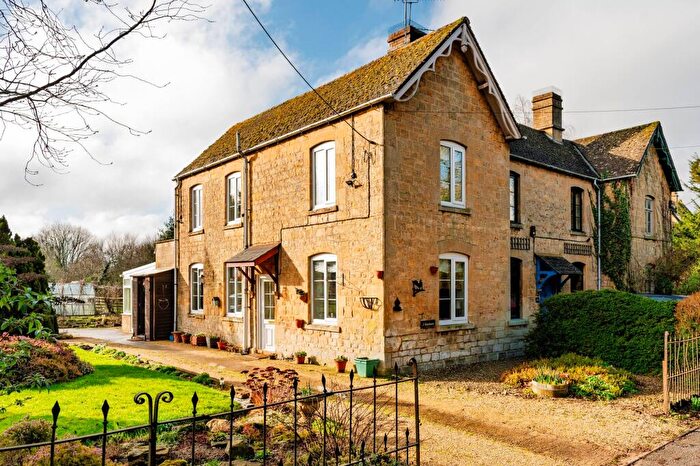
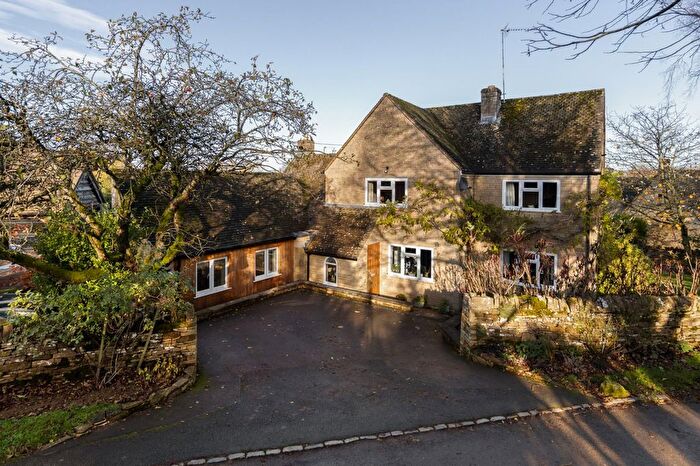
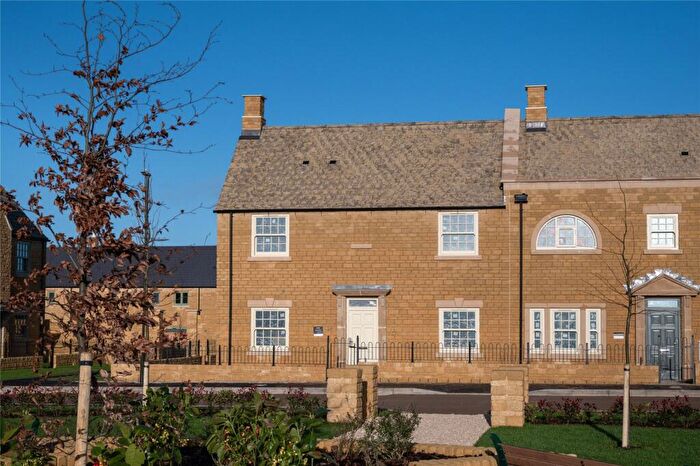
![]()
If you are looking to sell your house, let it out, or receive a property valuation, an expert can help you.
Click the button below to get started.

Frequently Asked Questions about GL56
What is the average price for a property for sale in GL56?
The average price for a property for sale in GL56 is £563,054. There are 82 property listings for sale in GL56.
Which areas are included in the GL56 postcode district?
The main area within GL56 is Moreton-in-Marsh.
What are the most common property types in GL56?
The most common property types in GL56 are Detached Houses, Semi Detached Houses, Terraced Houses and Flats.
What has been the average sold property price in GL56 over the last three years?
Detached Houses in GL56 have an average sold price of £902,189, while Semi Detached Houses have an average of £444,134. Terraced Houses have an average of £400,215 and Flats have an average of £222,124. The average sold property price in GL56 over the last three years is approximately £563,030.
Which train stations are available in GL56?
The train station available in GL56 is Moreton-In-Marsh Station..