
Properties for sale in HR4
North Hereford
- Info
- Price Paid By Year
- Property Type Price
- Transport
House Prices in HR4
Properties in HR4 have an average house price of £291,687.00 and had 1360 Property Transactions within the last 3 years.
The most expensive property was sold for £1,365,000.00.
Property Price Paid in HR4 by Year
The average sold property price by year was:
| Year | Average Sold Price | Sold Properties |
|---|---|---|
| 2026 | £235,129.00 | 31 Properties |
| 2025 | £283,242.00 | 455 Properties |
| 2024 | £310,065.00 | 468 Properties |
| 2023 | £284,286.00 | 406 Properties |
| 2022 | £290,491.00 | 529 Properties |
| 2021 | £278,813.00 | 728 Properties |
| 2020 | £254,403.00 | 509 Properties |
| 2019 | £245,883.00 | 655 Properties |
| 2018 | £241,523.00 | 549 Properties |
| 2017 | £229,124.00 | 592 Properties |
| 2016 | £221,248.00 | 524 Properties |
| 2015 | £207,633.00 | 488 Properties |
| 2014 | £202,253.00 | 527 Properties |
| 2013 | £193,669.00 | 430 Properties |
| 2012 | £190,502.00 | 387 Properties |
| 2011 | £185,360.00 | 370 Properties |
| 2010 | £198,864.00 | 380 Properties |
| 2009 | £185,604.00 | 385 Properties |
| 2008 | £209,453.00 | 318 Properties |
| 2007 | £201,721.00 | 707 Properties |
| 2006 | £178,952.00 | 727 Properties |
| 2005 | £175,272.00 | 616 Properties |
| 2004 | £169,121.00 | 669 Properties |
| 2003 | £140,256.00 | 795 Properties |
| 2002 | £118,952.00 | 800 Properties |
| 2001 | £101,022.00 | 841 Properties |
| 2000 | £92,730.00 | 726 Properties |
| 1999 | £75,022.00 | 812 Properties |
| 1998 | £67,827.00 | 688 Properties |
| 1997 | £64,006.00 | 716 Properties |
| 1996 | £58,237.00 | 574 Properties |
| 1995 | £56,886.00 | 456 Properties |
Property Price per Property Type in HR4
Here you can find historic sold price data in order to help with your property search.
The average Property Paid Price for specific property types in the last three years are:
| Property Type | Average Sold Price | Sold Properties |
|---|---|---|
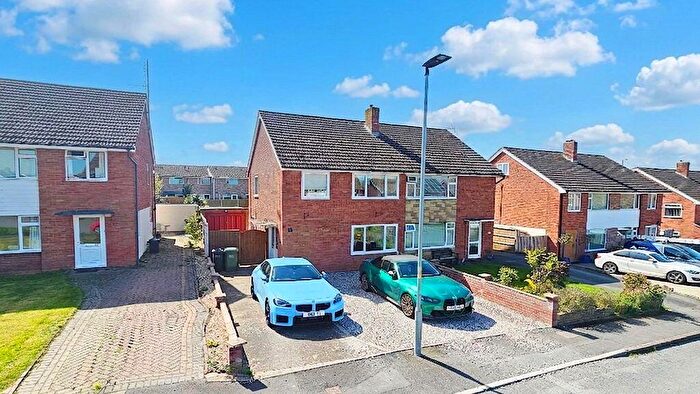
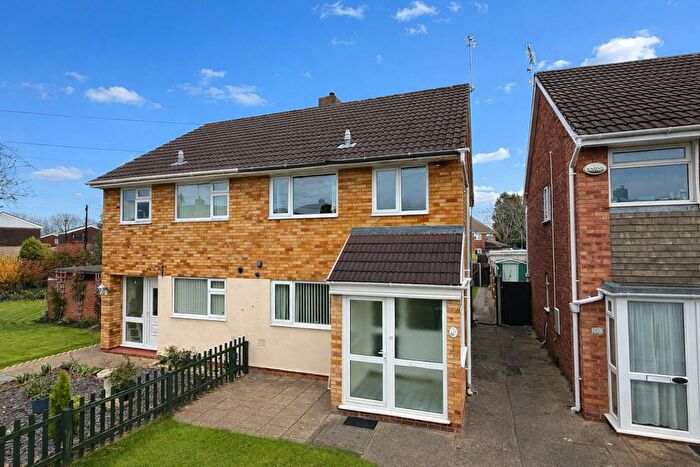
| Semi Detached House | £275,806.00 | 407 Semi Detached Houses |
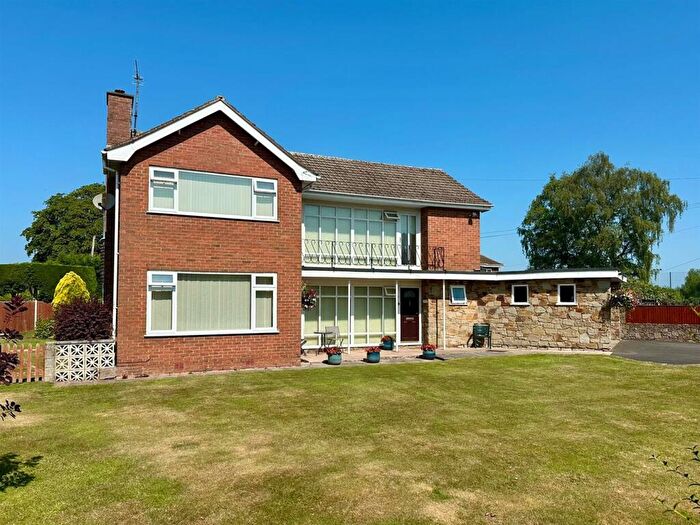
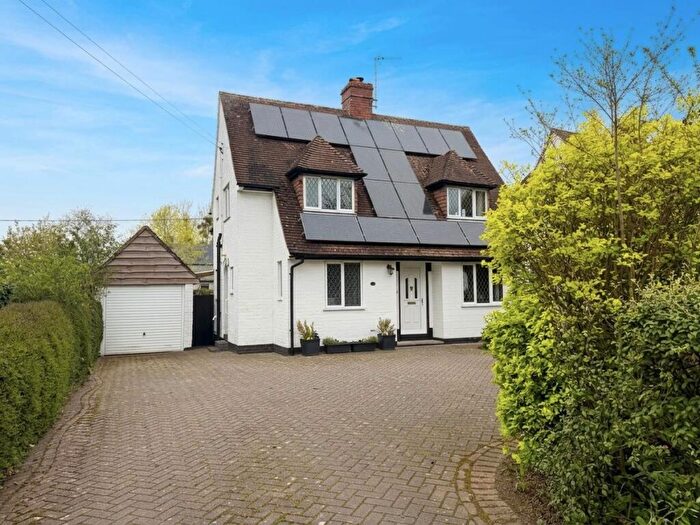
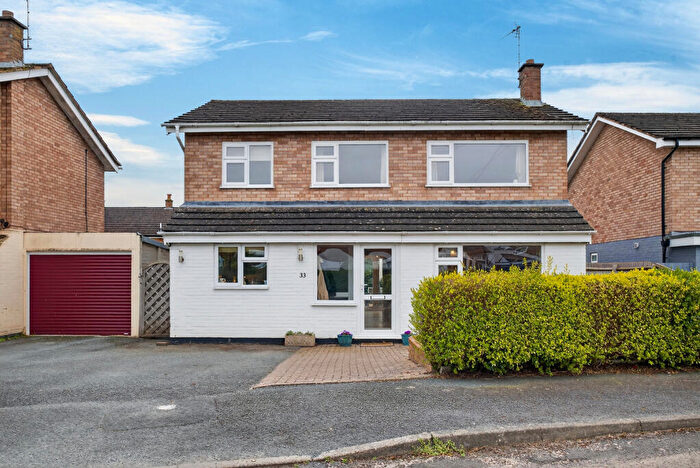
| Detached House | £434,090.00 | 408 Detached Houses |
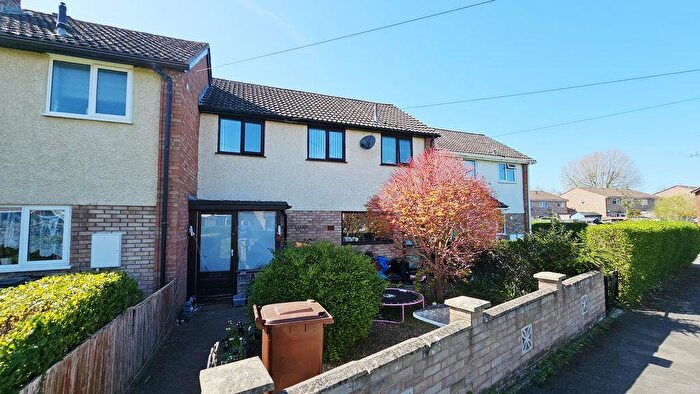
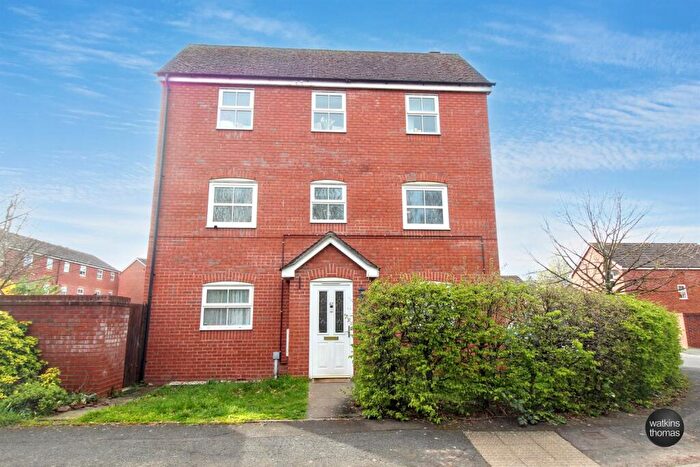
| Terraced House | £220,754.00 | 384 Terraced Houses |
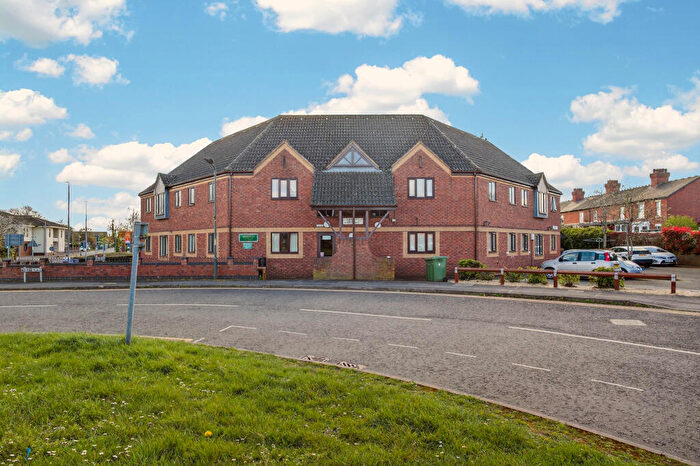
| Flat | £140,146.00 | 161 Flats |
Transport near HR4

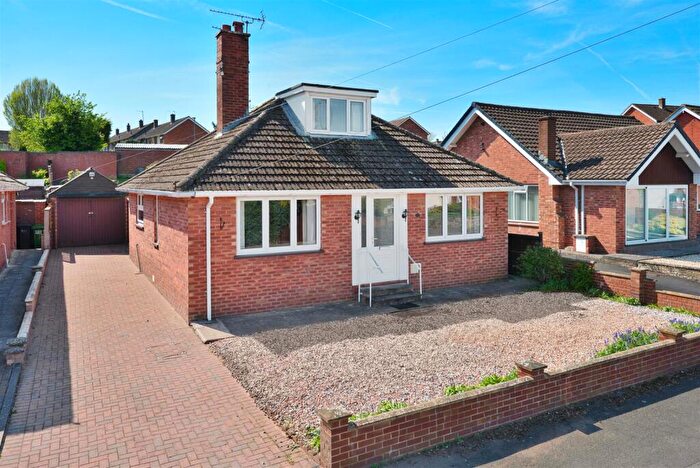
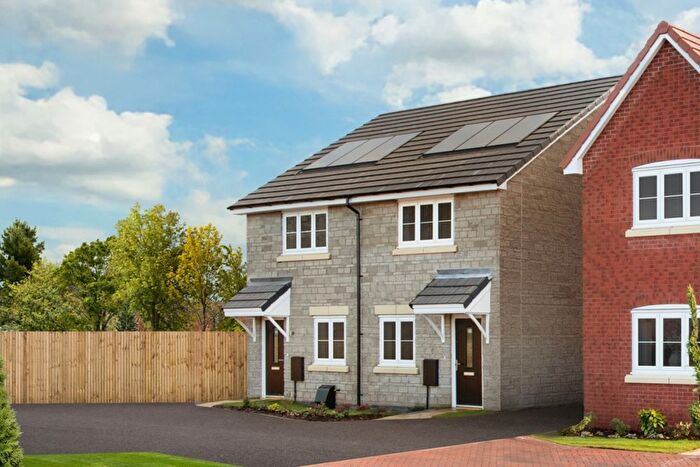
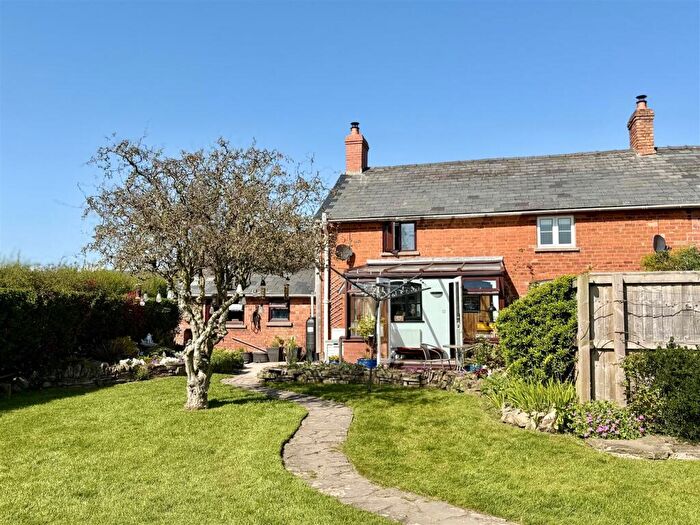
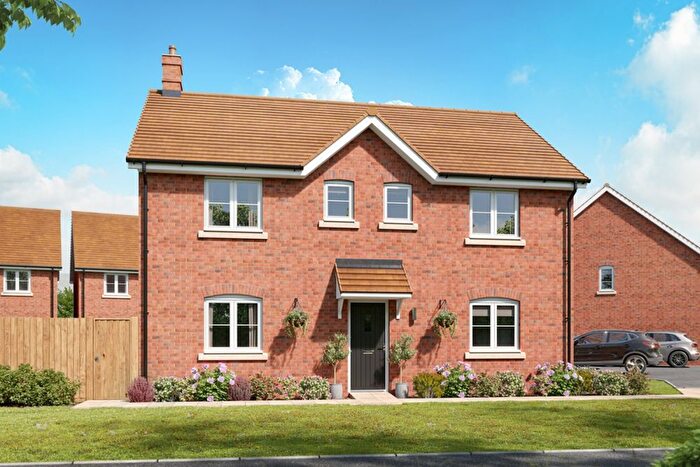
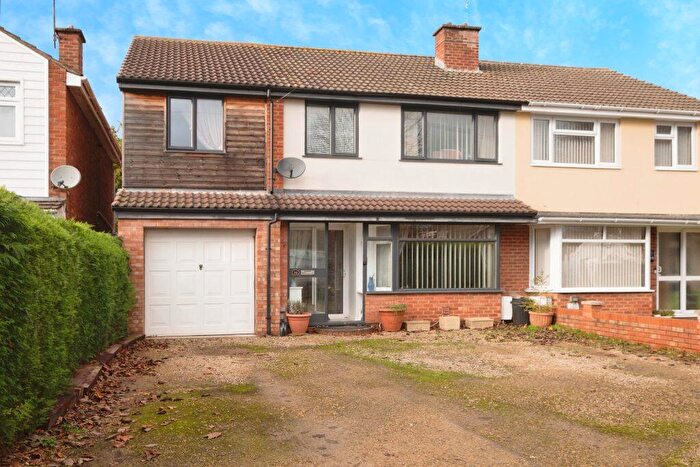
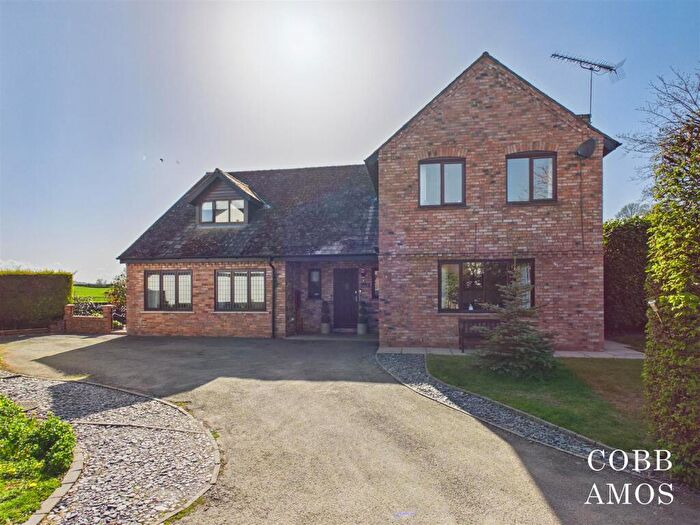
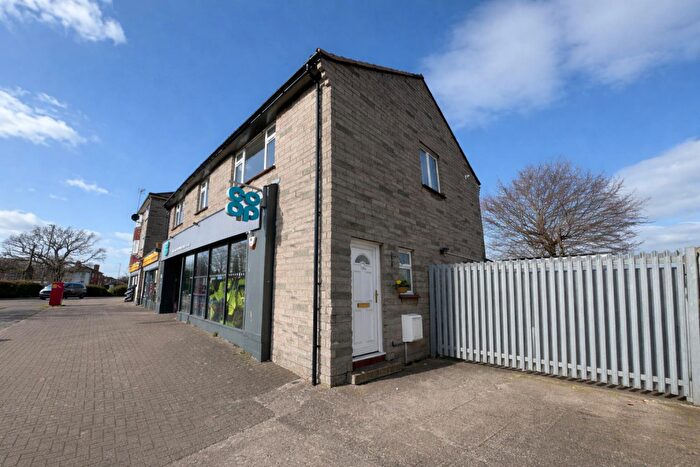
Houses and Flats for sale in HR4, North Hereford
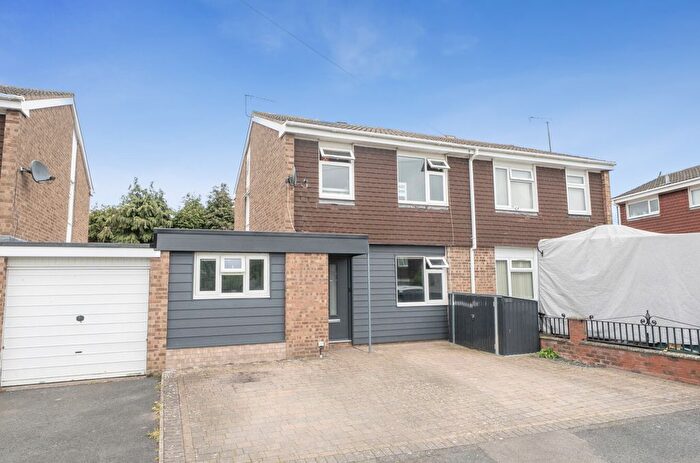
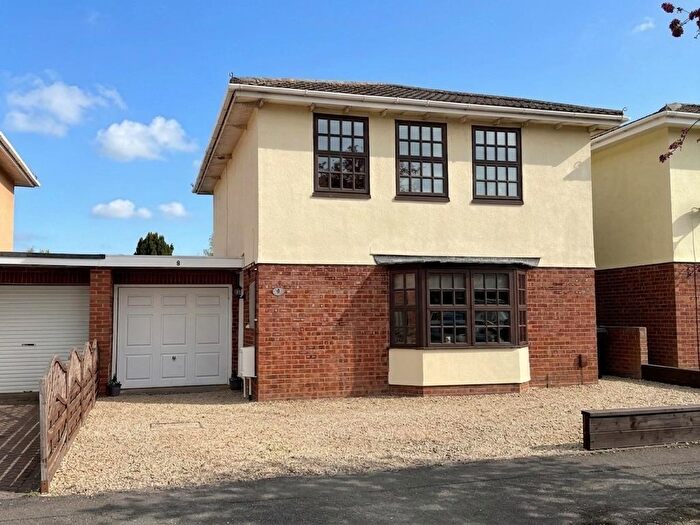
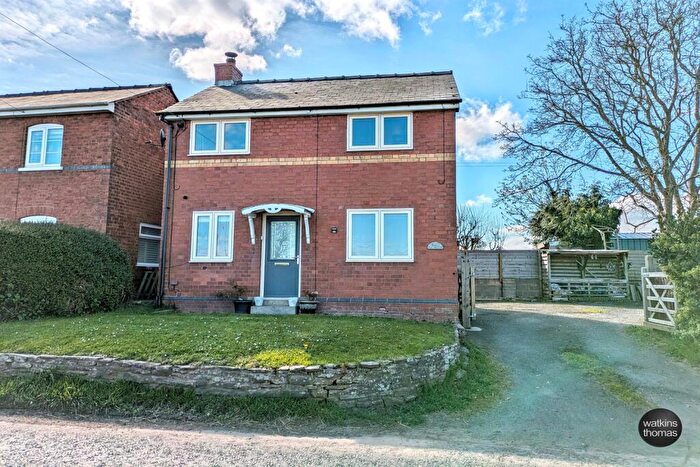
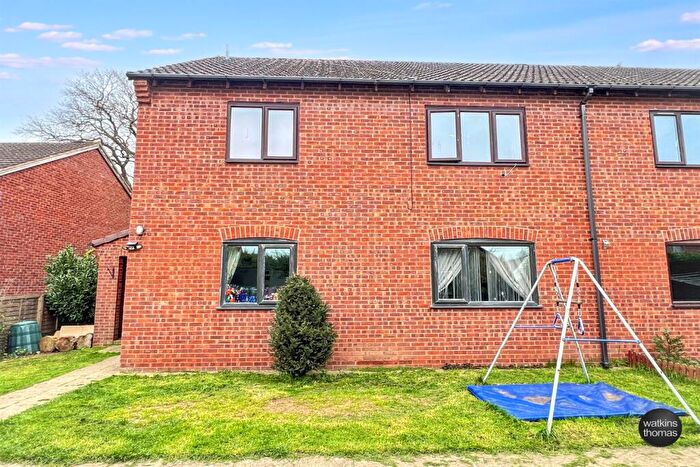
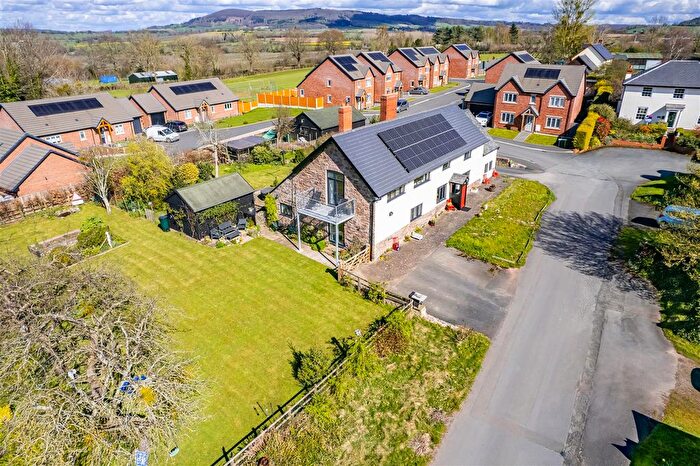
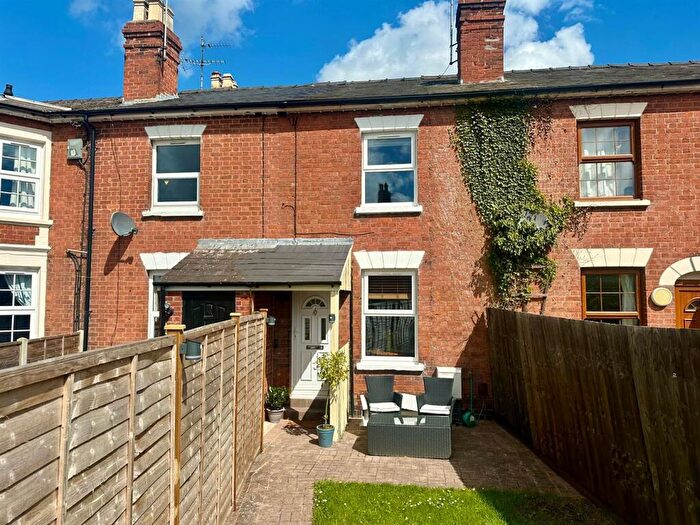
![]()
If you are looking to sell your house, let it out, or receive a property valuation, an expert can help you.
Click the button below to get started.
Frequently Asked Questions about HR4
What is the average price for a property for sale in HR4?
The average price for a property for sale in HR4 is £291,687. There are 255 property listings for sale in HR4.
Which areas are included in the HR4 postcode district?
The main area within HR4 is North Hereford.
What are the most common property types in HR4?
The most common property types in HR4 are Detached Houses, Semi Detached Houses, Terraced Houses and Flats.
What has been the average sold property price in HR4 over the last three years?
Detached Houses in HR4 have an average sold price of £434,090, while Semi Detached Houses have an average of £275,806. Terraced Houses have an average of £220,754 and Flats have an average of £140,146. The average sold property price in HR4 over the last three years is approximately £276,145.