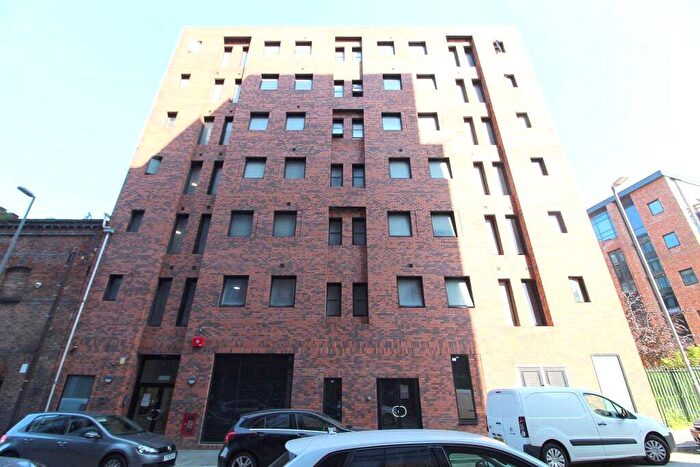
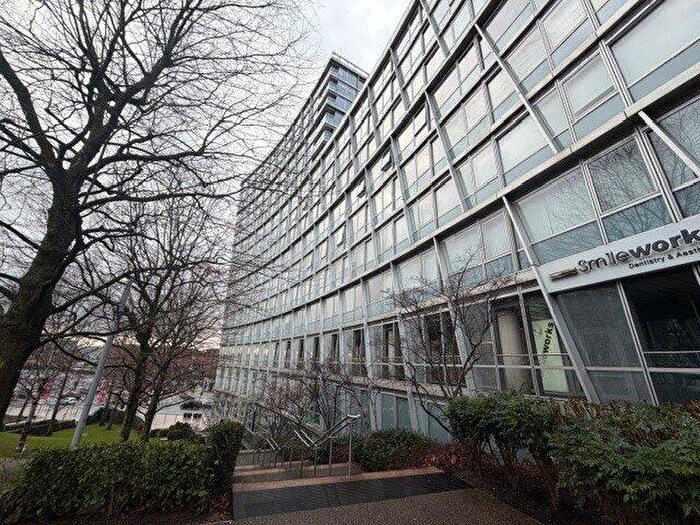
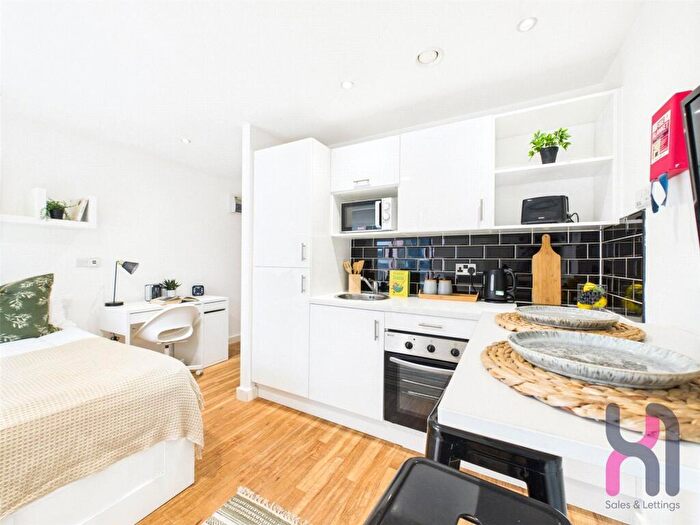
Properties for sale in L1
Liverpool city centre
- Info
- Price Paid By Year
- Property Type Price
- Transport
House Prices in L1
Properties in L1 have an average house price of £153,511.00 and had 545 Property Transactions within the last 3 years.
The most expensive property was sold for £1,320,000.00.
Property Price Paid in L1 by Year
The average sold property price by year was:
| Year | Average Sold Price | Sold Properties |
|---|---|---|
| 2025 | £139,488.00 | 130 Properties |
| 2024 | £139,510.00 | 197 Properties |
| 2023 | £174,526.00 | 218 Properties |
| 2022 | £173,071.00 | 175 Properties |
| 2021 | £146,883.00 | 299 Properties |
| 2020 | £127,050.00 | 246 Properties |
| 2019 | £114,181.00 | 640 Properties |
| 2018 | £100,595.00 | 668 Properties |
| 2017 | £99,667.00 | 479 Properties |
| 2016 | £112,973.00 | 389 Properties |
| 2015 | £116,910.00 | 212 Properties |
| 2014 | £124,762.00 | 203 Properties |
| 2013 | £104,266.00 | 160 Properties |
| 2012 | £145,745.00 | 82 Properties |
| 2011 | £118,997.00 | 114 Properties |
| 2010 | £133,480.00 | 162 Properties |
| 2009 | £169,417.00 | 185 Properties |
| 2008 | £161,724.00 | 148 Properties |
| 2007 | £162,652.00 | 301 Properties |
| 2006 | £159,120.00 | 363 Properties |
| 2005 | £155,940.00 | 210 Properties |
| 2004 | £141,532.00 | 253 Properties |
| 2003 | £133,767.00 | 362 Properties |
| 2002 | £108,765.00 | 180 Properties |
| 2001 | £104,219.00 | 65 Properties |
| 2000 | £75,759.00 | 25 Properties |
| 1999 | £90,263.00 | 23 Properties |
| 1998 | £63,870.00 | 12 Properties |
| 1997 | £46,014.00 | 16 Properties |
| 1996 | £49,626.00 | 24 Properties |
| 1995 | £41,841.00 | 16 Properties |
Property Price per Property Type in L1
Here you can find historic sold price data in order to help with your property search.
The average Property Paid Price for specific property types in the last three years are:
| Property Type | Average Sold Price | Sold Properties |
|---|---|---|
| Terraced House | £634,139.00 | 20 Terraced Houses |
| Semi Detached House | £301,000.00 | 5 Semi Detached Houses |
| Detached House | £346,666.00 | 3 Detached Houses |
| Flat | £132,371.00 | 517 Flats |
Houses and Flats for sale in L1, Liverpool city centre
Frequently Asked Questions about L1
What is the average price for a property for sale in L1?
The average price for a property for sale in L1 is £153,511. There are 560 property listings for sale in L1.
Which areas are included in the L1 postcode district?
The main area within L1 is Liverpool city centre.
What are the most common property types in L1?
The most common property types in L1 are Flats, Terraced Houses, Semi Detached Houses and Detached Houses.
What has been the average sold property price in L1 over the last three years?
Flats in L1 have an average sold price of £132,371, while Terraced Houses have an average of £634,139. Semi Detached Houses have an average of £301,000 and Detached Houses have an average of £346,666. The average sold property price in L1 over the last three years is approximately £151,175.
Which train stations are available in L1?
The train stations available in L1 are Aigburth Station, Broad Green Station, Cressington Station, Liverpool Central Station, Liverpool Lime Street Station, Liverpool South Parkway Station, Mossley Hill Station, St.Michaels Station, Wavertree Technology Park Station, West Allerton Station and Mossley Hill Station..


