
Properties for sale in L32
Kirkby
- Info
- Price Paid By Year
- Property Type Price
- Transport
House Prices in L32
Properties in L32 have an average house price of £149,623.00 and had 599 Property Transactions within the last 3 years.
The most expensive property was sold for £360,000.00.
Property Price Paid in L32 by Year
The average sold property price by year was:
| Year | Average Sold Price | Sold Properties |
|---|---|---|
| 2025 | £163,517.00 | 159 Properties |
| 2024 | £147,036.00 | 258 Properties |
| 2023 | £141,152.00 | 182 Properties |
| 2022 | £145,194.00 | 257 Properties |
| 2021 | £133,392.00 | 283 Properties |
| 2020 | £130,838.00 | 233 Properties |
| 2019 | £133,224.00 | 327 Properties |
| 2018 | £111,464.00 | 279 Properties |
| 2017 | £98,975.00 | 176 Properties |
| 2016 | £98,095.00 | 192 Properties |
| 2015 | £93,896.00 | 147 Properties |
| 2014 | £92,541.00 | 157 Properties |
| 2013 | £96,177.00 | 136 Properties |
| 2012 | £87,262.00 | 93 Properties |
| 2011 | £90,970.00 | 99 Properties |
| 2010 | £100,831.00 | 125 Properties |
| 2009 | £97,059.00 | 116 Properties |
| 2008 | £118,331.00 | 138 Properties |
| 2007 | £119,061.00 | 361 Properties |
| 2006 | £121,929.00 | 404 Properties |
| 2005 | £116,004.00 | 368 Properties |
| 2004 | £103,389.00 | 343 Properties |
| 2003 | £74,091.00 | 319 Properties |
| 2002 | £51,839.00 | 244 Properties |
| 2001 | £52,319.00 | 267 Properties |
| 2000 | £45,438.00 | 210 Properties |
| 1999 | £42,236.00 | 137 Properties |
| 1998 | £40,090.00 | 138 Properties |
| 1997 | £39,030.00 | 159 Properties |
| 1996 | £48,507.00 | 198 Properties |
| 1995 | £49,192.00 | 195 Properties |
Property Price per Property Type in L32
Here you can find historic sold price data in order to help with your property search.
The average Property Paid Price for specific property types in the last three years are:
| Property Type | Average Sold Price | Sold Properties |
|---|---|---|
| Semi Detached House | £156,709.00 | 209 Semi Detached Houses |
| Detached House | £249,285.00 | 81 Detached Houses |
| Terraced House | £125,473.00 | 275 Terraced Houses |
| Flat | £63,970.00 | 34 Flats |
Transport near L32

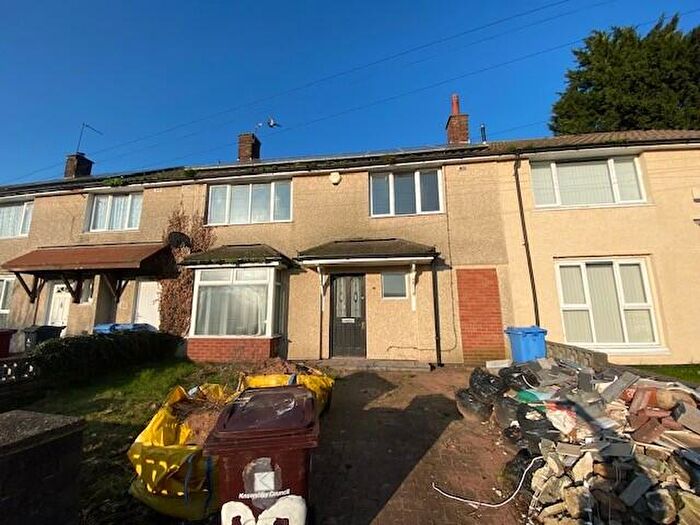
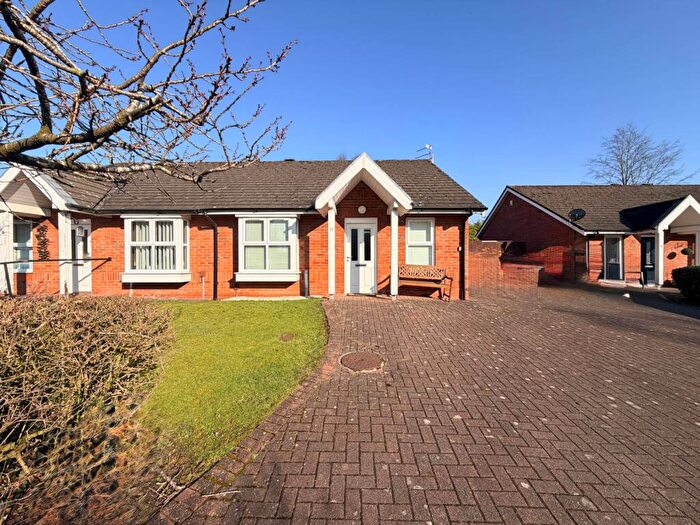
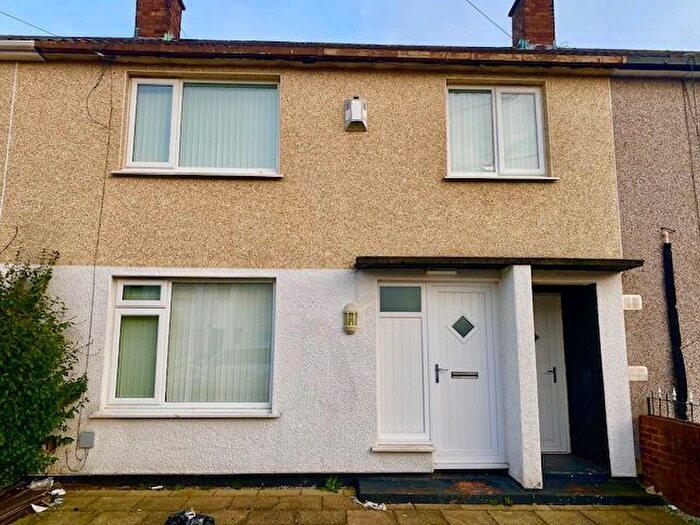
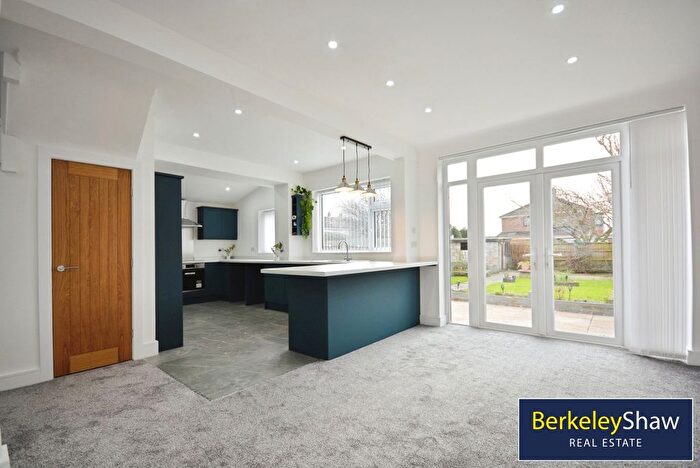
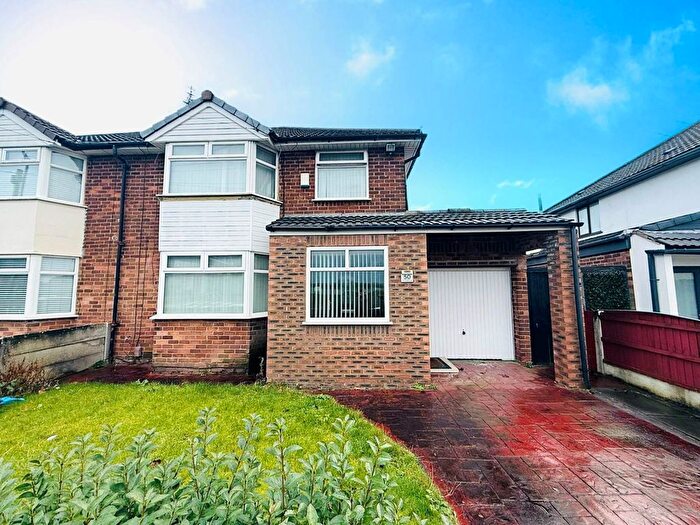
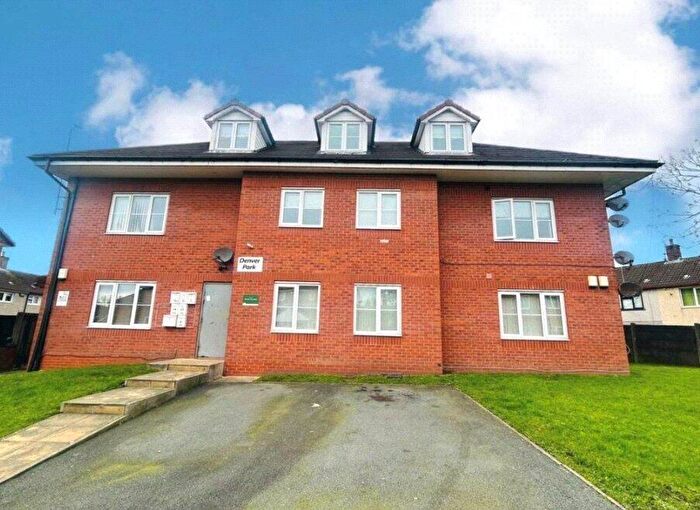
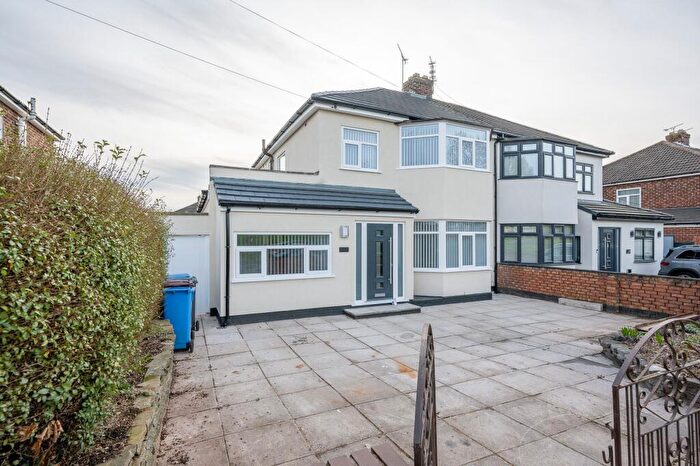
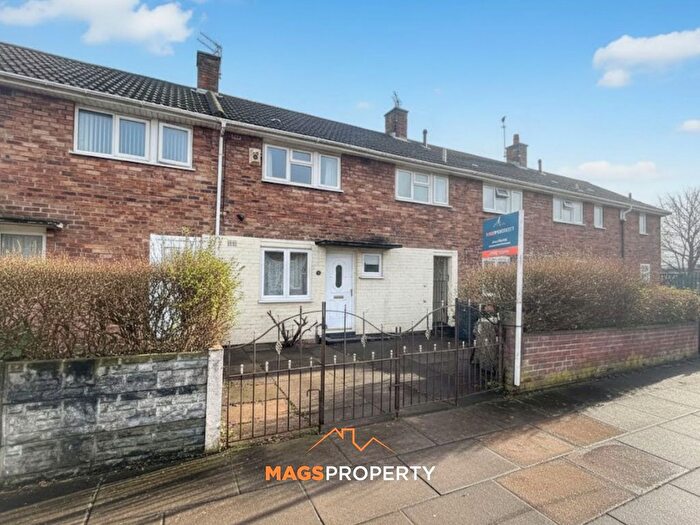
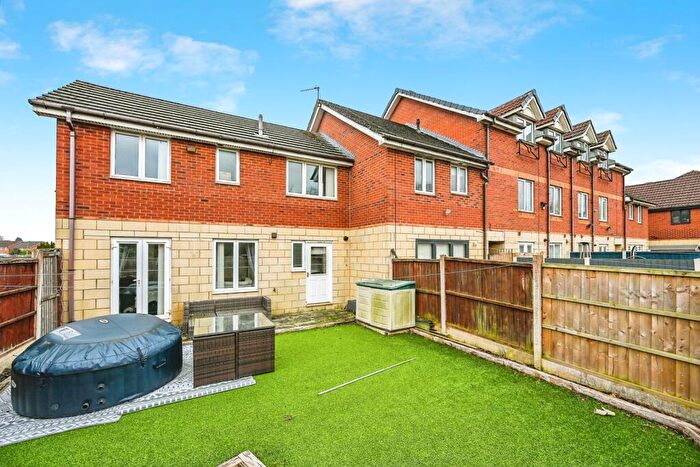
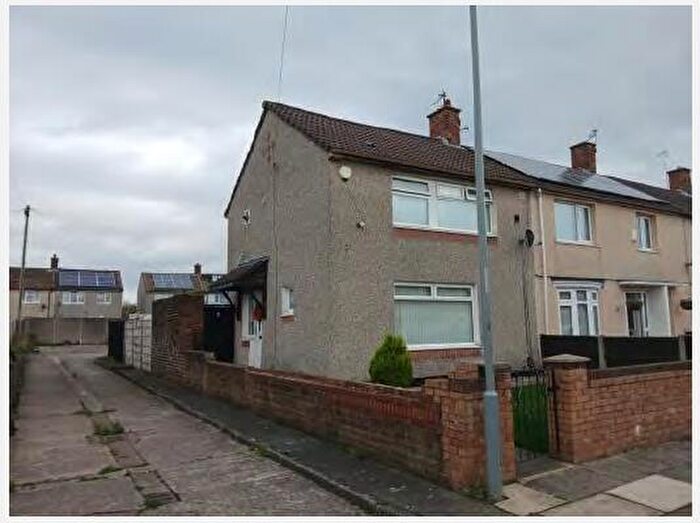
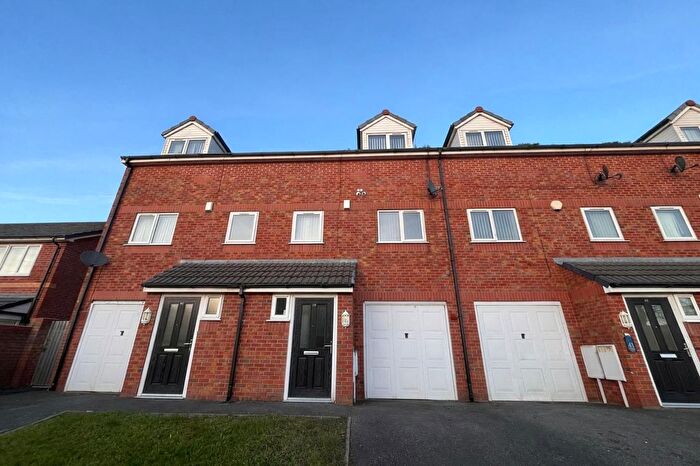
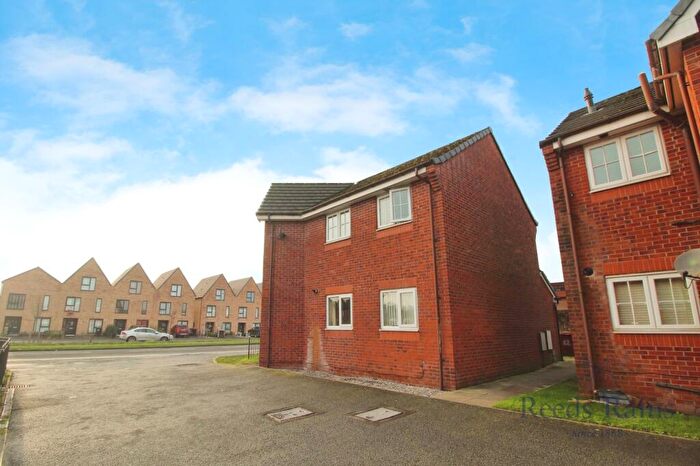
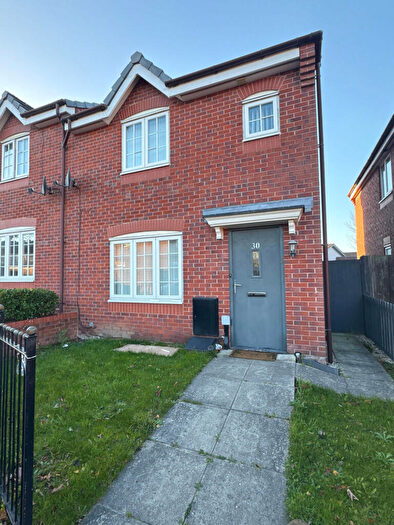
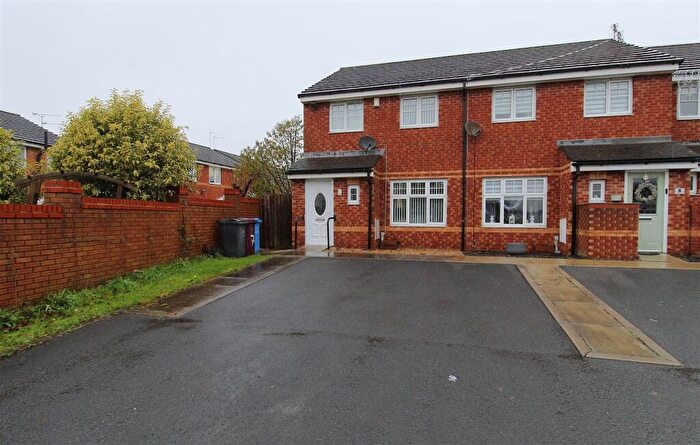
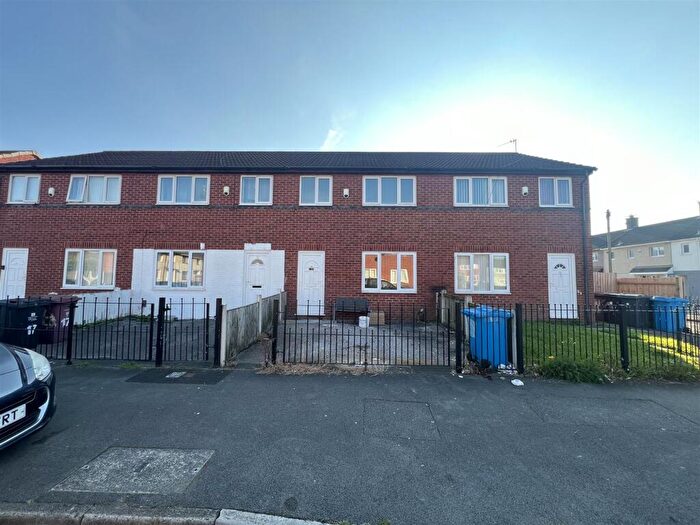
Houses and Flats for sale in L32, Kirkby
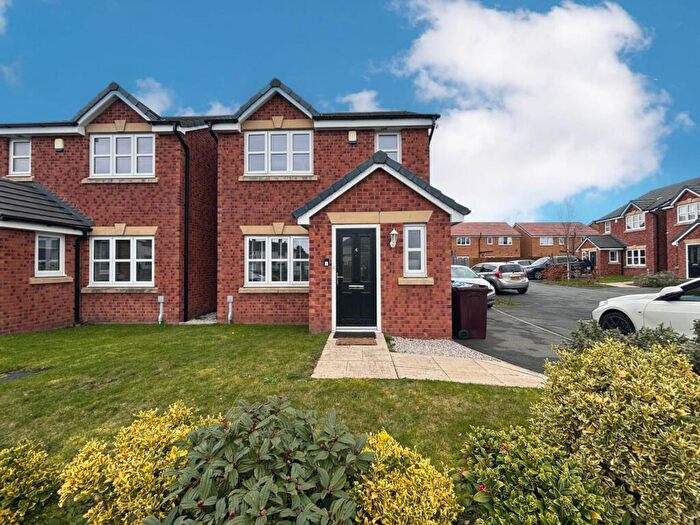
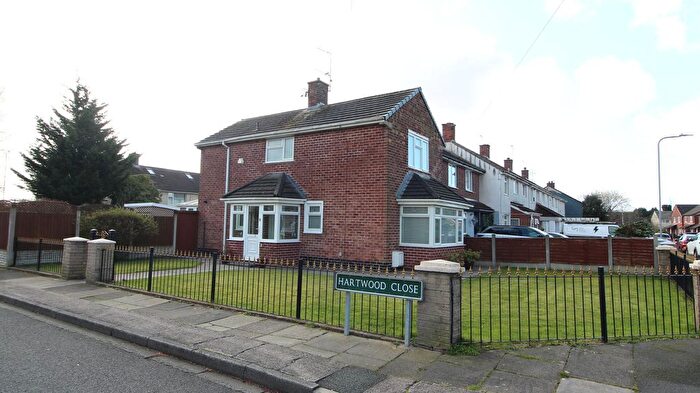
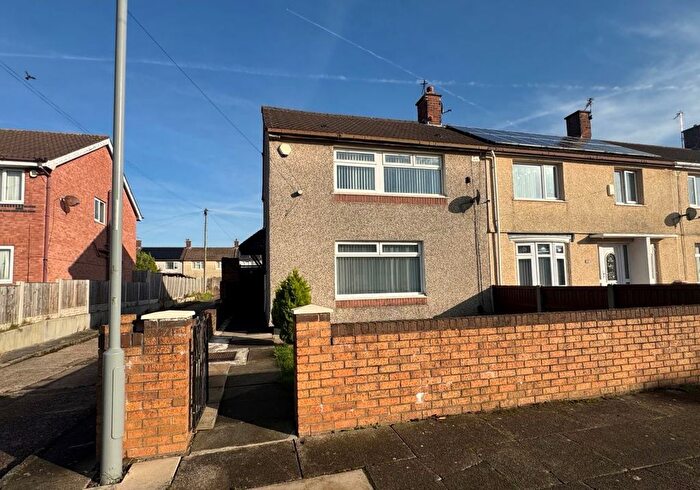
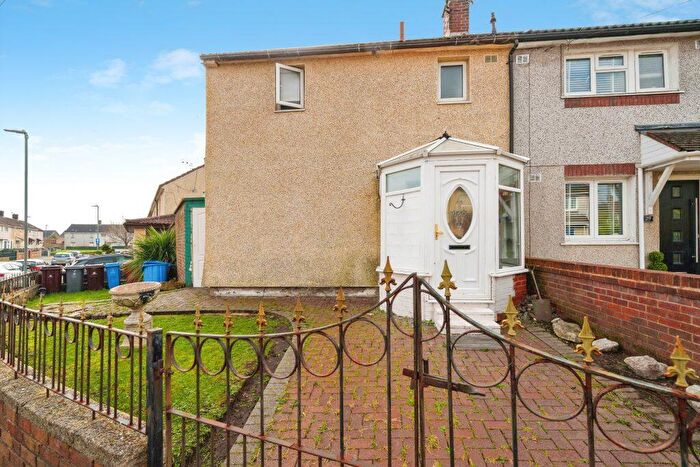

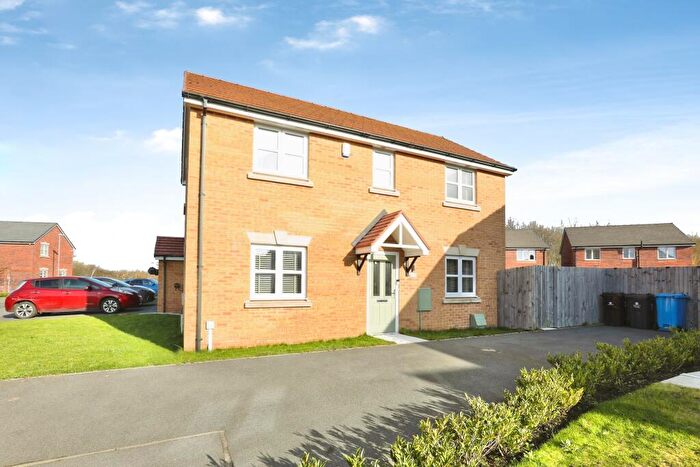
![]()
If you are looking to sell your house, let it out, or receive a property valuation, an expert can help you.
Click the button below to get started.


1
Frequently Asked Questions about L32
What is the average price for a property for sale in L32?
The average price for a property for sale in L32 is £149,623. There are 24 property listings for sale in L32.
Which areas are included in the L32 postcode district?
The main area within L32 is Kirkby.
What are the most common property types in L32?
The most common property types in L32 are Terraced Houses, Semi Detached Houses, Detached Houses and Flats.
What has been the average sold property price in L32 over the last three years?
Terraced Houses in L32 have an average sold price of £125,473, while Semi Detached Houses have an average of £156,709. Detached Houses have an average of £249,285 and Flats have an average of £63,970. The average sold property price in L32 over the last three years is approximately £150,568.
Which train stations are available in L32?
The train station available in L32 is Kirkby (Merseyside) Station..