
Properties for sale in L39
Ormskirk
- Info
- Price Paid By Year
- Property Type Price
- Transport
House Prices in L39
Properties in L39 have an average house price of £316,539.00 and had 1149 Property Transactions within the last 3 years.
The most expensive property was sold for £2,950,000.00.
Property Price Paid in L39 by Year
The average sold property price by year was:
| Year | Average Sold Price | Sold Properties |
|---|---|---|
| 2026 | £526,250.00 | 4 Properties |
| 2025 | £312,538.00 | 340 Properties |
| 2024 | £320,870.00 | 432 Properties |
| 2023 | £312,920.00 | 373 Properties |
| 2022 | £304,918.00 | 429 Properties |
| 2021 | £294,676.00 | 540 Properties |
| 2020 | £260,047.00 | 388 Properties |
| 2019 | £243,456.00 | 430 Properties |
| 2018 | £271,875.00 | 410 Properties |
| 2017 | £252,409.00 | 485 Properties |
| 2016 | £246,026.00 | 488 Properties |
| 2015 | £238,199.00 | 435 Properties |
| 2014 | £215,697.00 | 421 Properties |
| 2013 | £217,666.00 | 378 Properties |
| 2012 | £211,224.00 | 327 Properties |
| 2011 | £211,811.00 | 294 Properties |
| 2010 | £228,602.00 | 270 Properties |
| 2009 | £206,636.00 | 277 Properties |
| 2008 | £229,545.00 | 266 Properties |
| 2007 | £231,225.00 | 511 Properties |
| 2006 | £204,849.00 | 497 Properties |
| 2005 | £202,485.00 | 359 Properties |
| 2004 | £199,506.00 | 495 Properties |
| 2003 | £156,285.00 | 513 Properties |
| 2002 | £131,849.00 | 542 Properties |
| 2001 | £110,328.00 | 512 Properties |
| 2000 | £104,562.00 | 517 Properties |
| 1999 | £98,042.00 | 592 Properties |
| 1998 | £85,411.00 | 498 Properties |
| 1997 | £79,371.00 | 488 Properties |
| 1996 | £76,276.00 | 358 Properties |
| 1995 | £77,214.00 | 330 Properties |
Property Price per Property Type in L39
Here you can find historic sold price data in order to help with your property search.
The average Property Paid Price for specific property types in the last three years are:
| Property Type | Average Sold Price | Sold Properties |
|---|---|---|
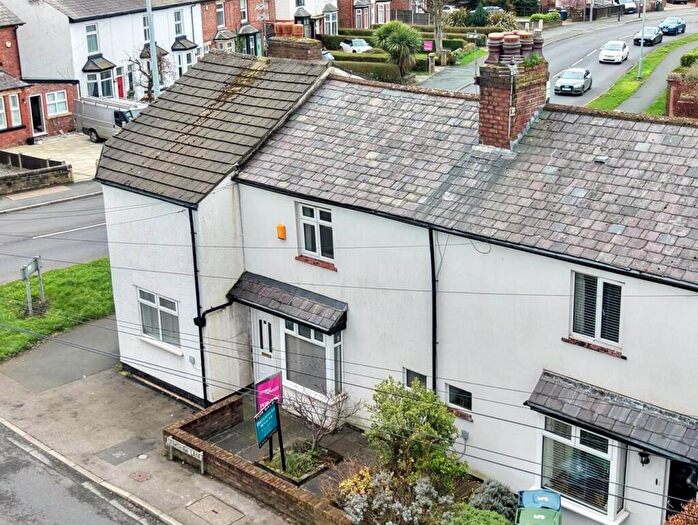
| Semi Detached House | £270,687.00 | 518 Semi Detached Houses |
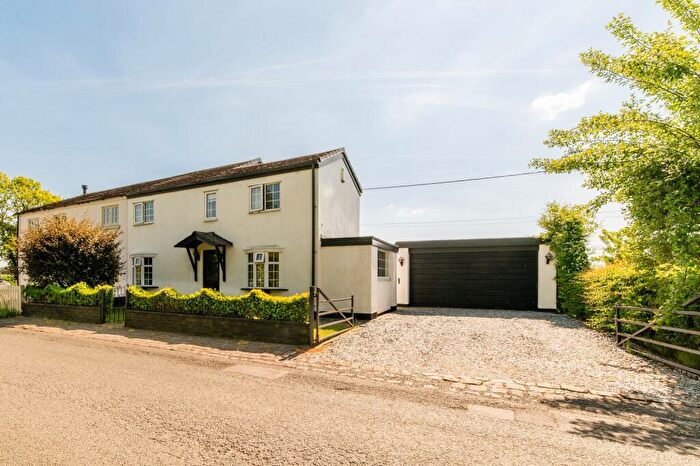
| Detached House | £531,034.00 | 305 Detached Houses |
| Terraced House | £202,529.00 | 203 Terraced Houses |
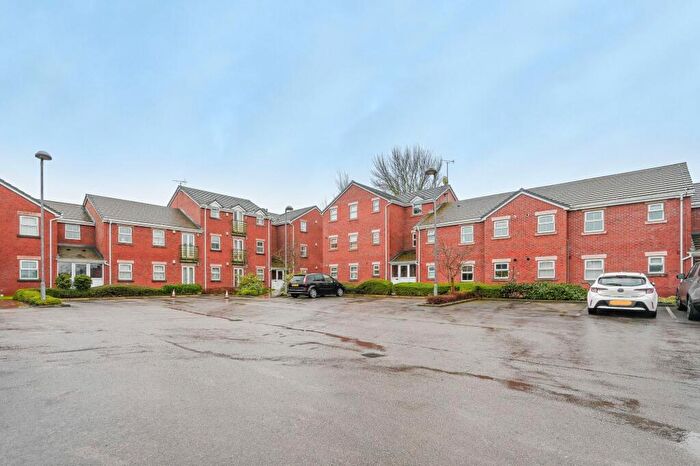
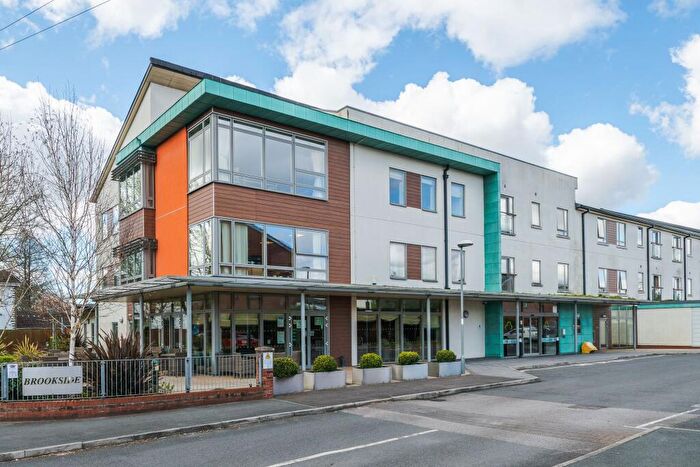
| Flat | £165,922.00 | 123 Flats |
Transport near L39

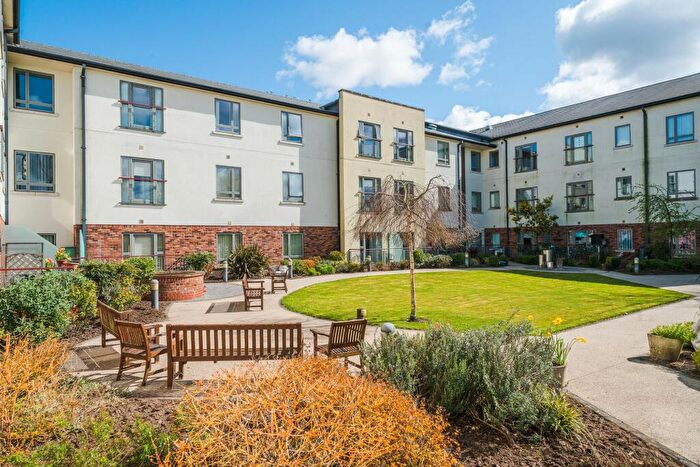
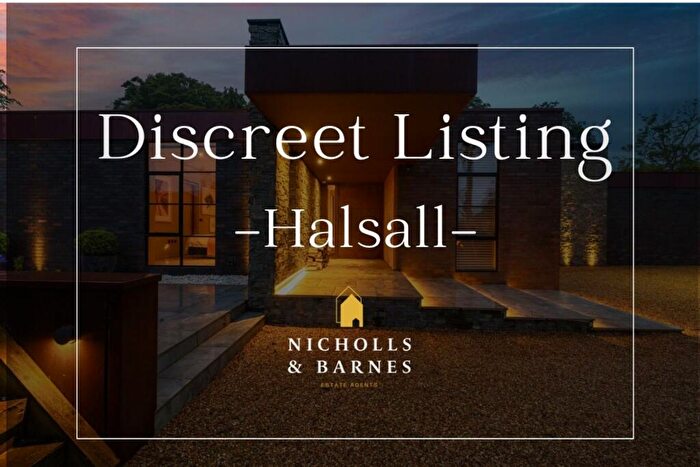
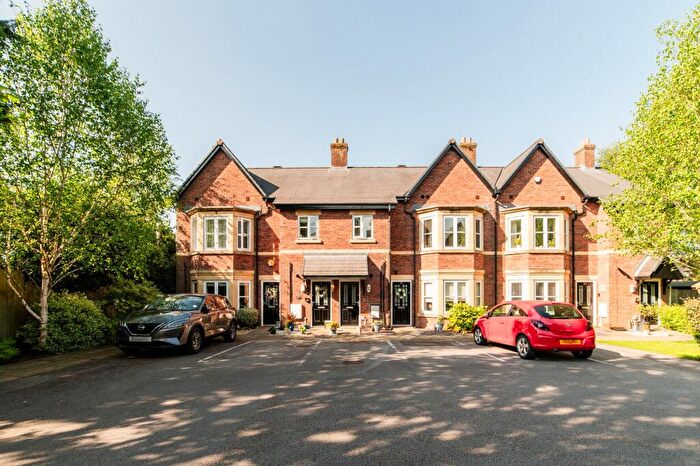
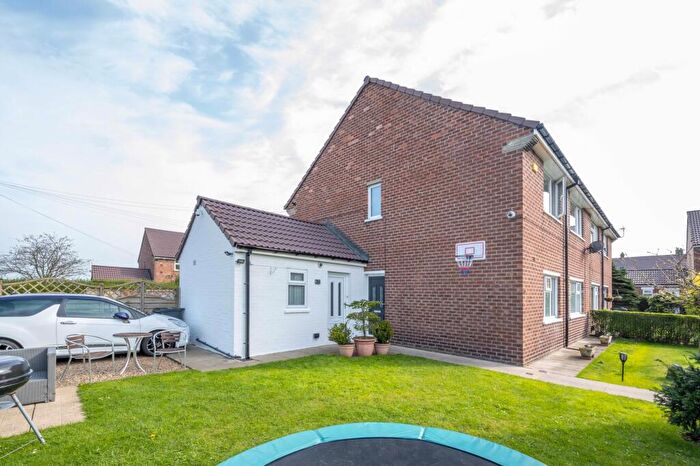
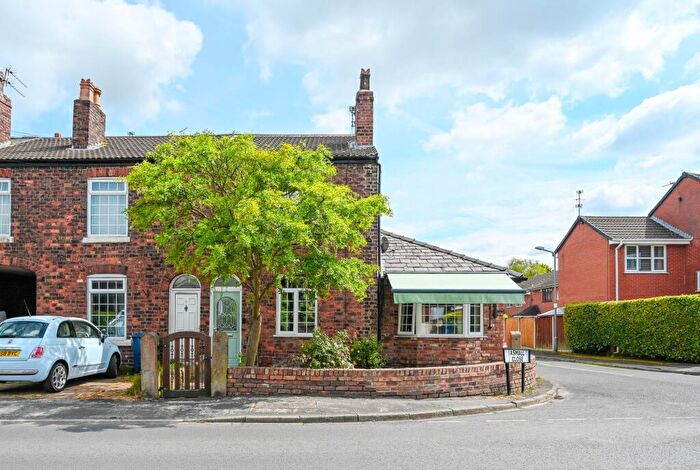
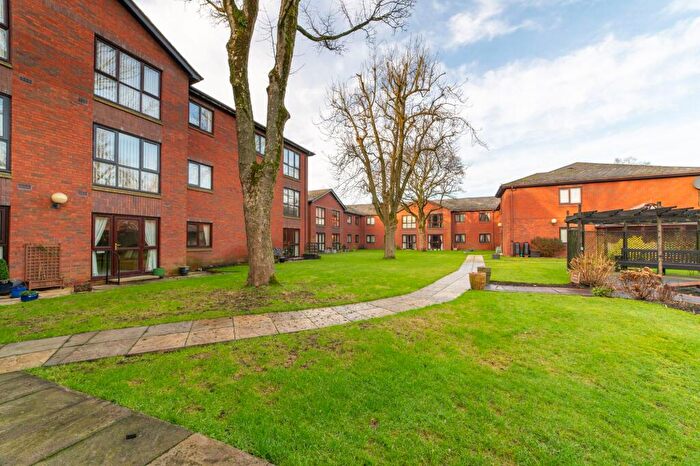
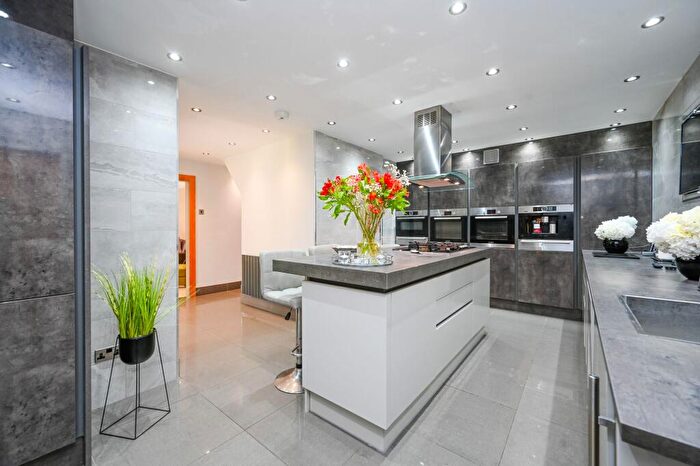
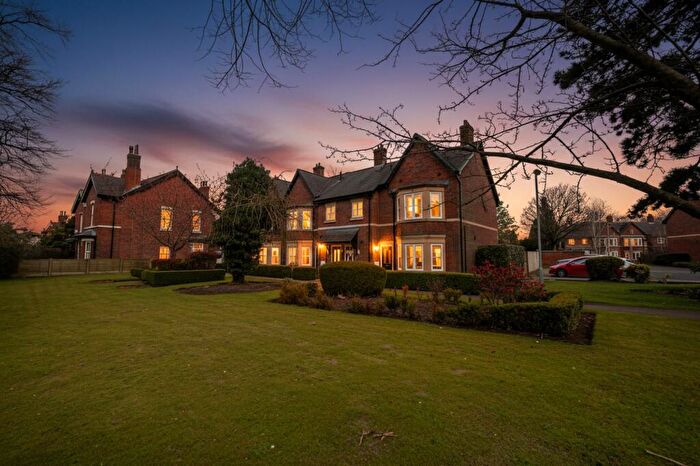
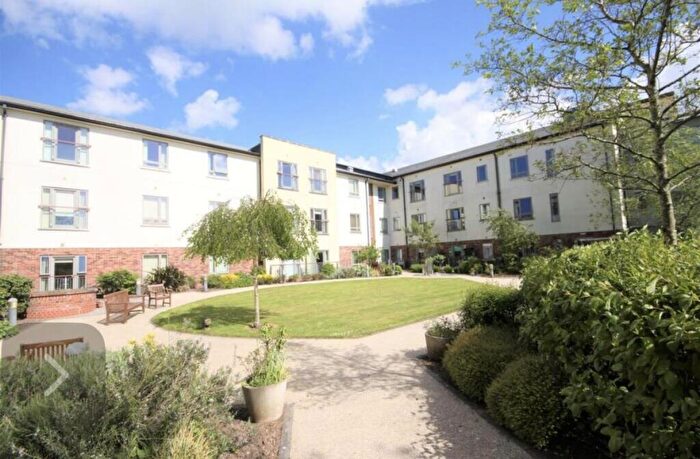
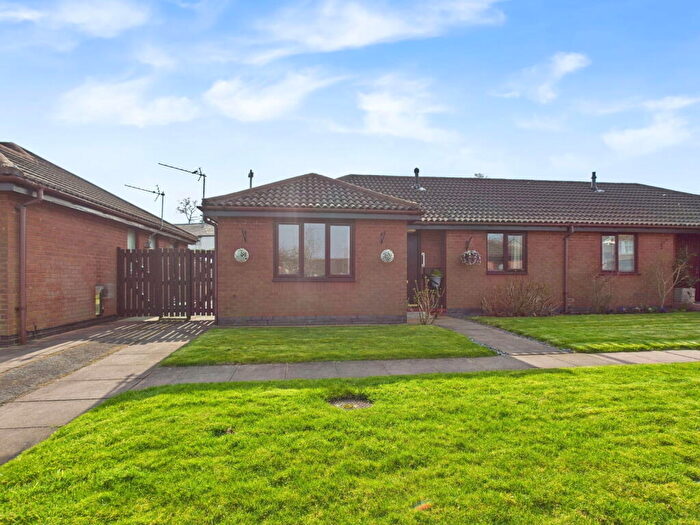
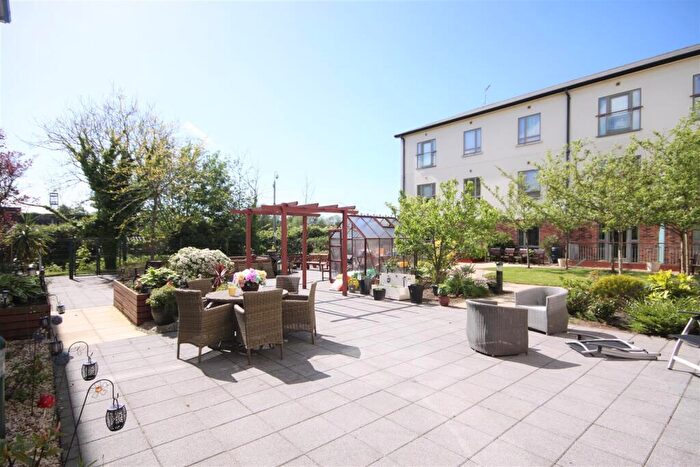
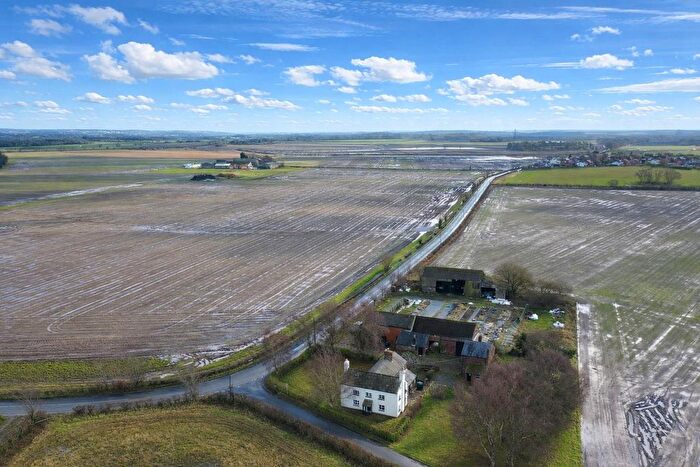
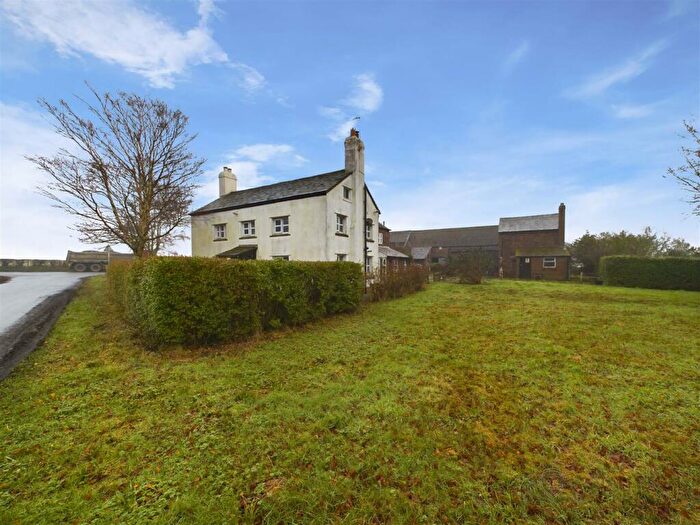
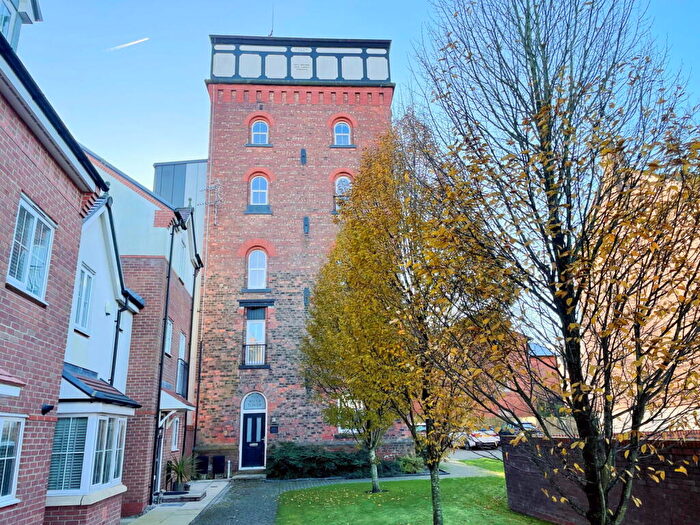
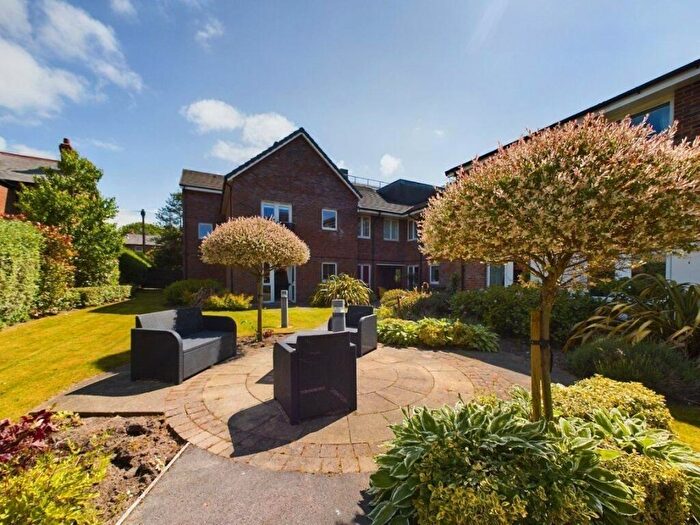
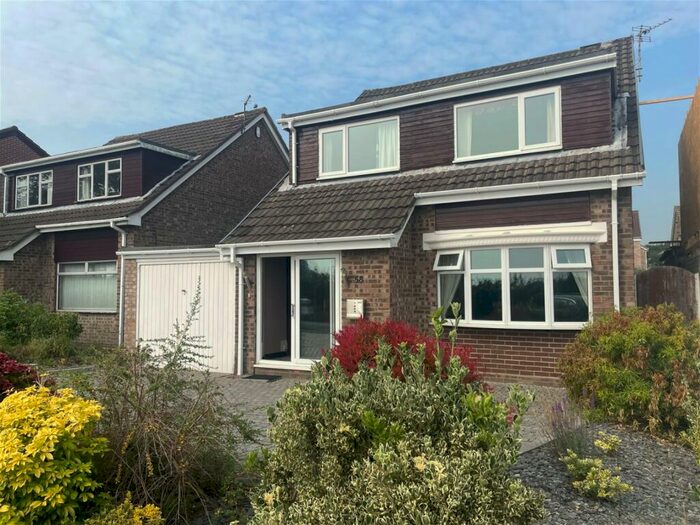
Houses and Flats for sale in L39, Ormskirk

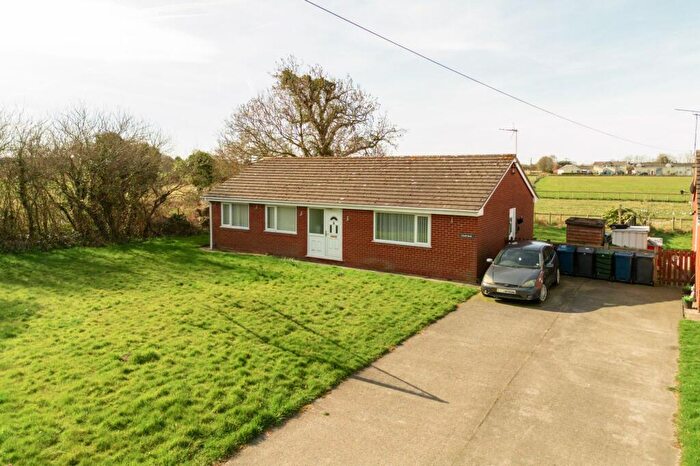
![]()
If you are looking to sell your house, let it out, or receive a property valuation, an expert can help you.
Click the button below to get started.


Frequently Asked Questions about L39
What is the average price for a property for sale in L39?
The average price for a property for sale in L39 is £316,539. There are 169 property listings for sale in L39.
Which areas are included in the L39 postcode district?
The main area within L39 is Ormskirk.
What are the most common property types in L39?
The most common property types in L39 are Semi Detached Houses, Detached Houses, Terraced Houses and Flats.
What has been the average sold property price in L39 over the last three years?
Semi Detached Houses in L39 have an average sold price of £270,687, while Detached Houses have an average of £531,034. Terraced Houses have an average of £202,529 and Flats have an average of £165,922. The average sold property price in L39 over the last three years is approximately £386,553.
Which train stations are available in L39?
The train stations available in L39 are Aughton Park Station, Ormskirk Station and Town Green Station..