
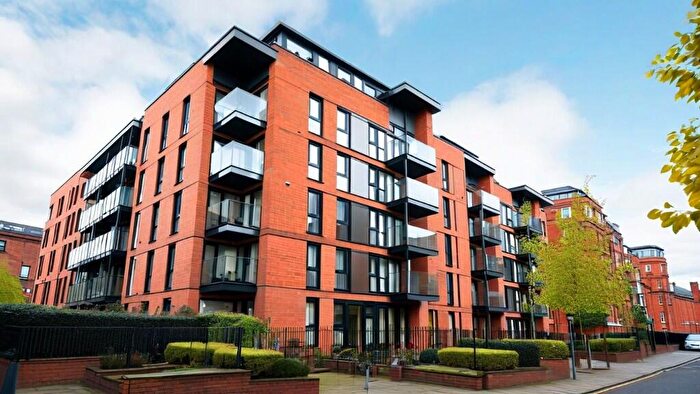
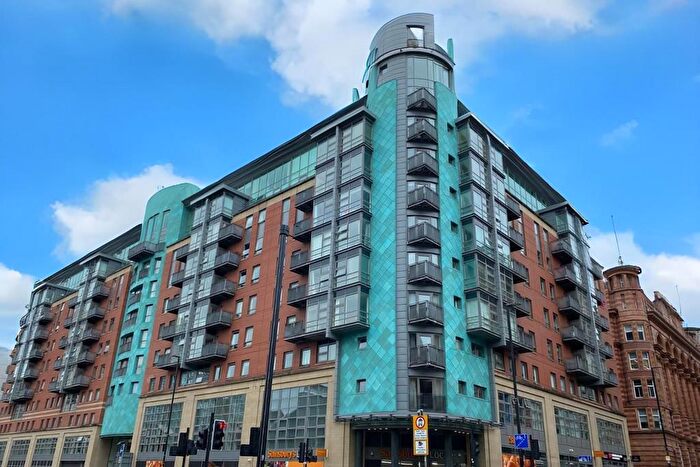
Properties for sale in M1
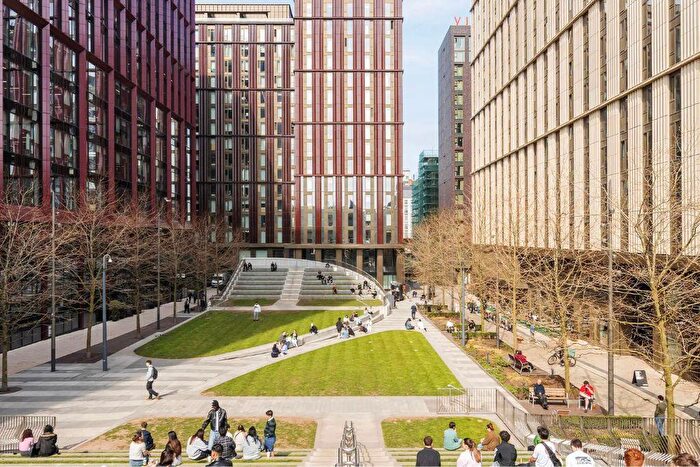
Piccadilly, Northern Quarter, Manchester City Centre
- Info
- Price Paid By Year
- Property Type Price
- Transport
House Prices in M1
Properties in M1 have an average house price of £236,274.00 and had 555 Property Transactions within the last 3 years.
The most expensive property was sold for £665,000.00.
Property Price Paid in M1 by Year
The average sold property price by year was:
| Year | Average Sold Price | Sold Properties |
|---|---|---|
| 2026 | £213,750.00 | 2 Properties |
| 2025 | £235,224.00 | 148 Properties |
| 2024 | £231,283.00 | 225 Properties |
| 2023 | £243,626.00 | 180 Properties |
| 2022 | £246,654.00 | 311 Properties |
| 2021 | £300,733.00 | 305 Properties |
| 2020 | £272,462.00 | 357 Properties |
| 2019 | £212,533.00 | 237 Properties |
| 2018 | £204,977.00 | 453 Properties |
| 2017 | £196,183.00 | 469 Properties |
| 2016 | £216,901.00 | 631 Properties |
| 2015 | £173,071.00 | 411 Properties |
| 2014 | £163,888.00 | 312 Properties |
| 2013 | £153,442.00 | 256 Properties |
| 2012 | £143,100.00 | 203 Properties |
| 2011 | £164,056.00 | 284 Properties |
| 2010 | £156,503.00 | 219 Properties |
| 2009 | £148,100.00 | 215 Properties |
| 2008 | £163,586.00 | 197 Properties |
| 2007 | £180,102.00 | 450 Properties |
| 2006 | £173,411.00 | 599 Properties |
| 2005 | £165,197.00 | 690 Properties |
| 2004 | £174,286.00 | 861 Properties |
| 2003 | £155,526.00 | 704 Properties |
| 2002 | £140,606.00 | 891 Properties |
| 2001 | £119,758.00 | 371 Properties |
| 2000 | £109,053.00 | 392 Properties |
| 1999 | £95,184.00 | 339 Properties |
| 1998 | £85,955.00 | 192 Properties |
| 1997 | £70,890.00 | 115 Properties |
| 1996 | £72,949.00 | 83 Properties |
| 1995 | £64,877.00 | 66 Properties |
Property Price per Property Type in M1
Here you can find historic sold price data in order to help with your property search.
The average Property Paid Price for specific property types in the last three years are:
| Property Type | Average Sold Price | Sold Properties |
|---|---|---|
| Terraced House | £424,305.00 | 7 Terraced Houses |
| Detached House | £140,000.00 | 1 Detached Houses |
| Flat | £234,044.00 | 547 Flats |

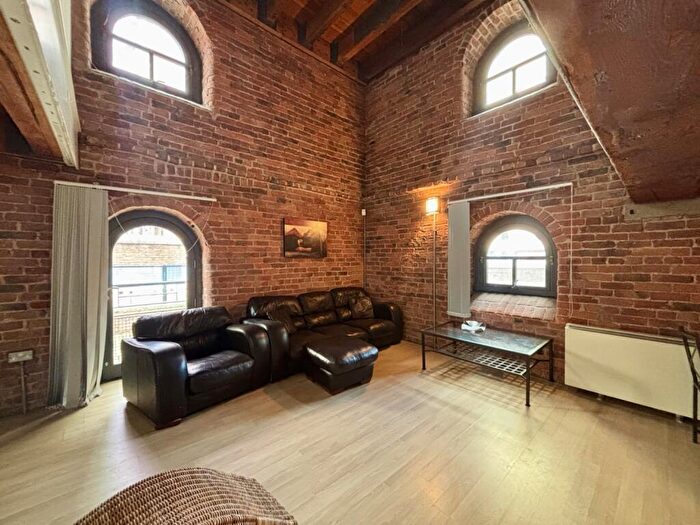
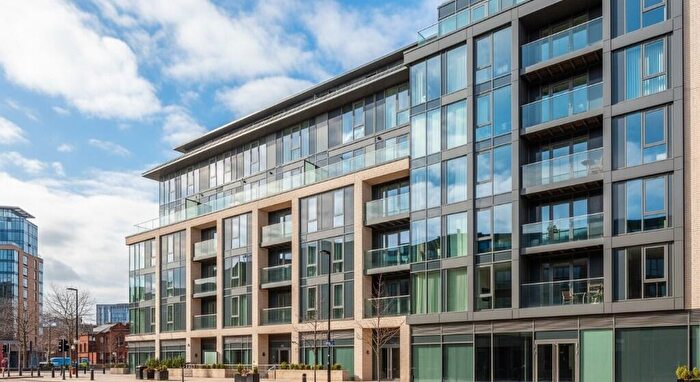
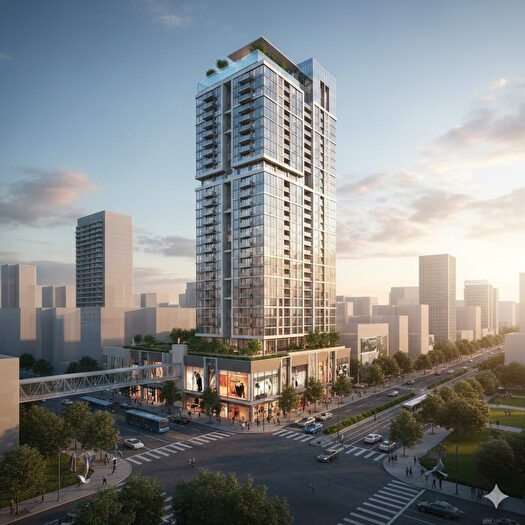
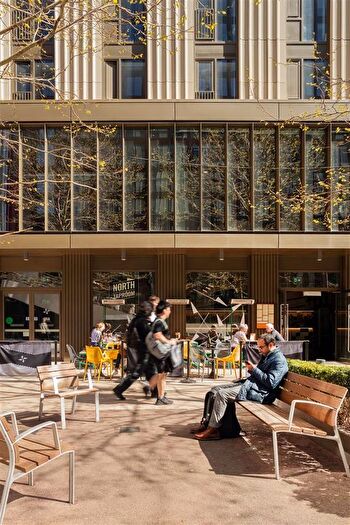
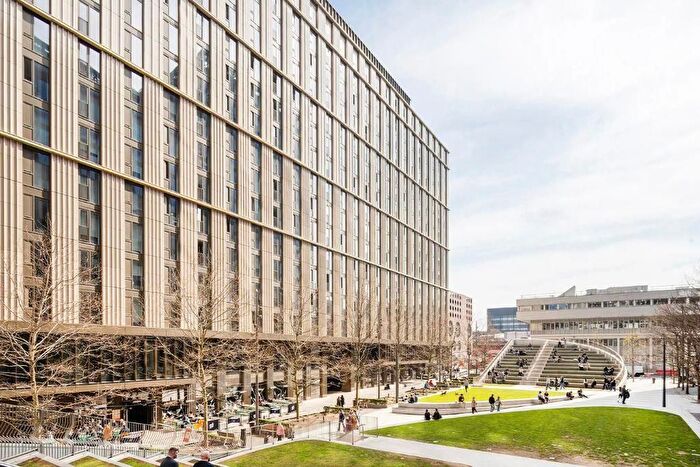
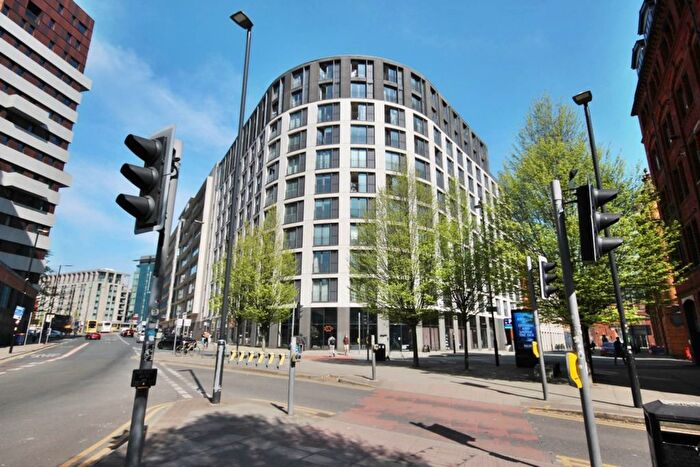
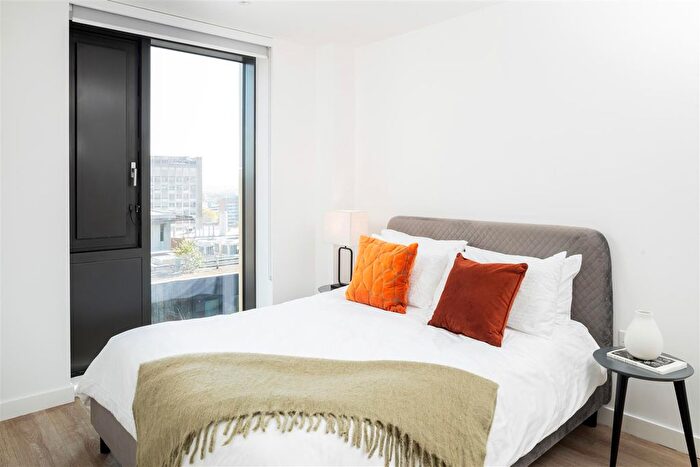
Houses and Flats for sale in M1, Piccadilly, Northern Quarter, Manchester City Centre


![]()
If you are looking to sell your house, let it out, or receive a property valuation, an expert can help you.
Click the button below to get started.


Frequently Asked Questions about M1
What is the average price for a property for sale in M1?
The average price for a property for sale in M1 is £236,274. There are 564 property listings for sale in M1.
Which areas are included in the M1 postcode district?
The main areas within M1 include Piccadilly, Northern Quarter and Manchester City Centre.
What are the most common property types in M1?
The most common property types in M1 are Flats, Terraced Houses and Detached Houses.
What has been the average sold property price in M1 over the last three years?
Flats in M1 have an average sold price of £234,044, while Terraced Houses have an average of £424,305. Detached Houses have an average of £140,000. The average sold property price in M1 over the last three years is approximately £226,752.
Which train stations are available in M1?
The train stations available in M1 are Ardwick Station, Ashburys Station, Belle Vue Station, Gorton Station, Levenshulme Station, Manchester Oxford Road Station, Manchester United Football Ground Station, Mauldeth Road Station and Ryder Brow Station..