
Properties for sale in N17
Tottenham, South Tottenham
- Info
- Price Paid By Year
- Property Type Price
- Transport
House Prices in N17
Properties in N17 have an average house price of £453,915.00 and had 1172 Property Transactions within the last 3 years.
The most expensive property was sold for £5,270,000.00.
Property Price Paid in N17 by Year
The average sold property price by year was:
| Year | Average Sold Price | Sold Properties |
|---|---|---|
| 2025 | £454,464.00 | 355 Properties |
| 2024 | £440,148.00 | 422 Properties |
| 2023 | £468,129.00 | 395 Properties |
| 2022 | £461,817.00 | 453 Properties |
| 2021 | £444,300.00 | 505 Properties |
| 2020 | £406,779.00 | 408 Properties |
| 2019 | £396,953.00 | 395 Properties |
| 2018 | £394,216.00 | 378 Properties |
| 2017 | £402,571.00 | 401 Properties |
| 2016 | £350,445.00 | 654 Properties |
| 2015 | £311,408.00 | 656 Properties |
| 2014 | £280,434.00 | 553 Properties |
| 2013 | £229,721.00 | 397 Properties |
| 2012 | £211,549.00 | 338 Properties |
| 2011 | £208,137.00 | 307 Properties |
| 2010 | £209,245.00 | 359 Properties |
| 2009 | £193,238.00 | 276 Properties |
| 2008 | £214,287.00 | 388 Properties |
| 2007 | £213,349.00 | 819 Properties |
| 2006 | £189,123.00 | 840 Properties |
| 2005 | £176,131.00 | 668 Properties |
| 2004 | £168,610.00 | 803 Properties |
| 2003 | £158,482.00 | 809 Properties |
| 2002 | £132,307.00 | 842 Properties |
| 2001 | £109,953.00 | 877 Properties |
| 2000 | £97,130.00 | 919 Properties |
| 1999 | £78,651.00 | 885 Properties |
| 1998 | £69,643.00 | 702 Properties |
| 1997 | £61,495.00 | 776 Properties |
| 1996 | £52,363.00 | 612 Properties |
| 1995 | £51,068.00 | 628 Properties |
Property Price per Property Type in N17
Here you can find historic sold price data in order to help with your property search.
The average Property Paid Price for specific property types in the last three years are:
| Property Type | Average Sold Price | Sold Properties |
|---|---|---|
| Semi Detached House | £526,287.00 | 35 Semi Detached Houses |
| Terraced House | £555,481.00 | 579 Terraced Houses |
| Detached House | £1,516,916.00 | 6 Detached Houses |
| Flat | £331,237.00 | 552 Flats |


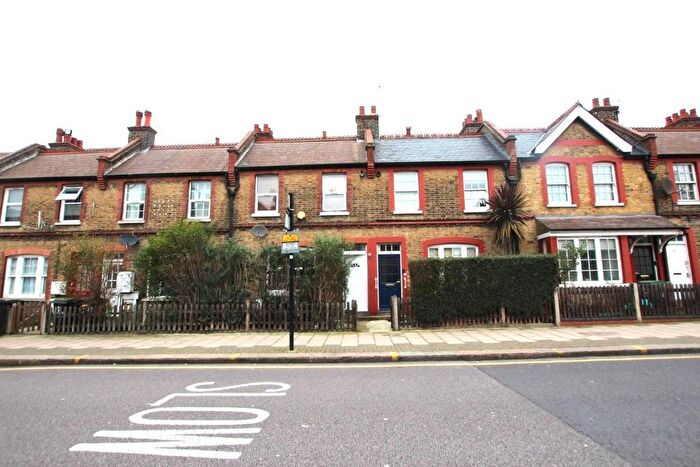
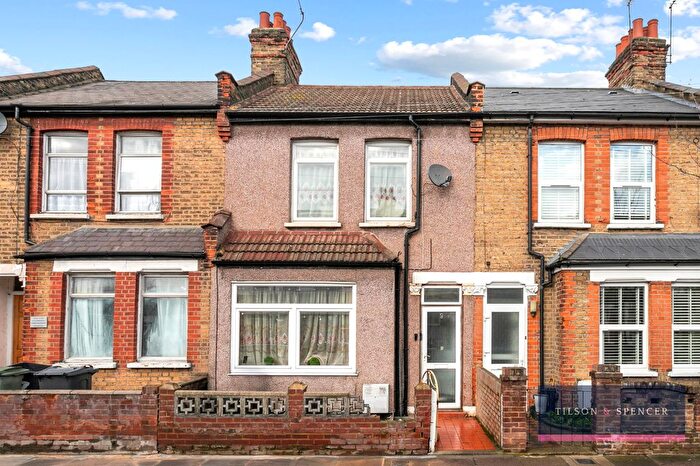
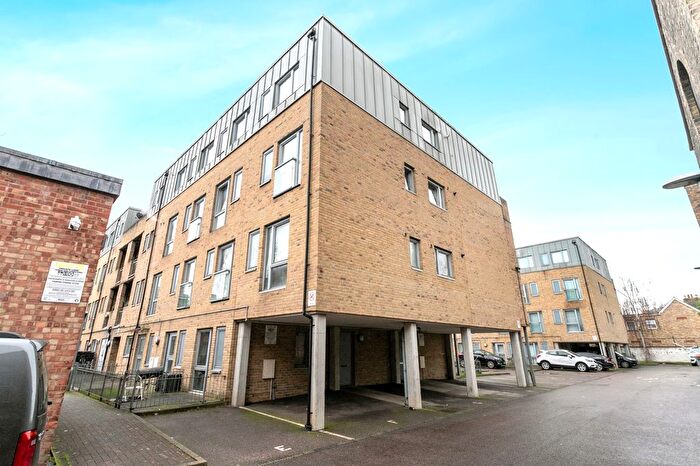
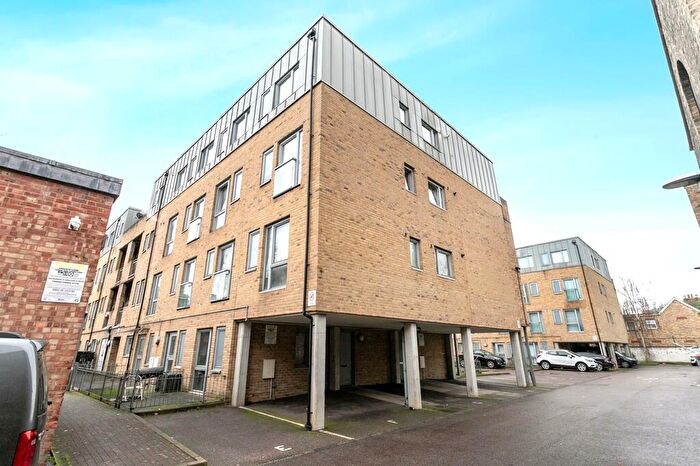
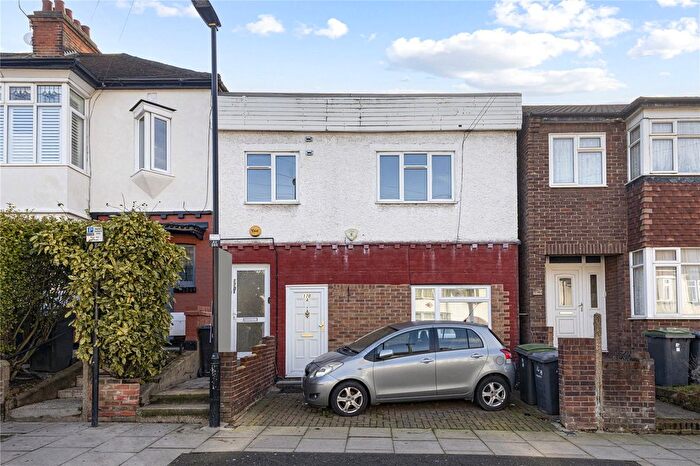
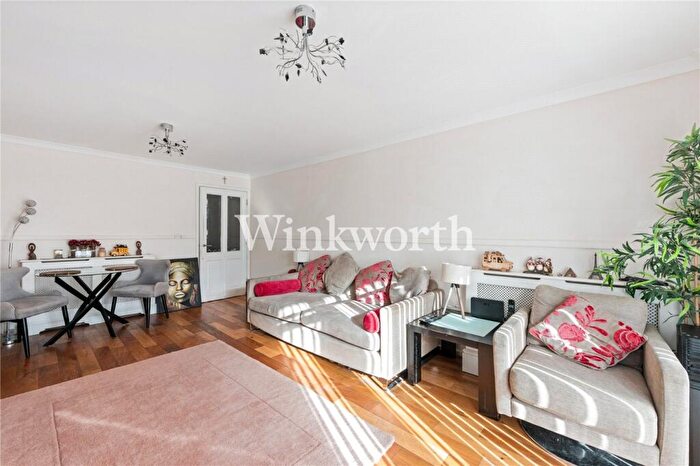
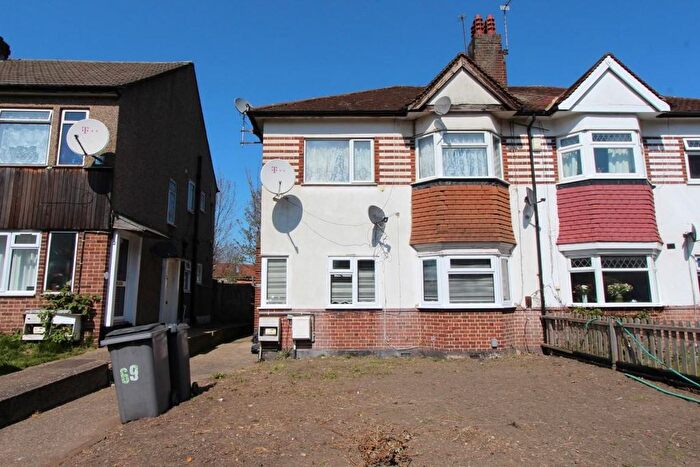
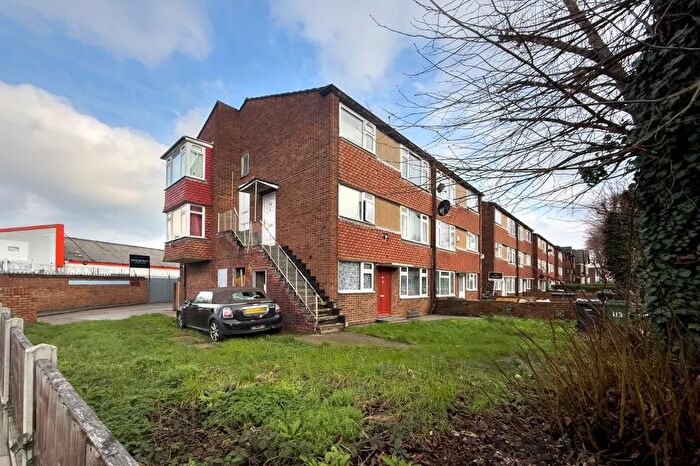
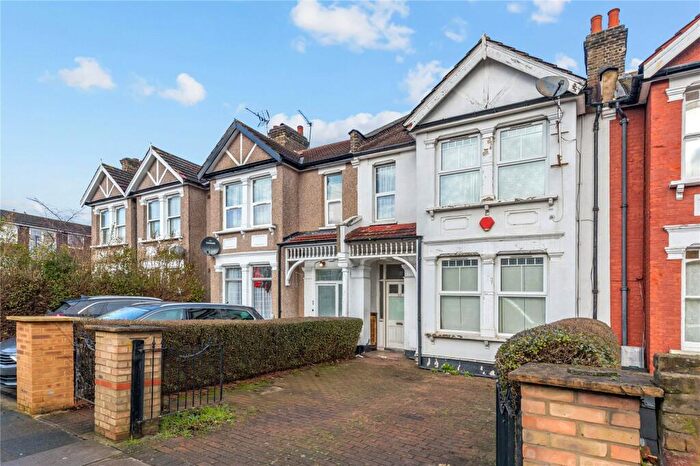
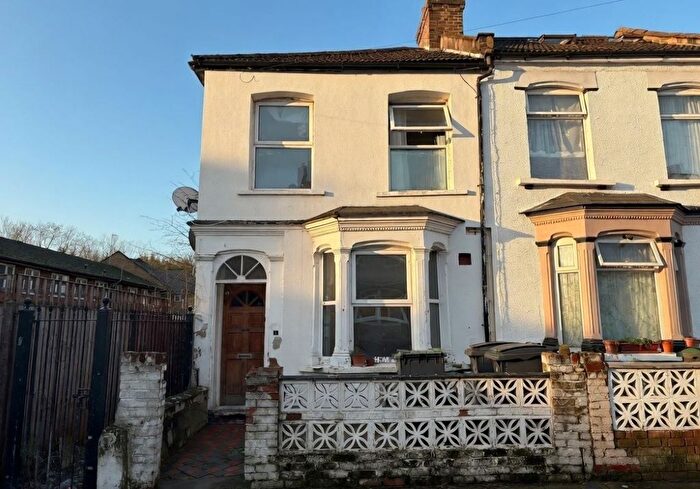
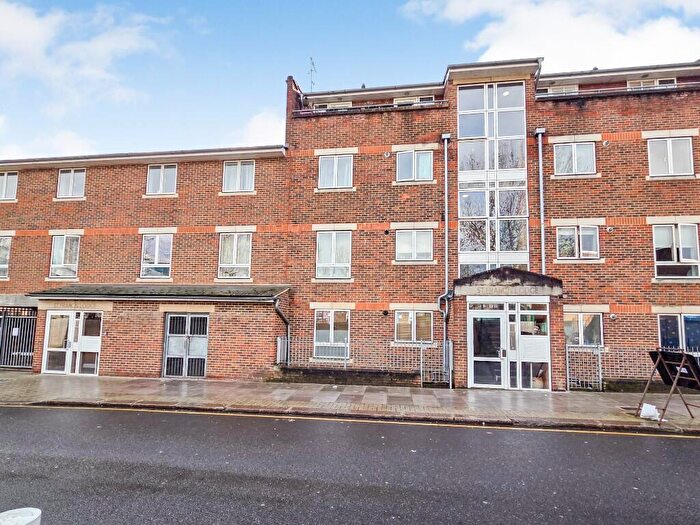
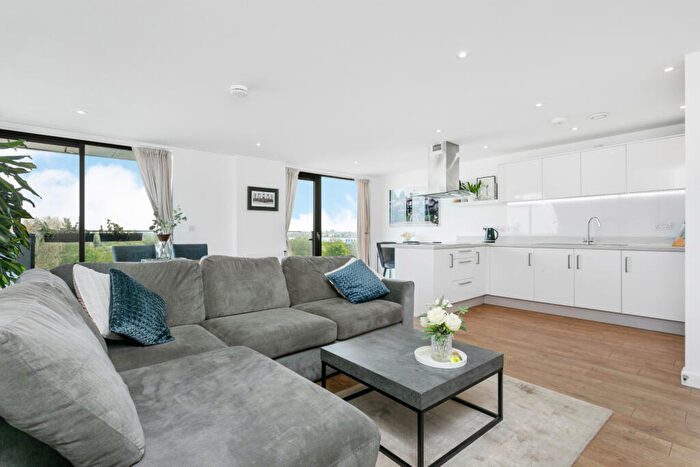
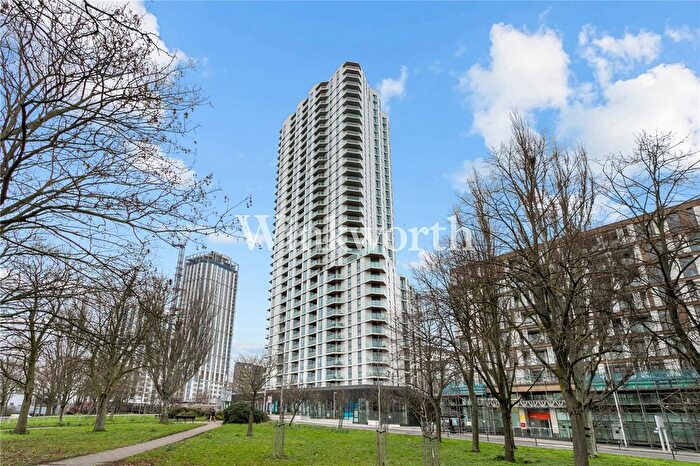
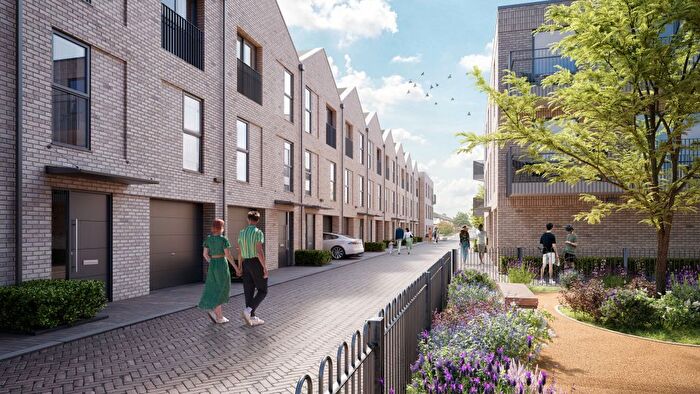
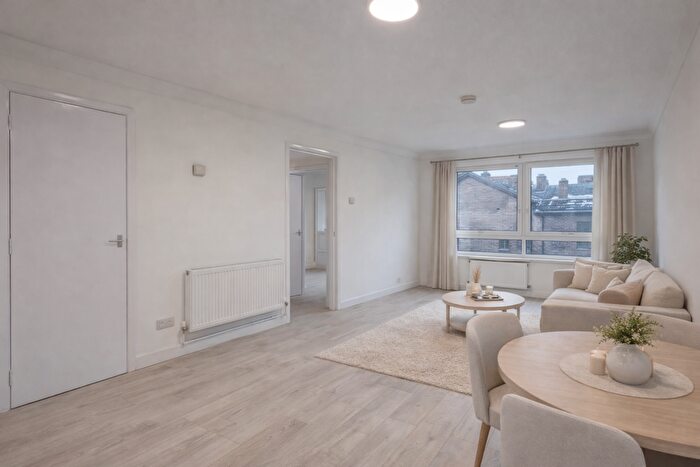
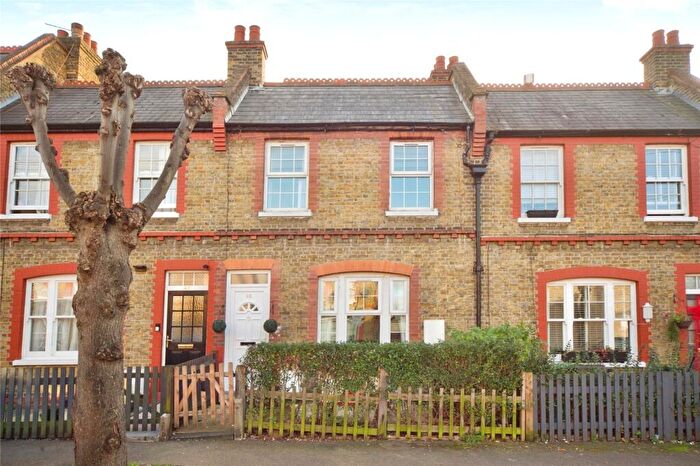
Houses and Flats for sale in N17, Tottenham, South Tottenham
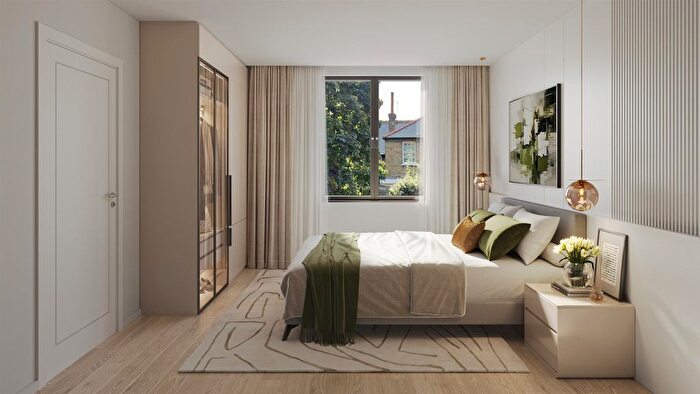
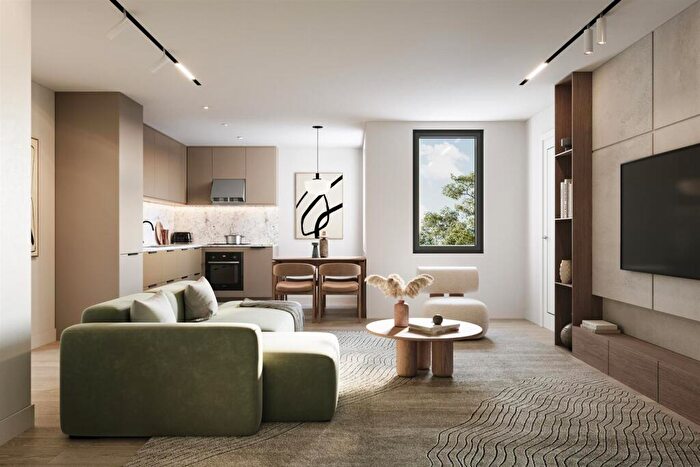
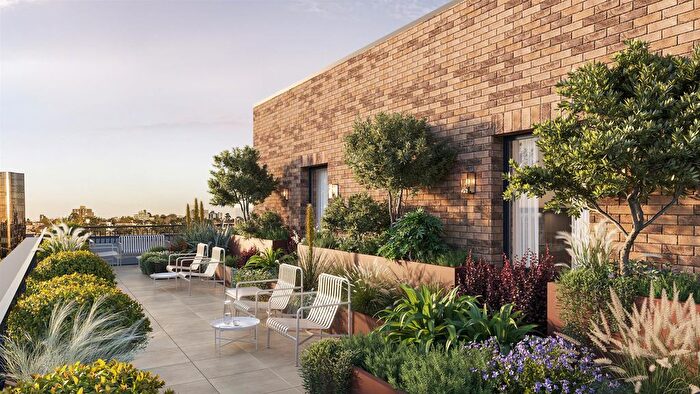
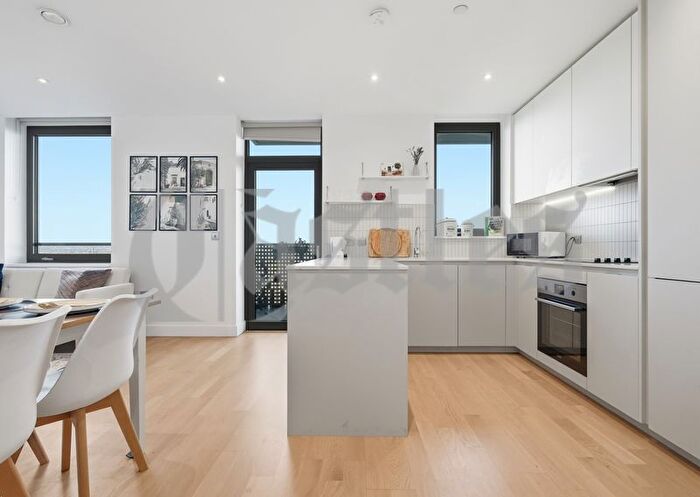
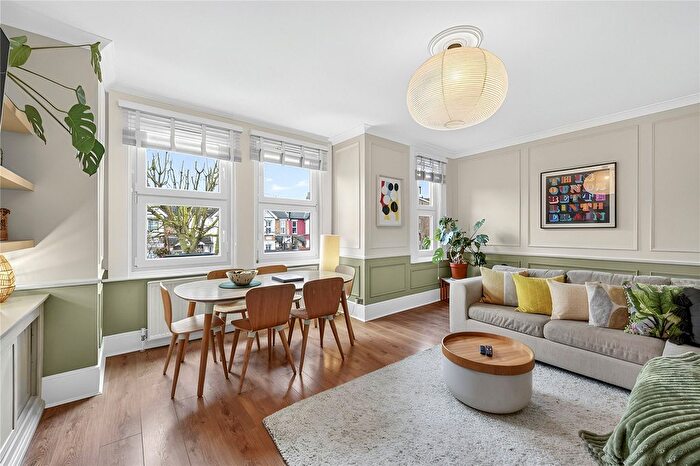
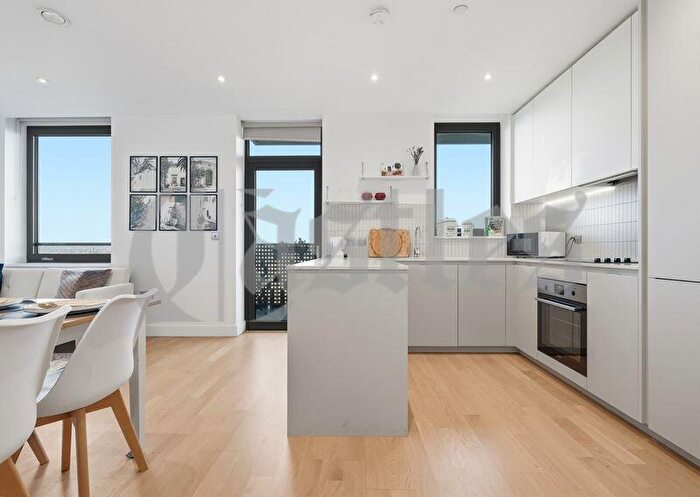
![]()
If you are looking to sell your house, let it out, or receive a property valuation, an expert can help you.
Click the button below to get started.


Frequently Asked Questions about N17
What is the average price for a property for sale in N17?
The average price for a property for sale in N17 is £453,915. There are 257 property listings for sale in N17.
Which areas are included in the N17 postcode district?
The main areas within N17 include Tottenham and South Tottenham.
What are the most common property types in N17?
The most common property types in N17 are Terraced Houses, Flats, Semi Detached Houses and Detached Houses.
What has been the average sold property price in N17 over the last three years?
Terraced Houses in N17 have an average sold price of £555,481, while Flats have an average of £331,237. Semi Detached Houses have an average of £526,287 and Detached Houses have an average of £1,516,916. The average sold property price in N17 over the last three years is approximately £454,247.
Which train stations are available in N17?
The train stations available in N17 are Bruce Grove Station, Northumberland Park Station, Tottenham Hale Station and White Hart Lane Station..
Which tube stations are available in N17?
The tube stations available in N17 are South Tottenham Station, Bruce Grove Station, Northumberland Park Station, Tottenham Hale Station and White Hart Lane Station.