
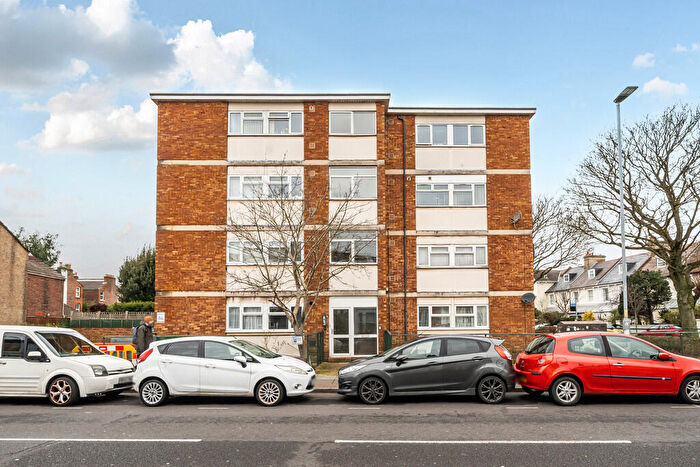
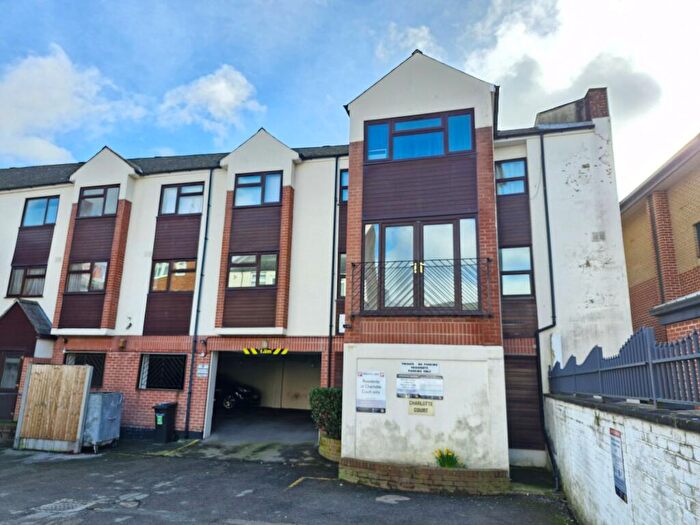
Properties for sale in PO5
Southsea
- Info
- Price Paid By Year
- Property Type Price
- Transport
House Prices in PO5
Properties in PO5 have an average house price of £269,879.00 and had 1023 Property Transactions within the last 3 years.
The most expensive property was sold for £2,200,000.00.
Property Price Paid in PO5 by Year
The average sold property price by year was:
| Year | Average Sold Price | Sold Properties |
|---|---|---|
| 2025 | £281,471.00 | 301 Properties |
| 2024 | £264,605.00 | 377 Properties |
| 2023 | £265,527.00 | 345 Properties |
| 2022 | £290,573.00 | 487 Properties |
| 2021 | £267,508.00 | 584 Properties |
| 2020 | £253,382.00 | 403 Properties |
| 2019 | £243,790.00 | 455 Properties |
| 2018 | £235,713.00 | 483 Properties |
| 2017 | £217,785.00 | 526 Properties |
| 2016 | £204,808.00 | 562 Properties |
| 2015 | £201,628.00 | 566 Properties |
| 2014 | £189,043.00 | 558 Properties |
| 2013 | £172,865.00 | 415 Properties |
| 2012 | £178,601.00 | 322 Properties |
| 2011 | £173,414.00 | 296 Properties |
| 2010 | £178,034.00 | 311 Properties |
| 2009 | £156,594.00 | 356 Properties |
| 2008 | £168,986.00 | 406 Properties |
| 2007 | £179,279.00 | 787 Properties |
| 2006 | £162,243.00 | 870 Properties |
| 2005 | £157,524.00 | 642 Properties |
| 2004 | £150,380.00 | 744 Properties |
| 2003 | £142,250.00 | 807 Properties |
| 2002 | £117,560.00 | 1,000 Properties |
| 2001 | £97,135.00 | 914 Properties |
| 2000 | £82,526.00 | 856 Properties |
| 1999 | £70,072.00 | 914 Properties |
| 1998 | £62,745.00 | 756 Properties |
| 1997 | £59,762.00 | 821 Properties |
| 1996 | £50,736.00 | 633 Properties |
| 1995 | £50,772.00 | 493 Properties |
Property Price per Property Type in PO5
Here you can find historic sold price data in order to help with your property search.
The average Property Paid Price for specific property types in the last three years are:
| Property Type | Average Sold Price | Sold Properties |
|---|---|---|
| Semi Detached House | £577,809.00 | 72 Semi Detached Houses |
| Detached House | £778,931.00 | 22 Detached Houses |
| Terraced House | £346,491.00 | 315 Terraced Houses |
| Flat | £176,225.00 | 614 Flats |
Transport near PO5

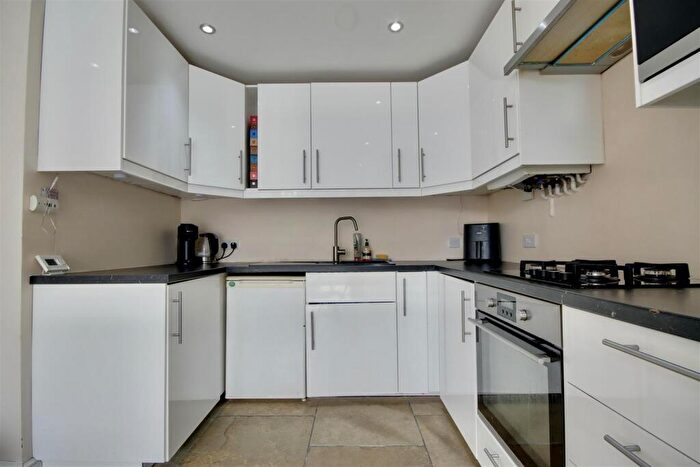
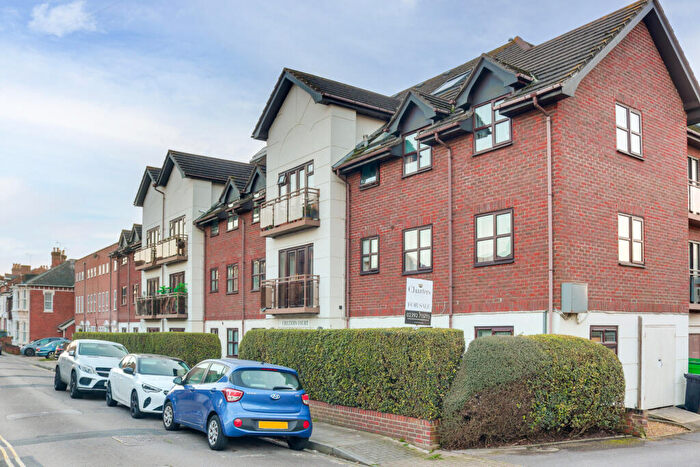
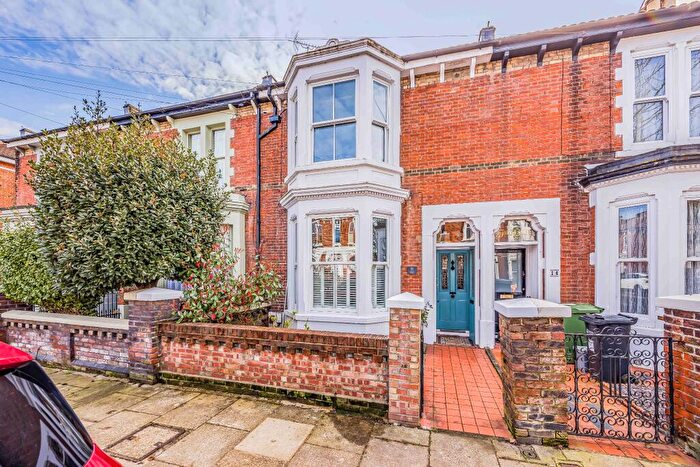
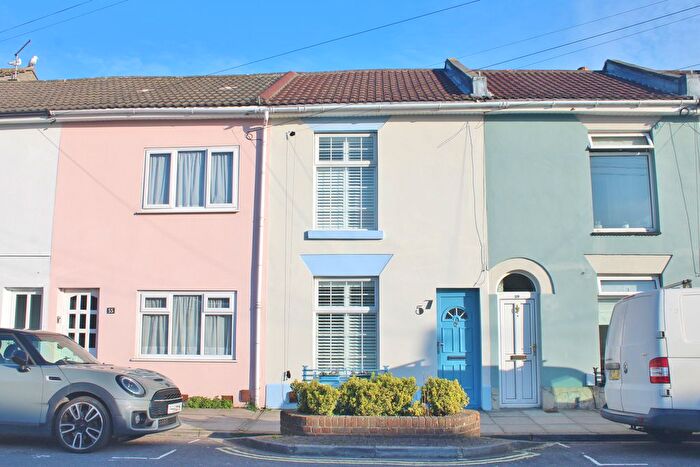
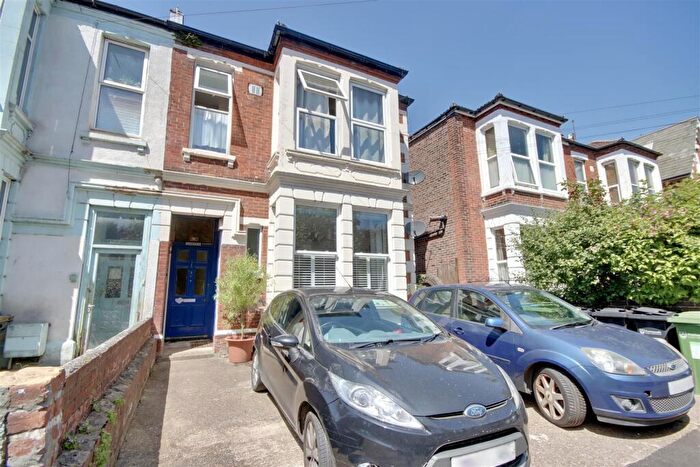
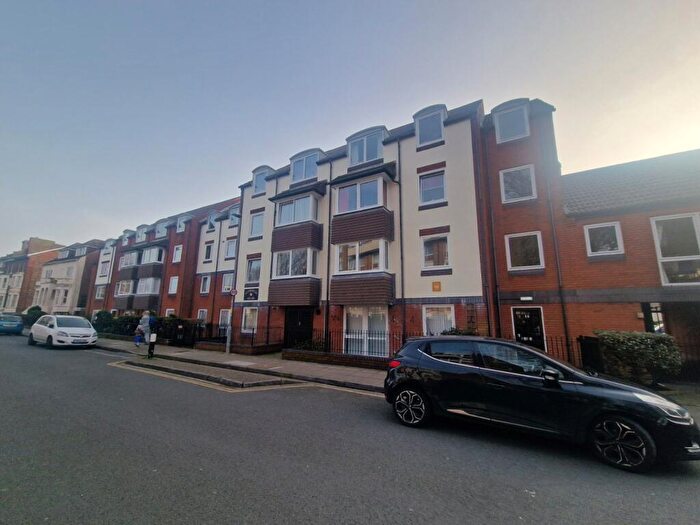
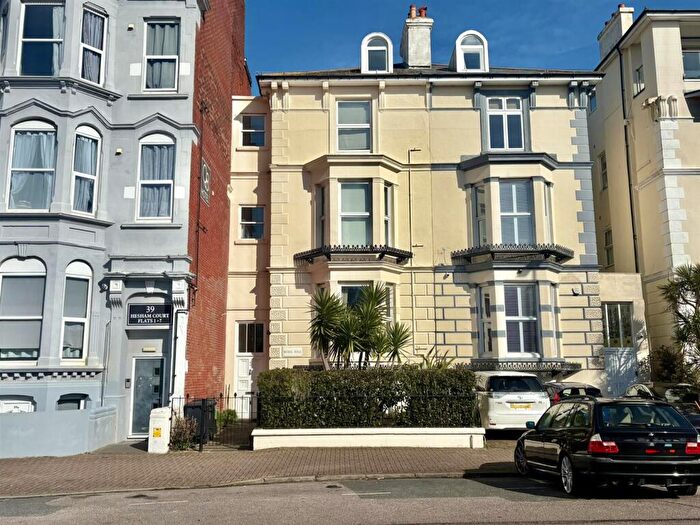
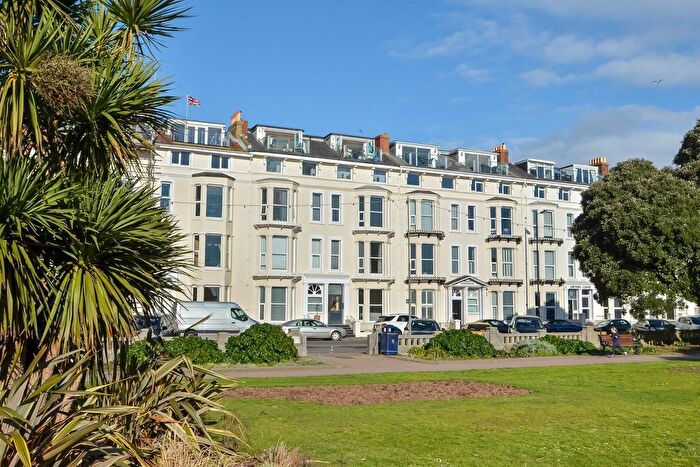
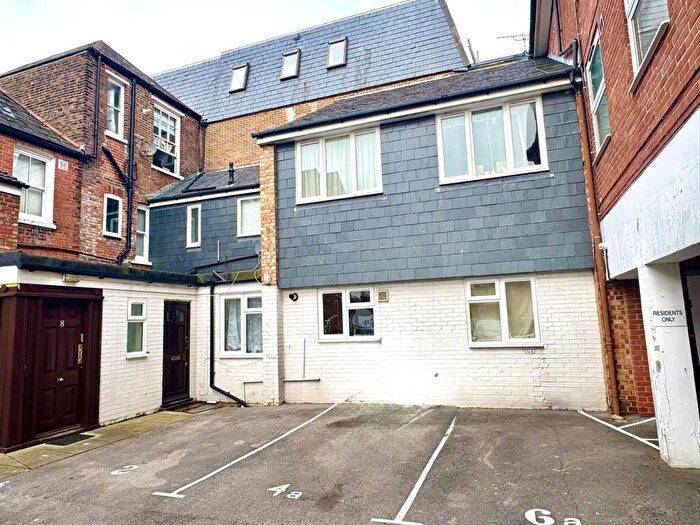
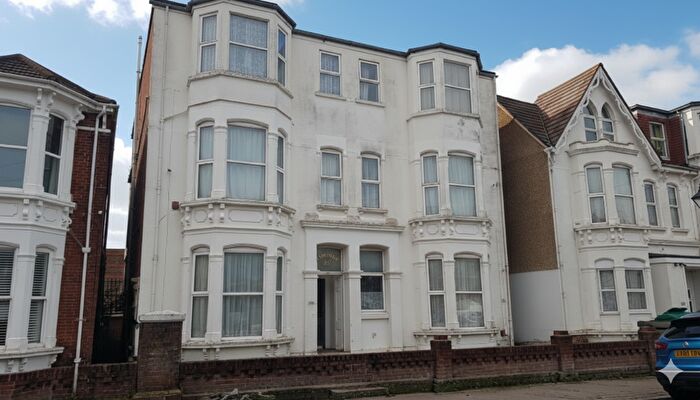
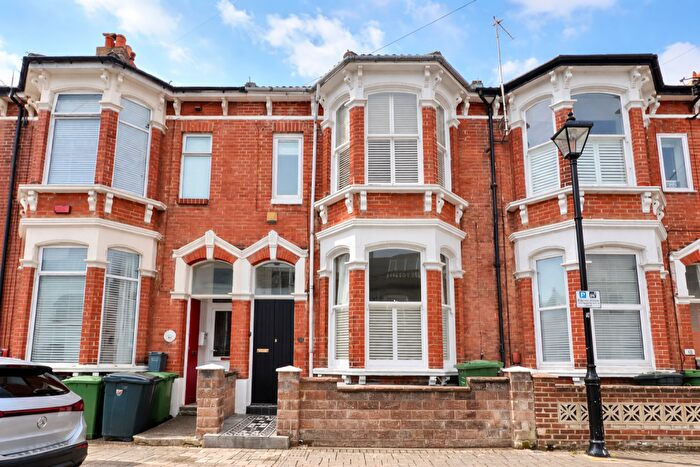
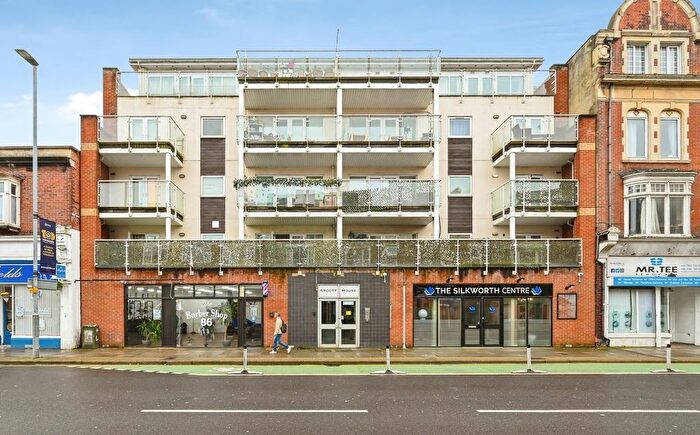
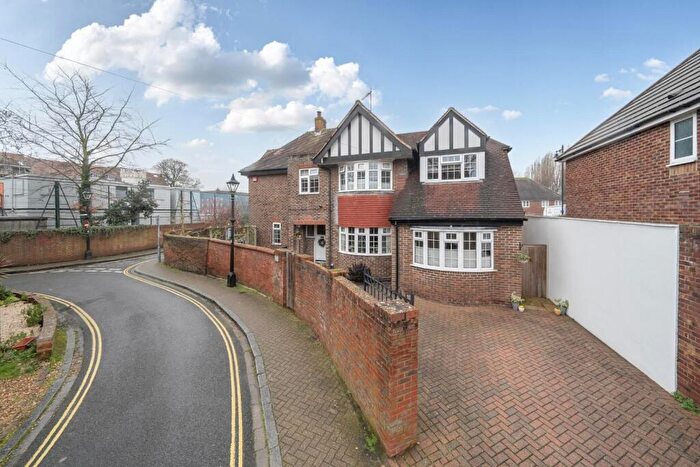
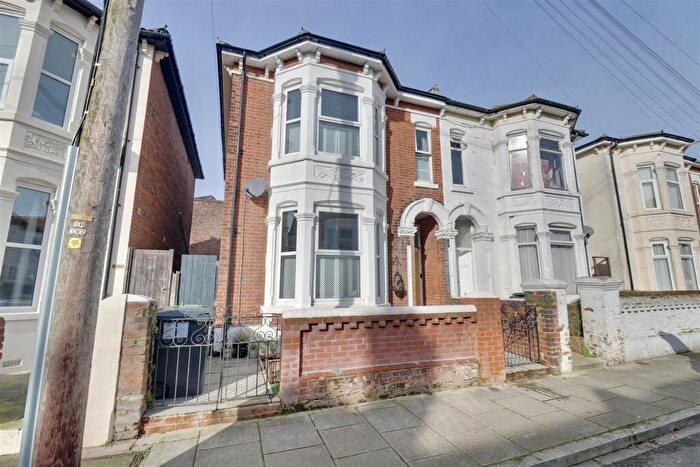
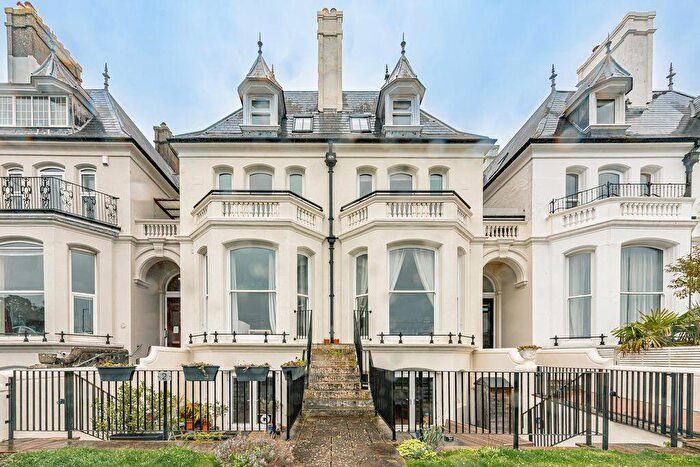
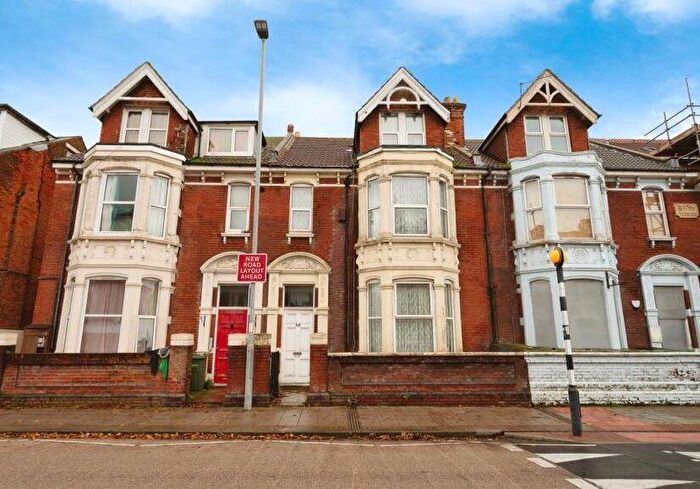
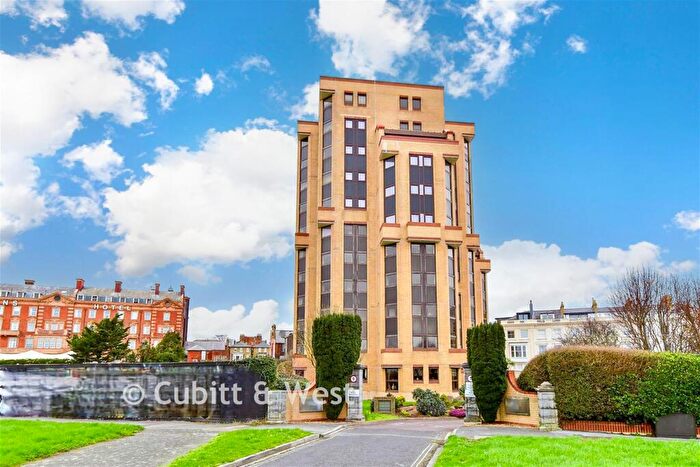
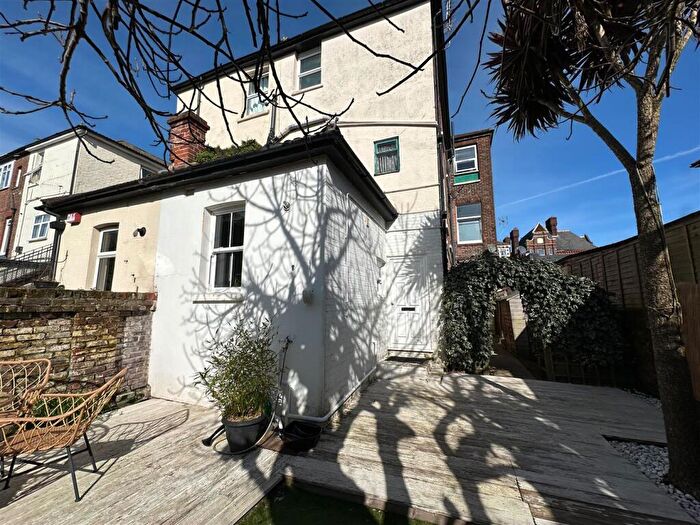
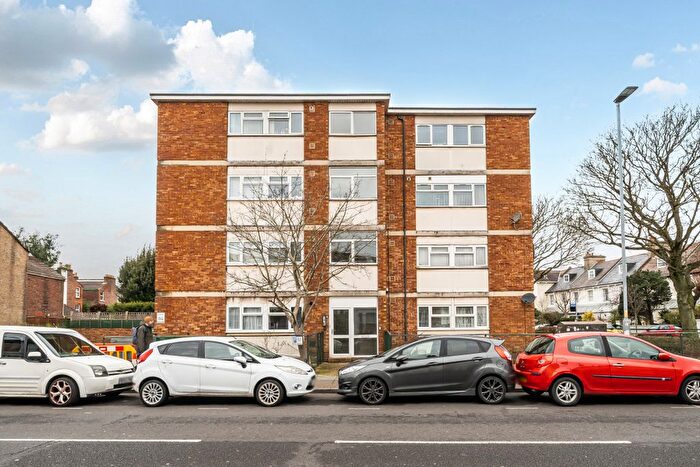
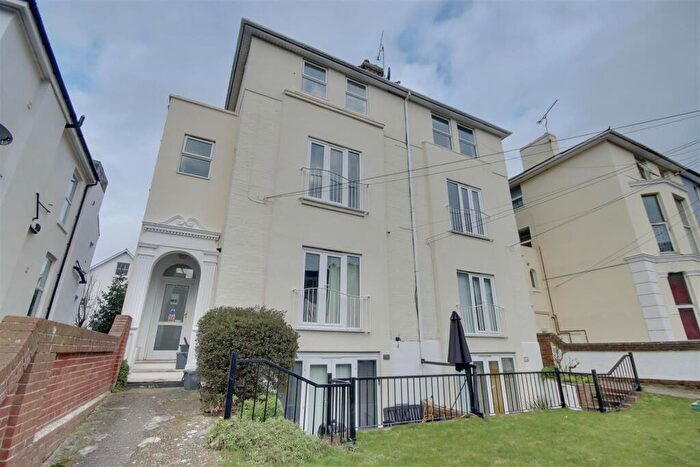
Houses and Flats for sale in PO5, Southsea

![]()
If you are looking to sell your house, let it out, or receive a property valuation, an expert can help you.
Click the button below to get started.

Frequently Asked Questions about PO5
What is the average price for a property for sale in PO5?
The average price for a property for sale in PO5 is £269,879. There are 286 property listings for sale in PO5.
Which areas are included in the PO5 postcode district?
The main area within PO5 is Southsea.
What are the most common property types in PO5?
The most common property types in PO5 are Flats, Terraced Houses, Semi Detached Houses and Detached Houses.
What has been the average sold property price in PO5 over the last three years?
Flats in PO5 have an average sold price of £176,225, while Terraced Houses have an average of £346,491. Semi Detached Houses have an average of £577,809 and Detached Houses have an average of £778,931. The average sold property price in PO5 over the last three years is approximately £270,534.