
Properties for sale in SL1
Burnham, Littleworth, Salt Hill, Slough, Upton, Cippenham
- Info
- Price Paid By Year
- Property Type Price
- Transport
House Prices in SL1
Properties in SL1 have an average house price of £384,298.00 and had 1810 Property Transactions within the last 3 years.
The most expensive property was sold for £3,900,000.00.
Property Price Paid in SL1 by Year
The average sold property price by year was:
| Year | Average Sold Price | Sold Properties |
|---|---|---|
| 2025 | £398,247.00 | 518 Properties |
| 2024 | £374,733.00 | 672 Properties |
| 2023 | £383,013.00 | 620 Properties |
| 2022 | £389,065.00 | 837 Properties |
| 2021 | £363,743.00 | 1,002 Properties |
| 2020 | £351,591.00 | 595 Properties |
| 2019 | £323,505.00 | 845 Properties |
| 2018 | £319,031.00 | 992 Properties |
| 2017 | £321,449.00 | 1,089 Properties |
| 2016 | £303,803.00 | 1,178 Properties |
| 2015 | £269,743.00 | 1,035 Properties |
| 2014 | £246,131.00 | 1,002 Properties |
| 2013 | £232,537.00 | 751 Properties |
| 2012 | £233,490.00 | 673 Properties |
| 2011 | £229,962.00 | 717 Properties |
| 2010 | £230,240.00 | 661 Properties |
| 2009 | £201,351.00 | 634 Properties |
| 2008 | £224,702.00 | 874 Properties |
| 2007 | £218,218.00 | 1,603 Properties |
| 2006 | £196,650.00 | 1,715 Properties |
| 2005 | £189,580.00 | 1,380 Properties |
| 2004 | £178,858.00 | 1,639 Properties |
| 2003 | £169,453.00 | 1,545 Properties |
| 2002 | £145,394.00 | 1,785 Properties |
| 2001 | £124,137.00 | 1,696 Properties |
| 2000 | £114,792.00 | 1,819 Properties |
| 1999 | £100,514.00 | 1,810 Properties |
| 1998 | £90,905.00 | 1,666 Properties |
| 1997 | £77,745.00 | 1,603 Properties |
| 1996 | £65,585.00 | 1,302 Properties |
| 1995 | £64,604.00 | 905 Properties |
Property Price per Property Type in SL1
Here you can find historic sold price data in order to help with your property search.
The average Property Paid Price for specific property types in the last three years are:
| Property Type | Average Sold Price | Sold Properties |
|---|---|---|
| Semi Detached House | £453,599.00 | 477 Semi Detached Houses |
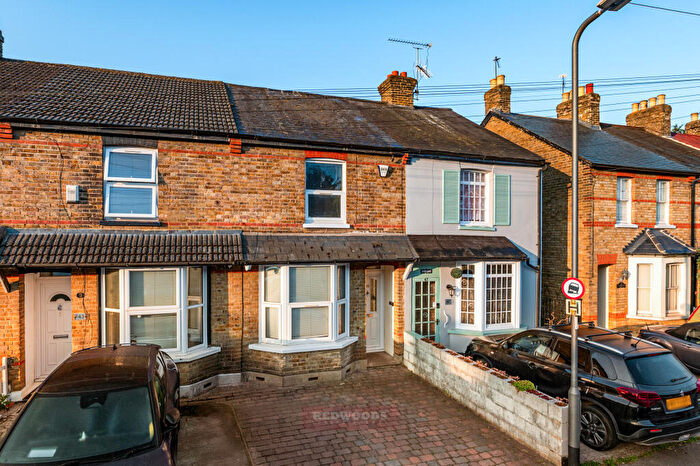
| Terraced House | £383,470.00 | 455 Terraced Houses |
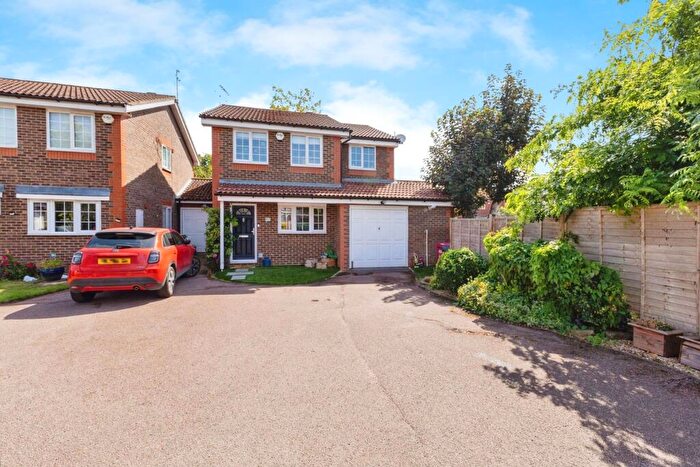
| Detached House | £700,473.00 | 223 Detached Houses |
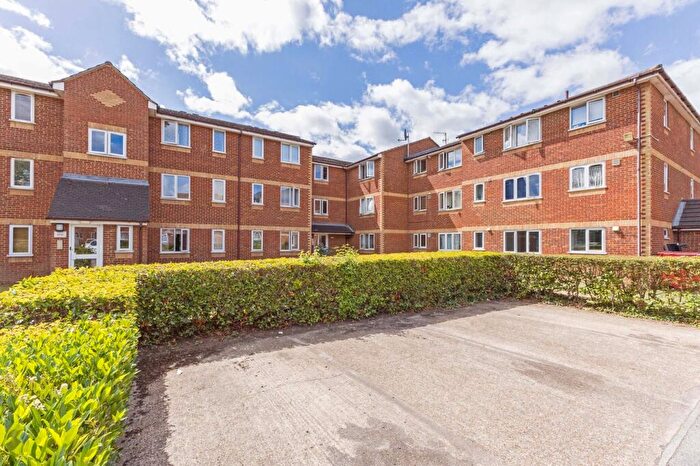
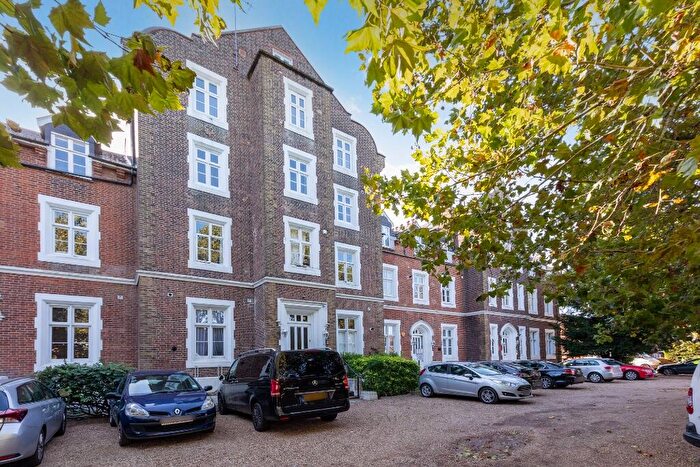
| Flat | £226,762.00 | 655 Flats |


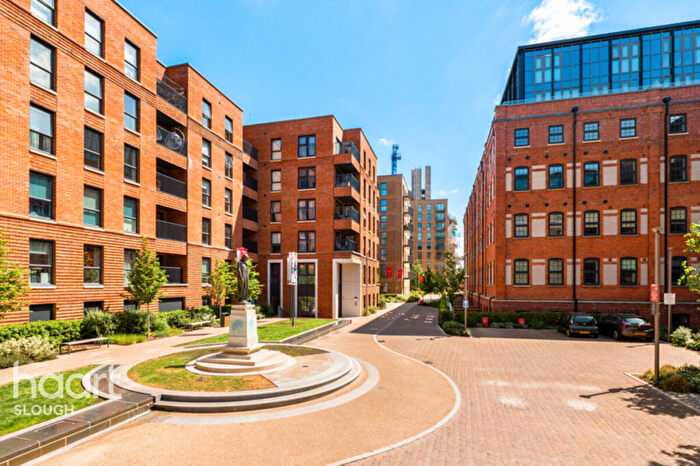
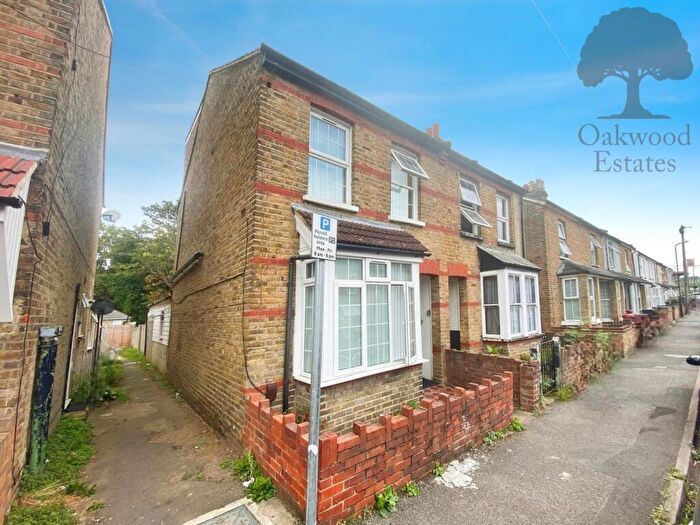
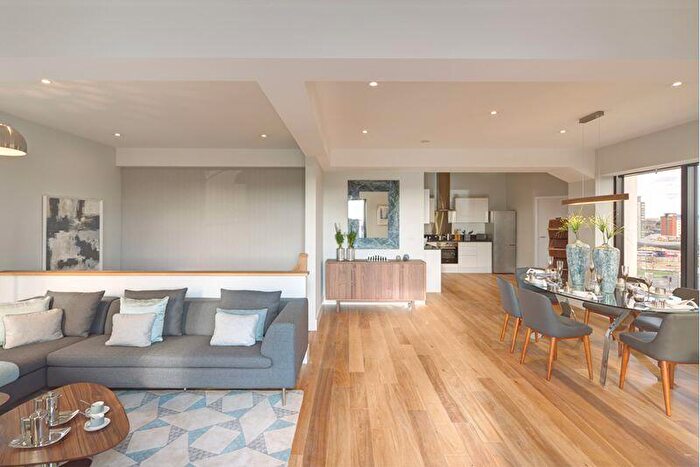
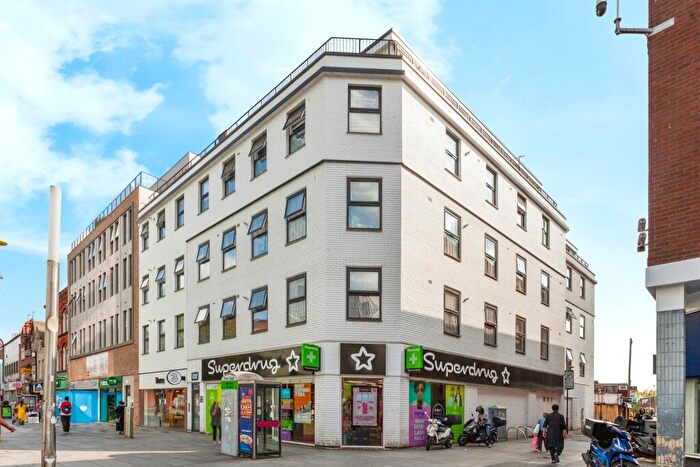
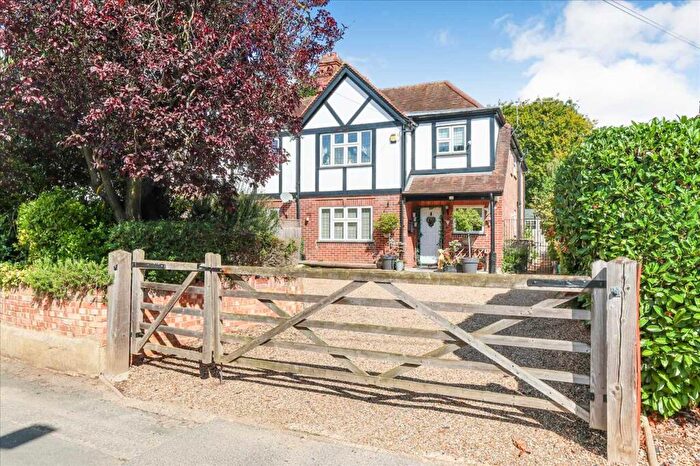
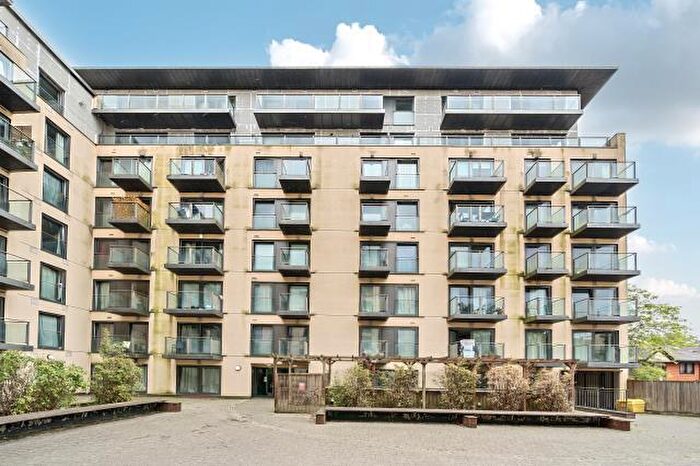
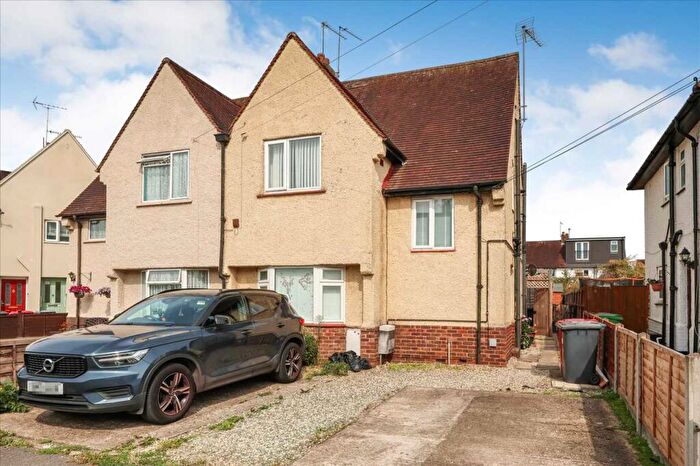
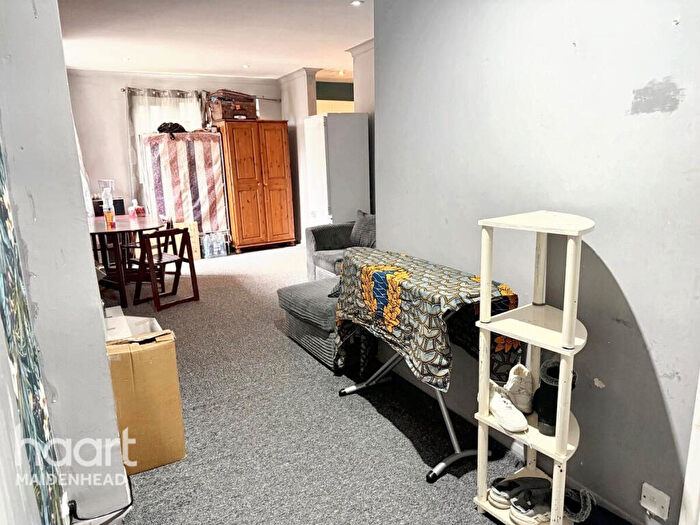
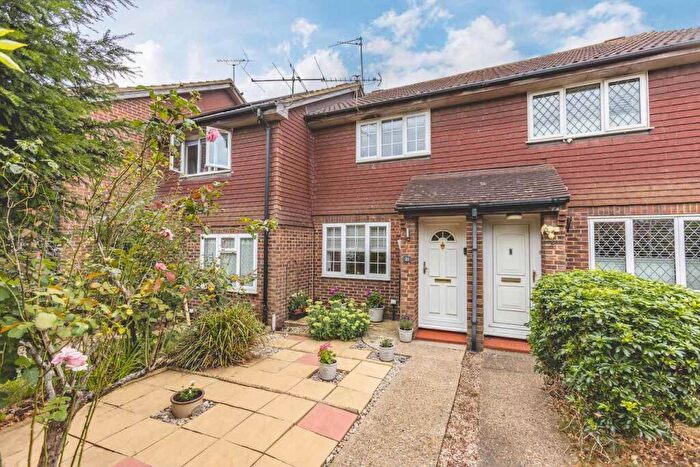
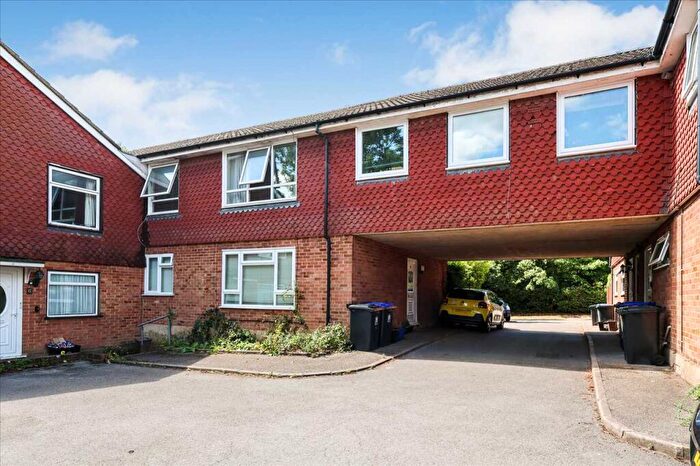
Houses and Flats for sale in SL1, Burnham, Littleworth, Salt Hill, Slough
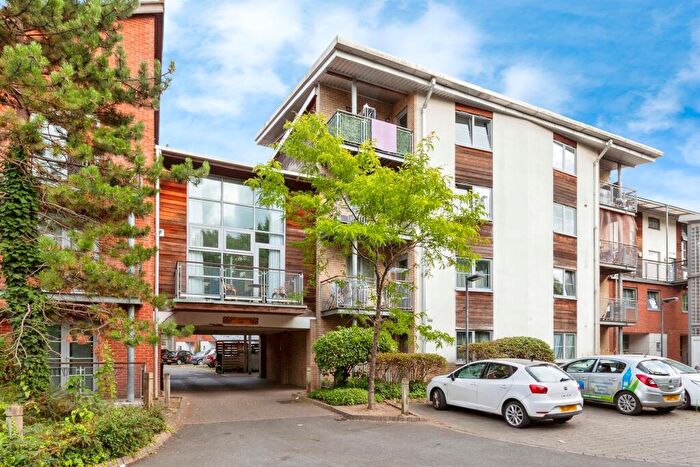
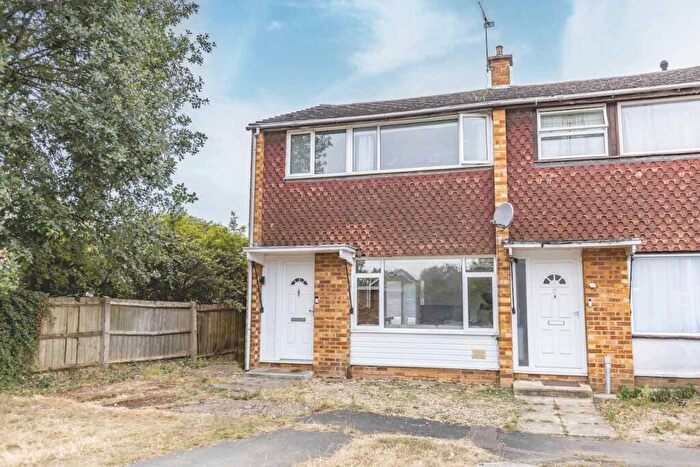


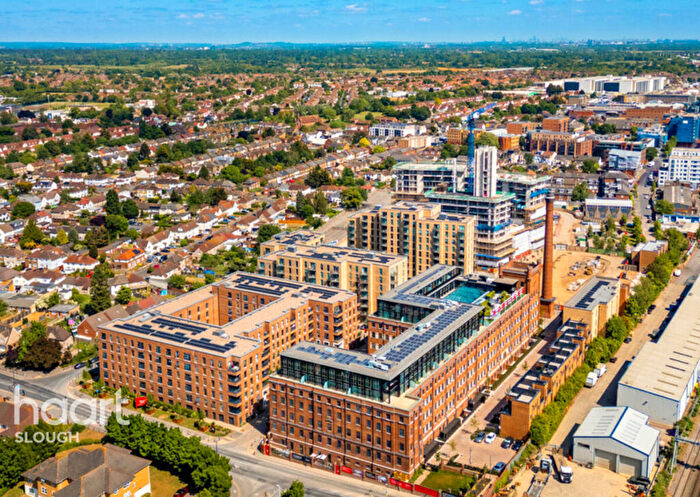
![]()
If you are looking to sell your house, let it out, or receive a property valuation, an expert can help you.
Click the button below to get started.
Frequently Asked Questions about SL1
What is the average price for a property for sale in SL1?
The average price for a property for sale in SL1 is £384,298. There are 489 property listings for sale in SL1.
Which areas are included in the SL1 postcode district?
The main areas within SL1 include Burnham, Littleworth, Salt Hill, Slough, Upton and Cippenham.
What are the most common property types in SL1?
The most common property types in SL1 are Flats, Semi Detached Houses, Terraced Houses and Detached Houses.
What has been the average sold property price in SL1 over the last three years?
Flats in SL1 have an average sold price of £226,762, while Semi Detached Houses have an average of £453,599. Terraced Houses have an average of £383,470 and Detached Houses have an average of £700,473. The average sold property price in SL1 over the last three years is approximately £385,331.
Which train stations are available in SL1?
The train stations available in SL1 are Burnham Station and Slough Station..
Which tube stations are available in SL1?
The tube station available in SL1 is Burnham Station.