
Properties for sale in SW1W
Belgravia
- Info
- Price Paid By Year
- Property Type Price
- Transport
House Prices in SW1W
Properties in SW1W have an average house price of £3,080,206.00 and had 348 Property Transactions within the last 3 years.
The most expensive property was sold for £30,500,000.00.
Property Price Paid in SW1W by Year
The average sold property price by year was:
| Year | Average Sold Price | Sold Properties |
|---|---|---|
| 2026 | £575,000.00 | 1 Properties |
| 2025 | £3,124,893.00 | 76 Properties |
| 2024 | £2,919,604.00 | 128 Properties |
| 2023 | £3,217,732.00 | 143 Properties |
| 2022 | £4,236,231.00 | 136 Properties |
| 2021 | £3,803,660.00 | 154 Properties |
| 2020 | £3,899,080.00 | 148 Properties |
| 2019 | £3,775,295.00 | 146 Properties |
| 2018 | £2,383,068.00 | 115 Properties |
| 2017 | £1,974,594.00 | 263 Properties |
| 2016 | £2,052,219.00 | 165 Properties |
| 2015 | £2,336,947.00 | 179 Properties |
| 2014 | £3,104,829.00 | 222 Properties |
| 2013 | £2,348,506.00 | 201 Properties |
| 2012 | £2,339,857.00 | 158 Properties |
| 2011 | £1,372,245.00 | 176 Properties |
| 2010 | £1,479,942.00 | 142 Properties |
| 2009 | £1,344,934.00 | 131 Properties |
| 2008 | £1,930,834.00 | 92 Properties |
| 2007 | £1,210,604.00 | 188 Properties |
| 2006 | £864,195.00 | 367 Properties |
| 2005 | £882,656.00 | 214 Properties |
| 2004 | £952,135.00 | 188 Properties |
| 2003 | £807,668.00 | 133 Properties |
| 2002 | £822,483.00 | 182 Properties |
| 2001 | £954,587.00 | 208 Properties |
| 2000 | £713,321.00 | 206 Properties |
| 1999 | £572,038.00 | 337 Properties |
| 1998 | £580,536.00 | 149 Properties |
| 1997 | £410,236.00 | 190 Properties |
| 1996 | £380,248.00 | 147 Properties |
| 1995 | £286,544.00 | 101 Properties |
Property Price per Property Type in SW1W
Here you can find historic sold price data in order to help with your property search.
The average Property Paid Price for specific property types in the last three years are:
| Property Type | Average Sold Price | Sold Properties |
|---|---|---|
| Semi Detached House | £4,450,000.00 | 2 Semi Detached Houses |
| Terraced House | £5,727,294.00 | 89 Terraced Houses |
| Detached House | £1,900,000.00 | 1 Detached Houses |
| Flat | £2,153,838.00 | 256 Flats |


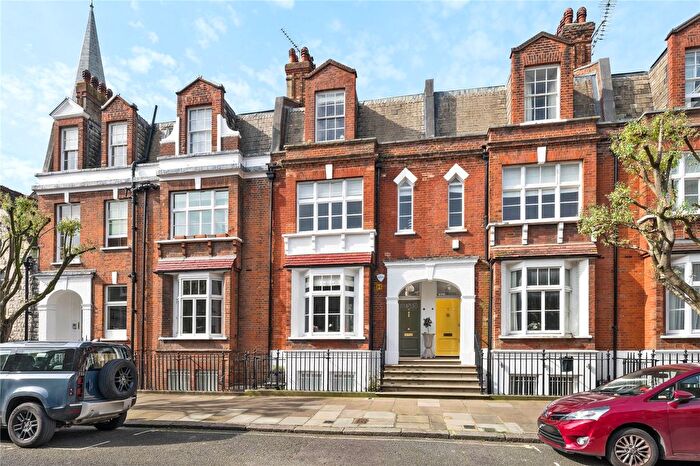
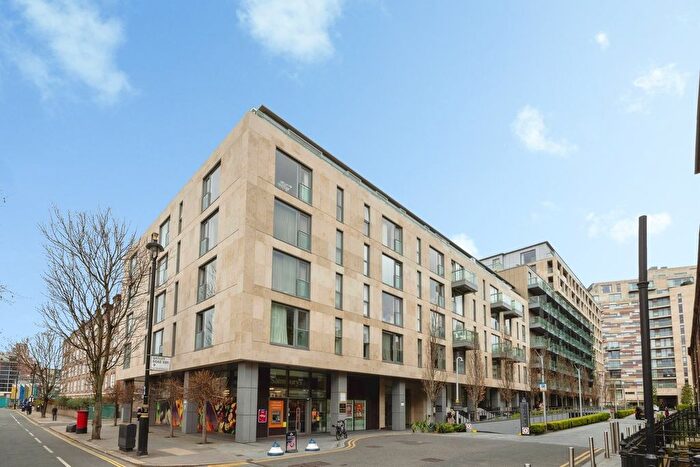
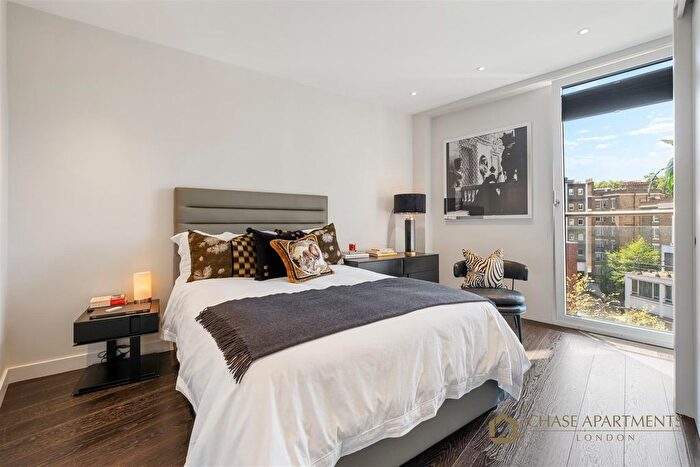
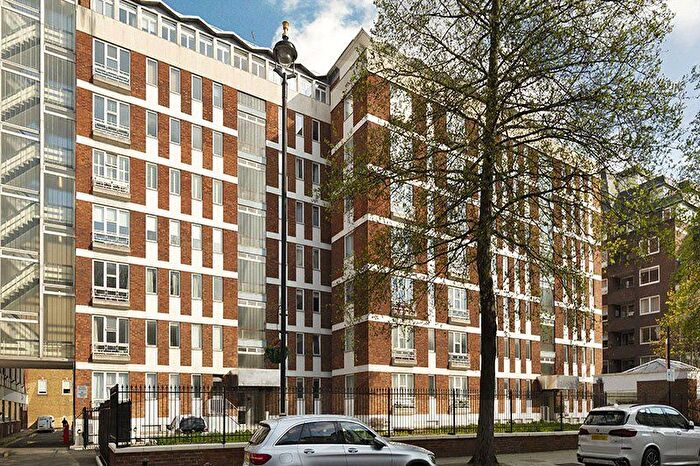
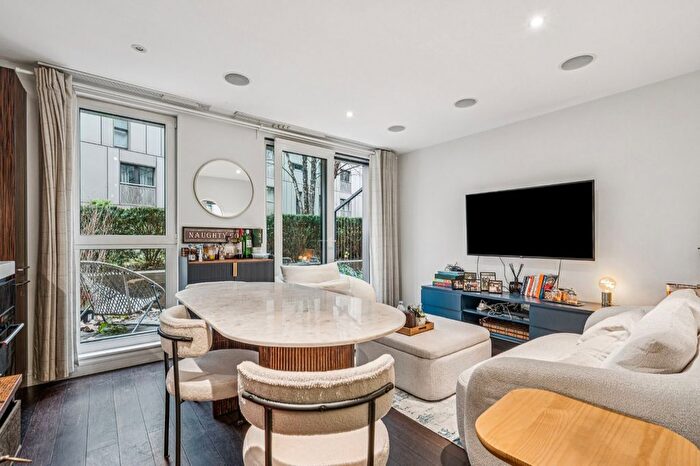
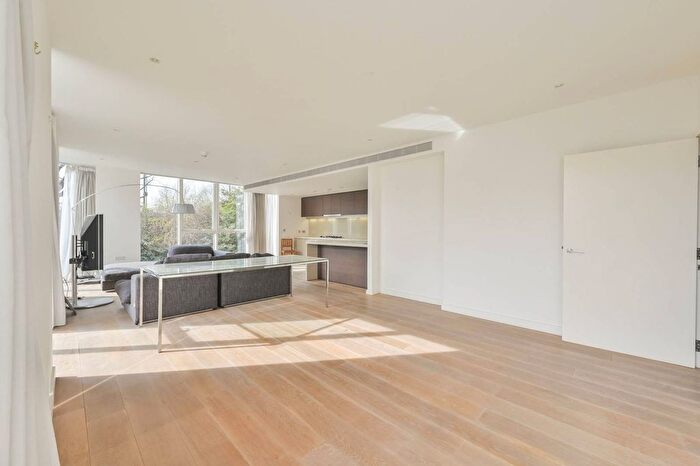
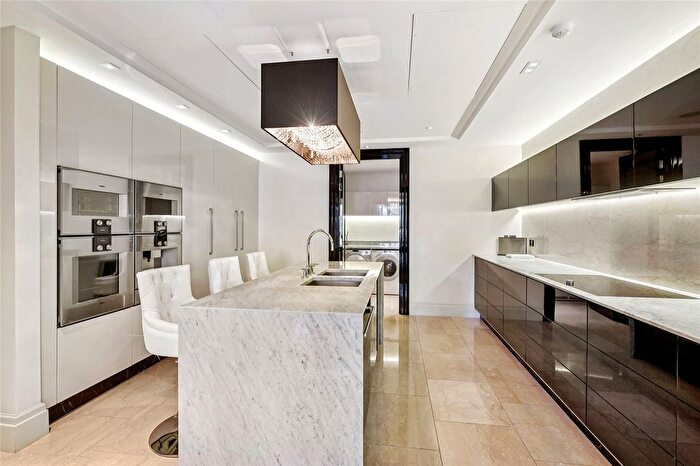
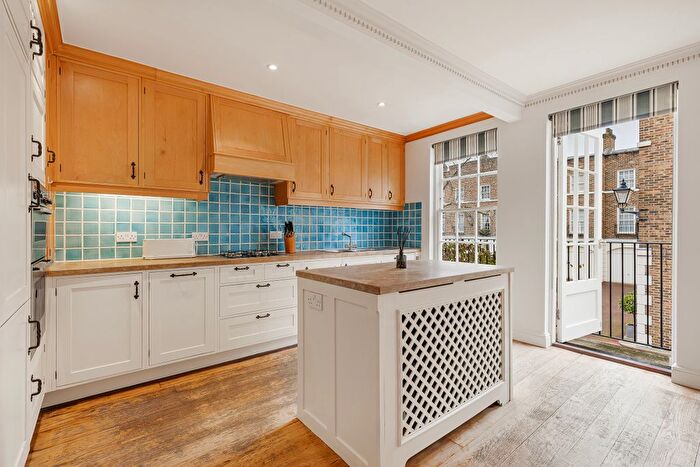
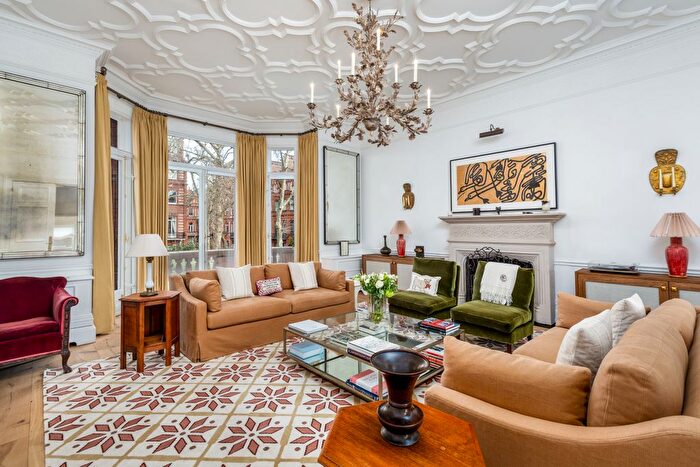
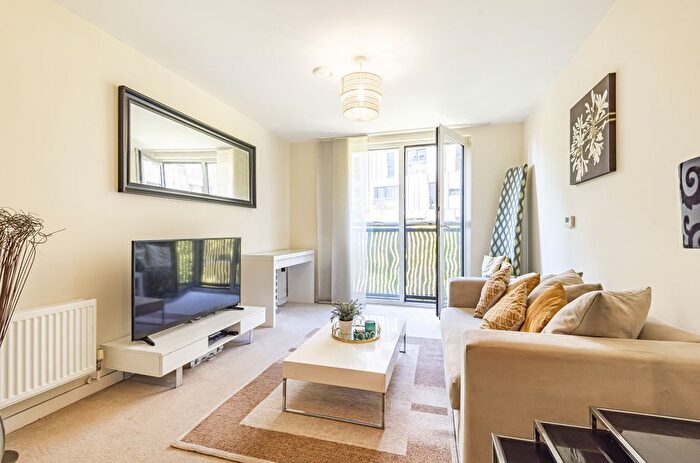
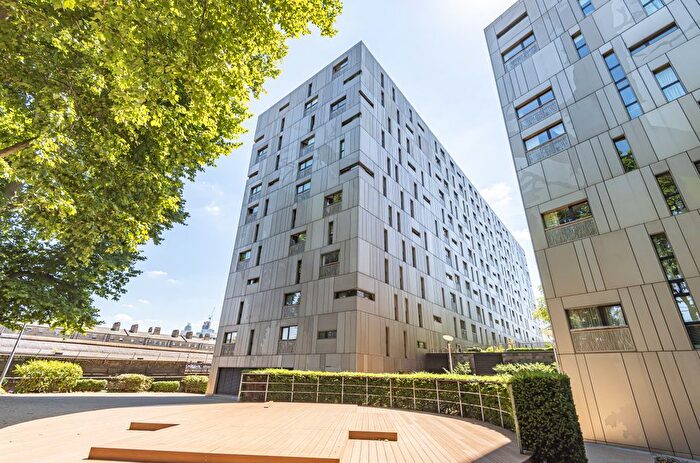
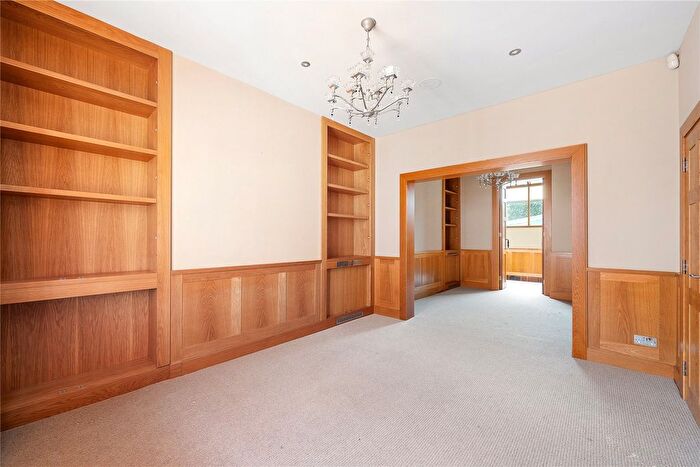
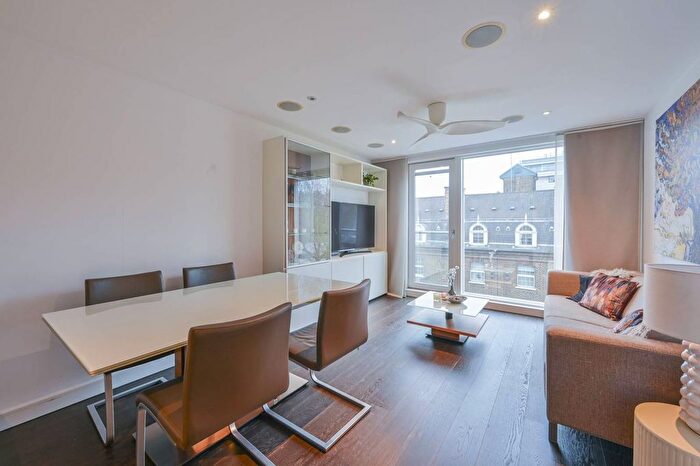
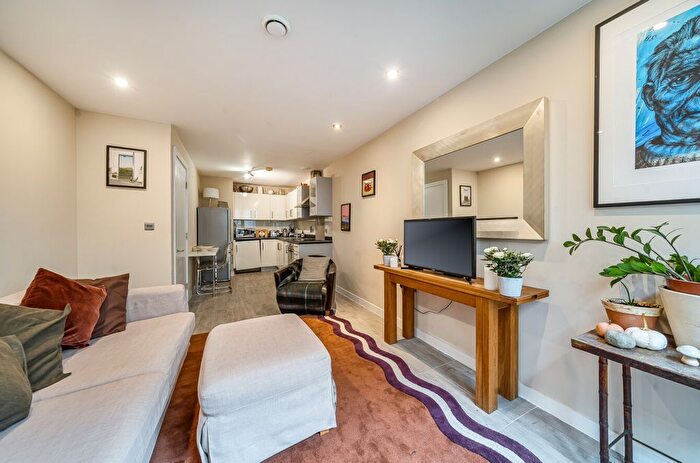
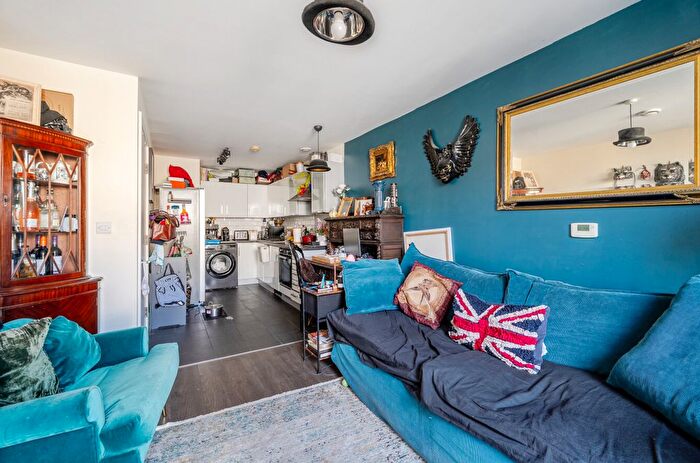
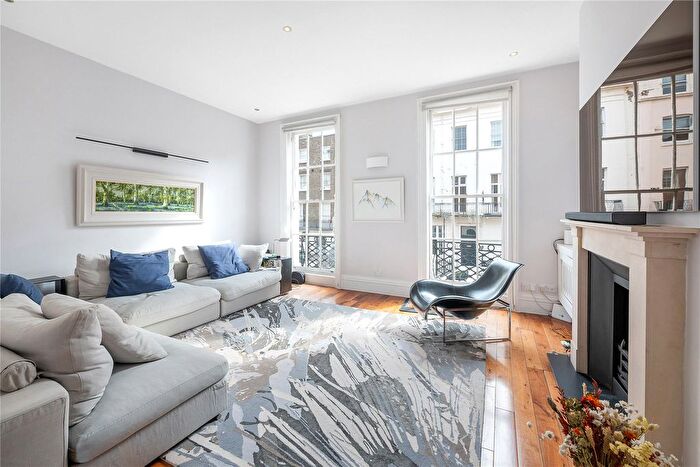
Houses and Flats for sale in SW1W, Belgravia
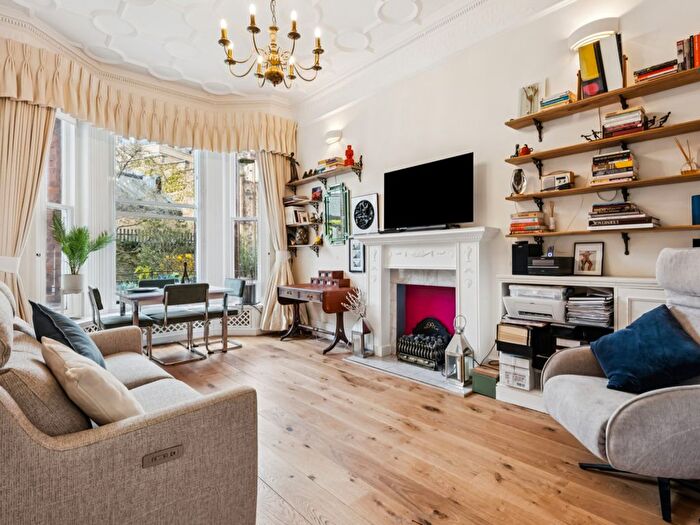
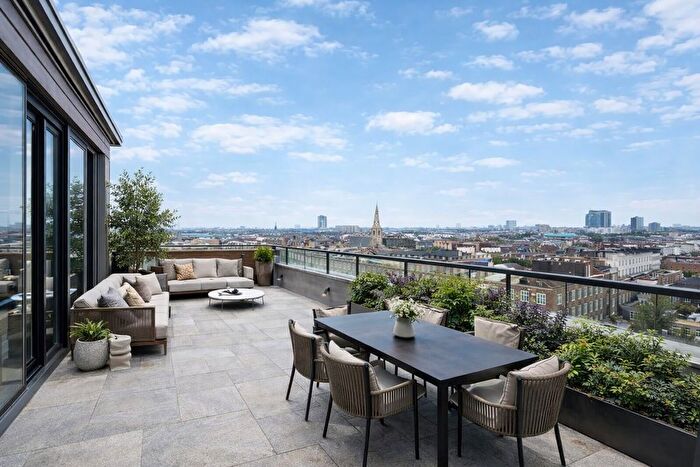
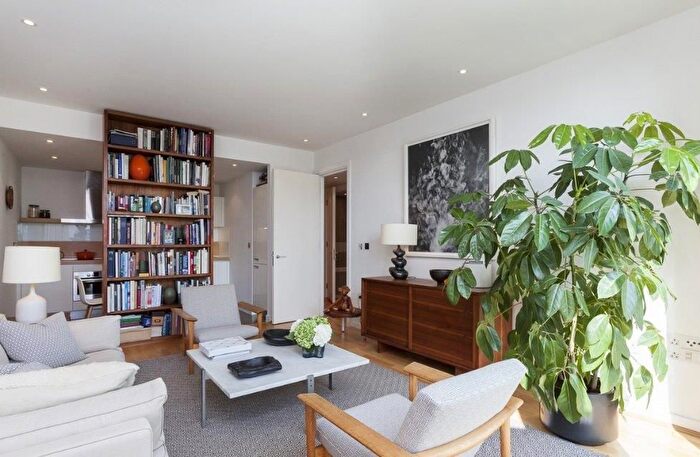
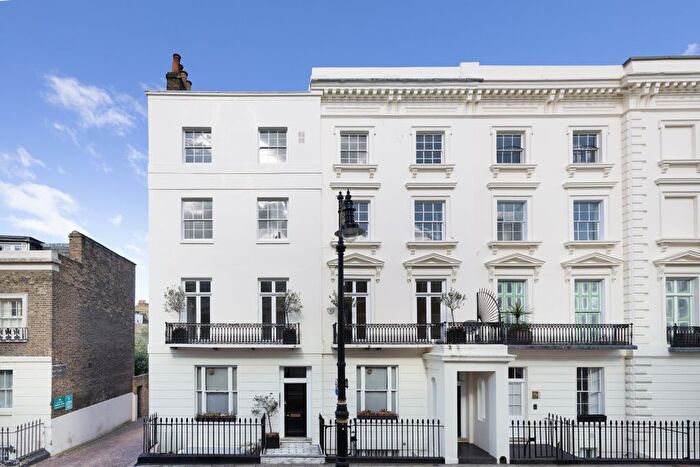
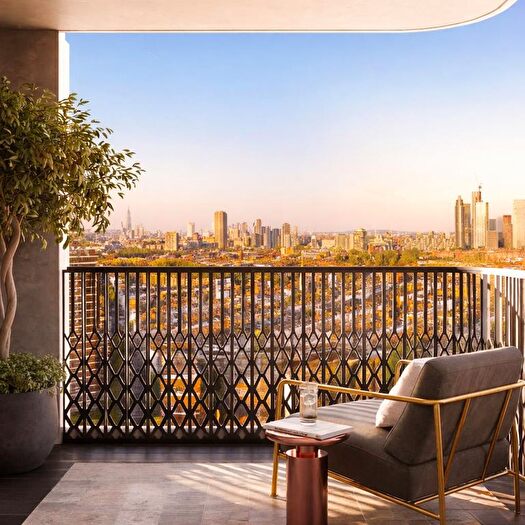
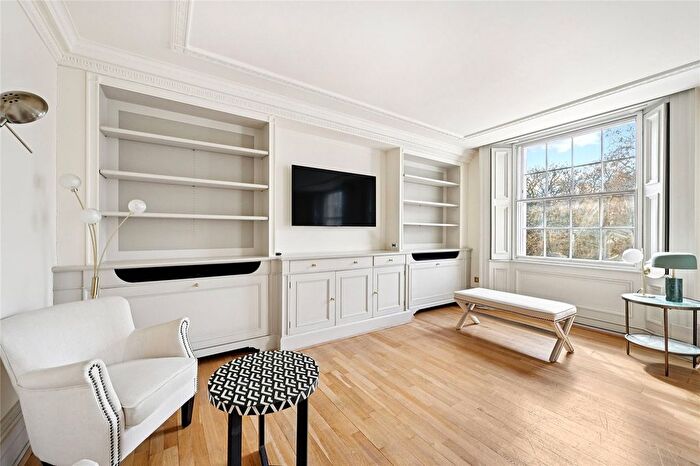
![]()
If you are looking to sell your house, let it out, or receive a property valuation, an expert can help you.
Click the button below to get started.
Frequently Asked Questions about SW1W
What is the average price for a property for sale in SW1W?
The average price for a property for sale in SW1W is £3,080,206. There are 69 property listings for sale in SW1W.
Which areas are included in the SW1W postcode district?
The main area within SW1W is Belgravia.
What are the most common property types in SW1W?
The most common property types in SW1W are Flats, Terraced Houses, Semi Detached Houses and Detached Houses.
What has been the average sold property price in SW1W over the last three years?
Flats in SW1W have an average sold price of £2,153,838, while Terraced Houses have an average of £5,727,294. Semi Detached Houses have an average of £4,450,000 and Detached Houses have an average of £1,900,000. The average sold property price in SW1W over the last three years is approximately £2,206,499.
Which tube stations are available in SW1W?
The tube station available in SW1W is Sloane Square Station.