
Properties for sale in UB2
Southall
- Info
- Price Paid By Year
- Property Type Price
- Transport
House Prices in UB2
Properties in UB2 have an average house price of £451,151.00 and had 466 Property Transactions within the last 3 years.
The most expensive property was sold for £3,355,000.00.
Property Price Paid in UB2 by Year
The average sold property price by year was:
| Year | Average Sold Price | Sold Properties |
|---|---|---|
| 2025 | £470,992.00 | 134 Properties |
| 2024 | £445,860.00 | 181 Properties |
| 2023 | £439,887.00 | 151 Properties |
| 2022 | £426,524.00 | 181 Properties |
| 2021 | £431,013.00 | 283 Properties |
| 2020 | £423,257.00 | 237 Properties |
| 2019 | £374,873.00 | 272 Properties |
| 2018 | £385,685.00 | 250 Properties |
| 2017 | £393,974.00 | 249 Properties |
| 2016 | £329,859.00 | 206 Properties |
| 2015 | £311,159.00 | 294 Properties |
| 2014 | £258,219.00 | 220 Properties |
| 2013 | £228,574.00 | 260 Properties |
| 2012 | £247,522.00 | 112 Properties |
| 2011 | £237,552.00 | 123 Properties |
| 2010 | £227,820.00 | 153 Properties |
| 2009 | £219,087.00 | 106 Properties |
| 2008 | £236,034.00 | 178 Properties |
| 2007 | £234,853.00 | 343 Properties |
| 2006 | £212,053.00 | 310 Properties |
| 2005 | £210,055.00 | 332 Properties |
| 2004 | £204,185.00 | 362 Properties |
| 2003 | £183,693.00 | 393 Properties |
| 2002 | £158,984.00 | 389 Properties |
| 2001 | £135,067.00 | 386 Properties |
| 2000 | £117,320.00 | 350 Properties |
| 1999 | £99,830.00 | 381 Properties |
| 1998 | £86,137.00 | 329 Properties |
| 1997 | £77,410.00 | 345 Properties |
| 1996 | £65,225.00 | 348 Properties |
| 1995 | £64,073.00 | 339 Properties |
Property Price per Property Type in UB2
Here you can find historic sold price data in order to help with your property search.
The average Property Paid Price for specific property types in the last three years are:
| Property Type | Average Sold Price | Sold Properties |
|---|---|---|
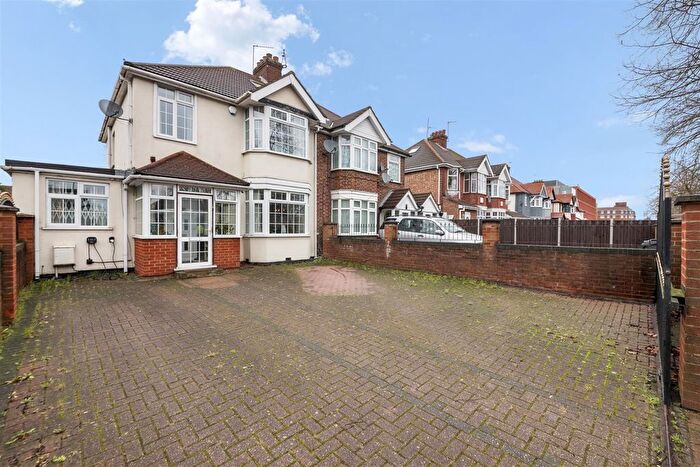
| Semi Detached House | £613,595.00 | 73 Semi Detached Houses |
| Detached House | £915,715.00 | 24 Detached Houses |
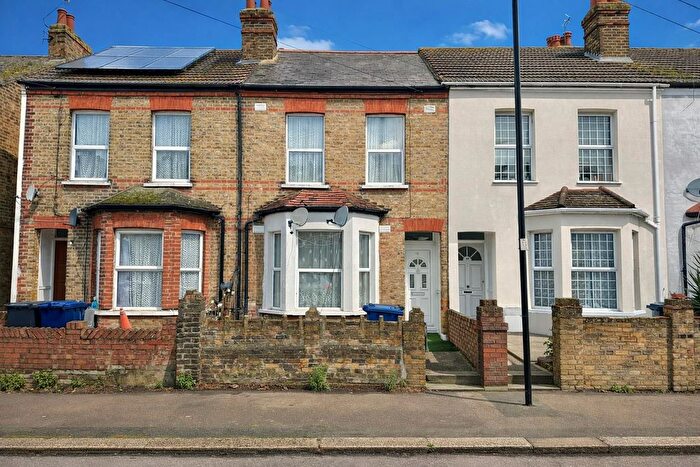
| Terraced House | £490,901.00 | 189 Terraced Houses |
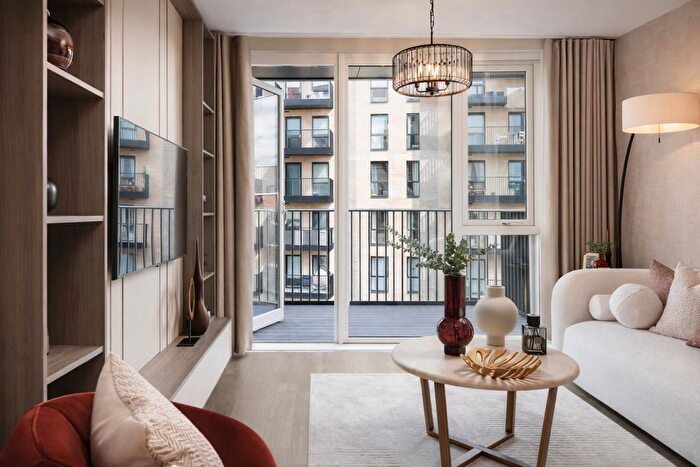
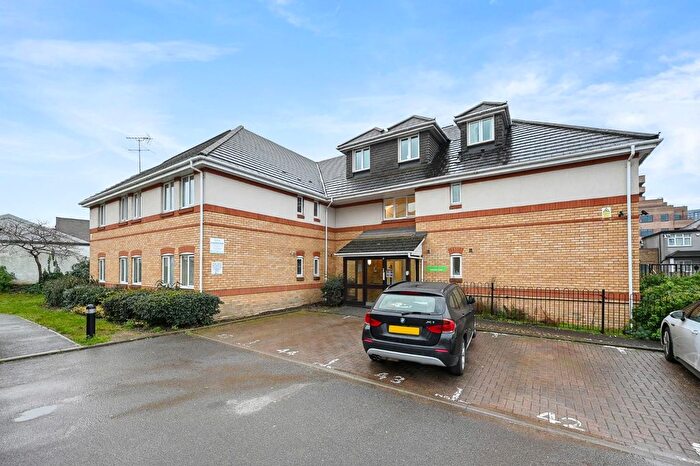
| Flat | £281,593.00 | 180 Flats |


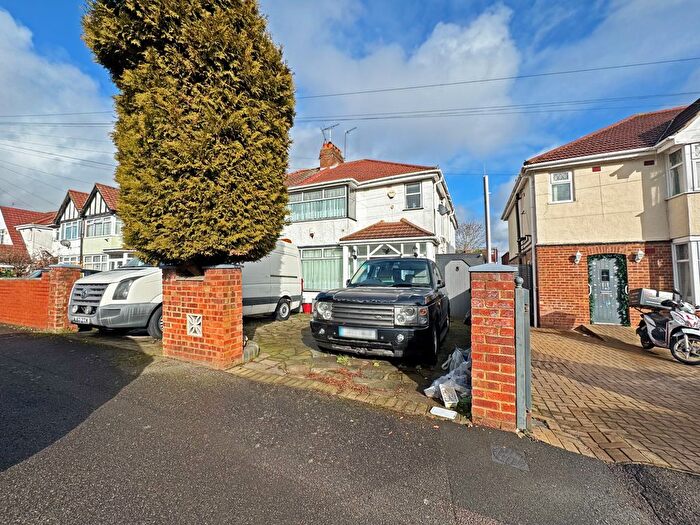
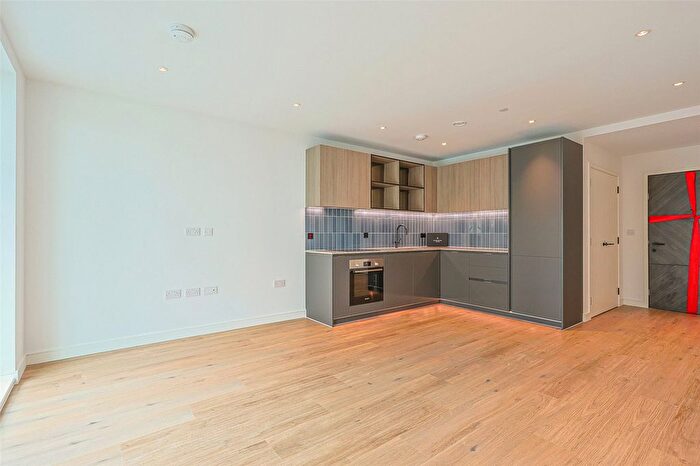
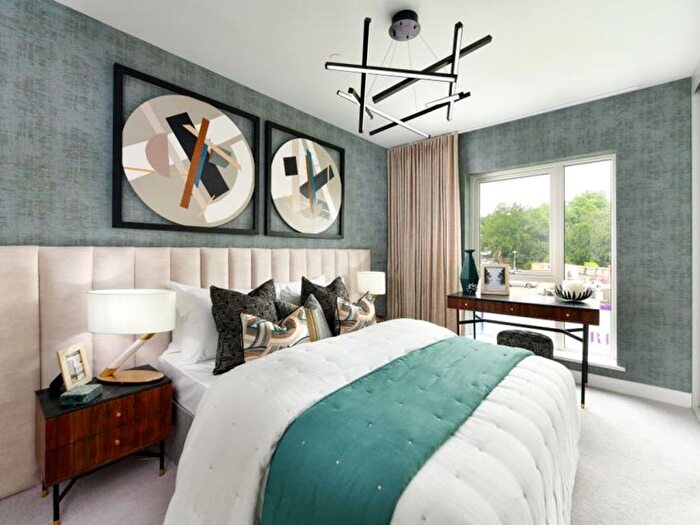
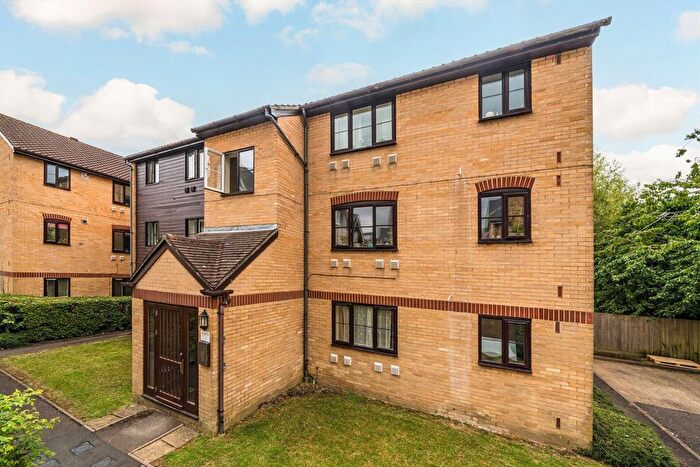
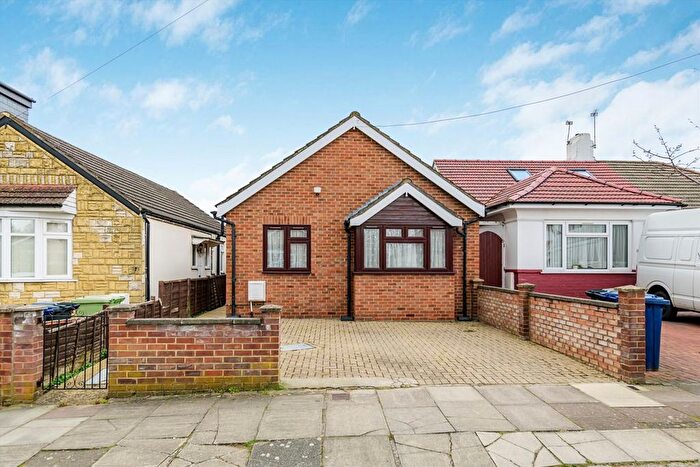
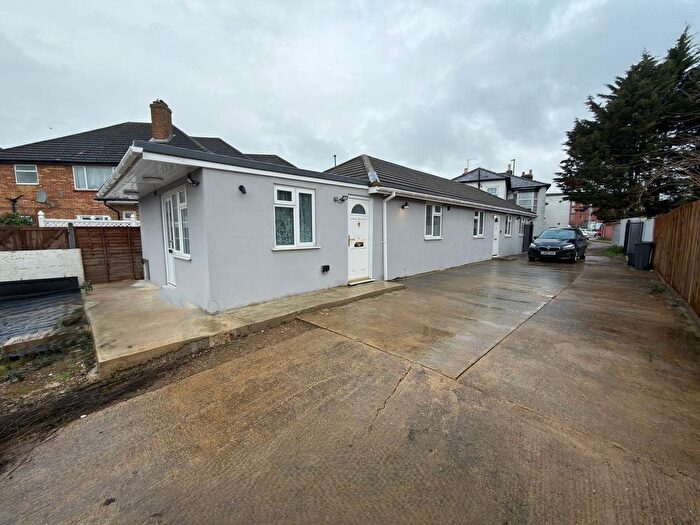
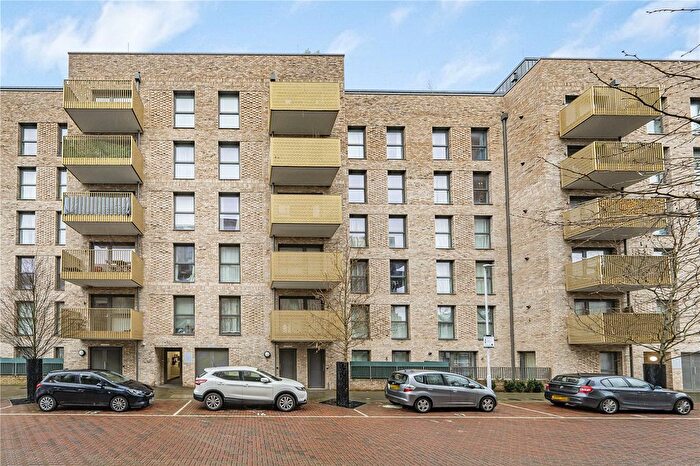
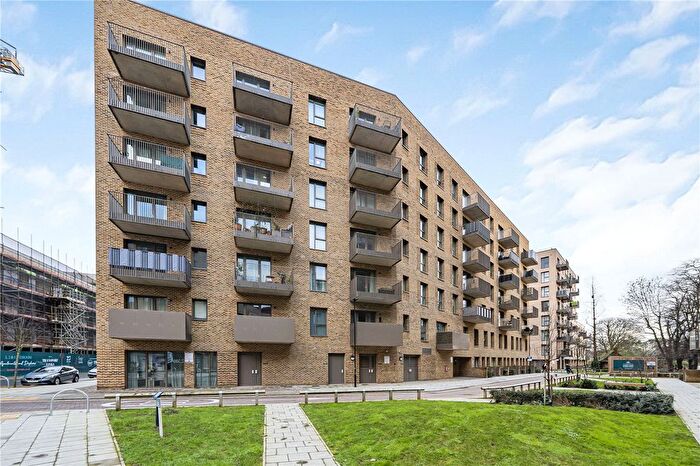
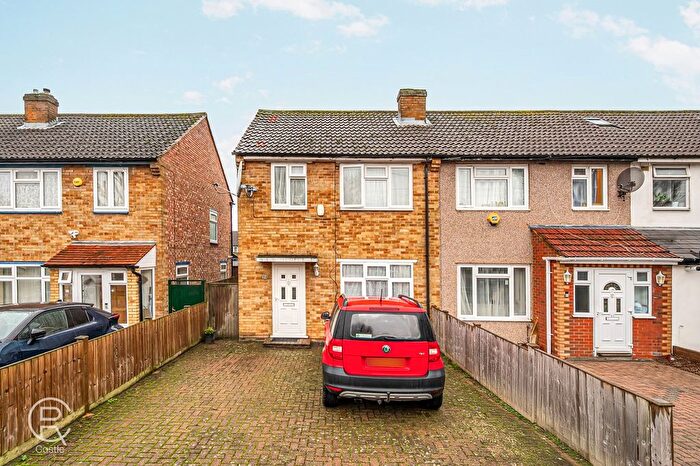
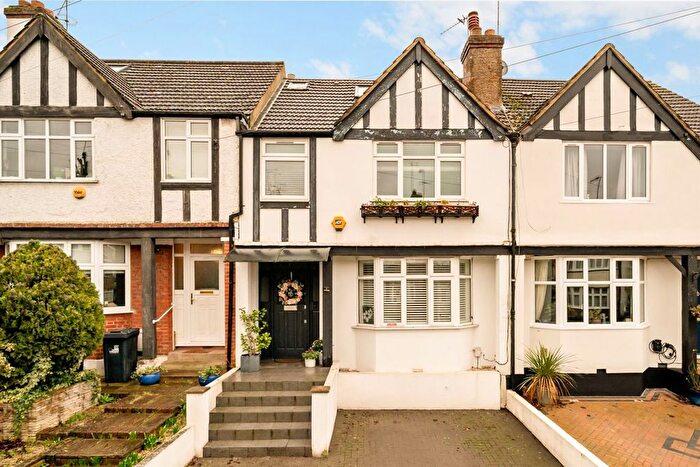
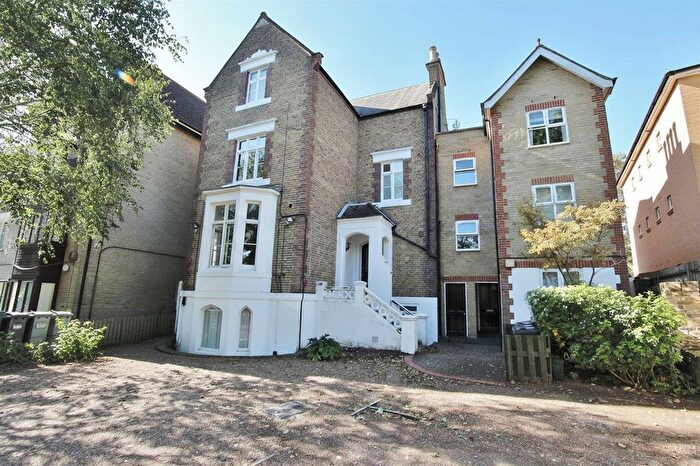
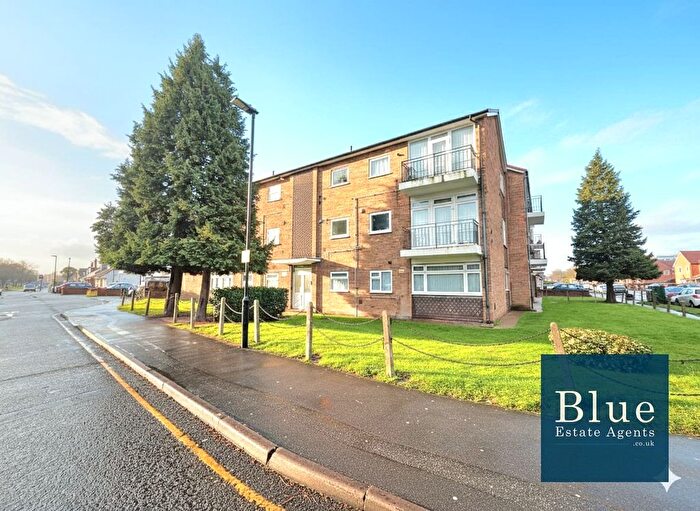
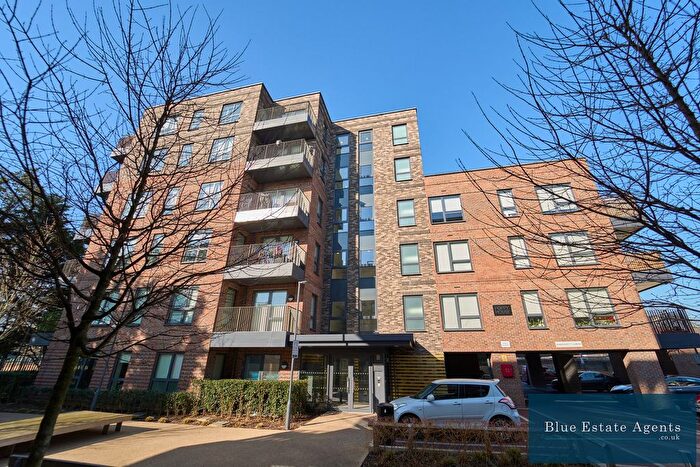
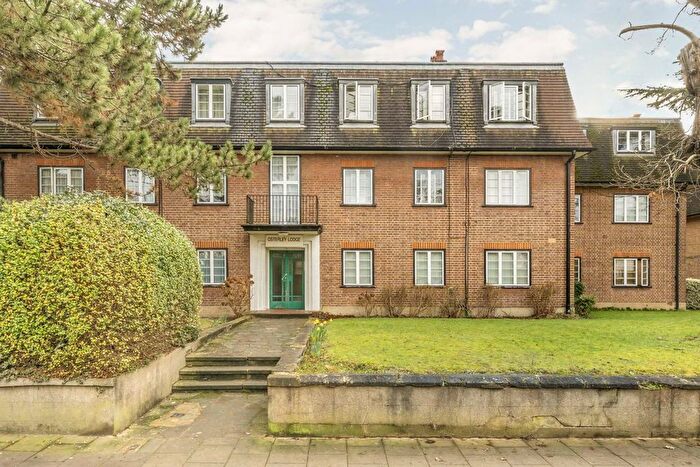
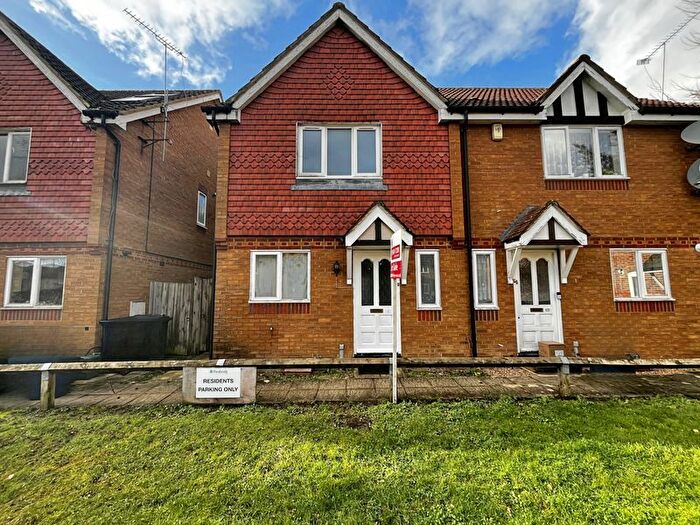
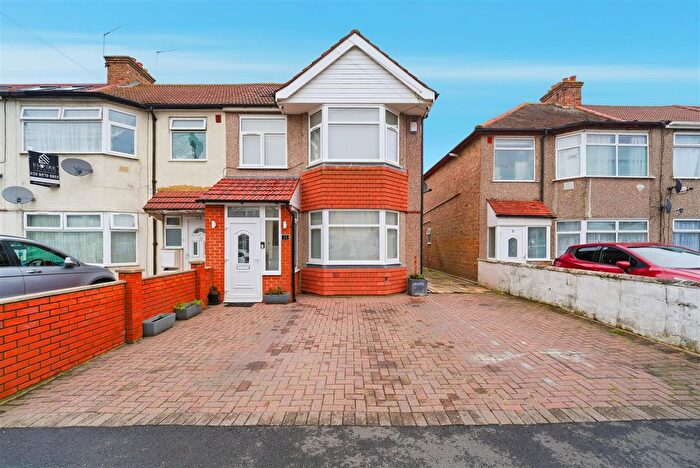
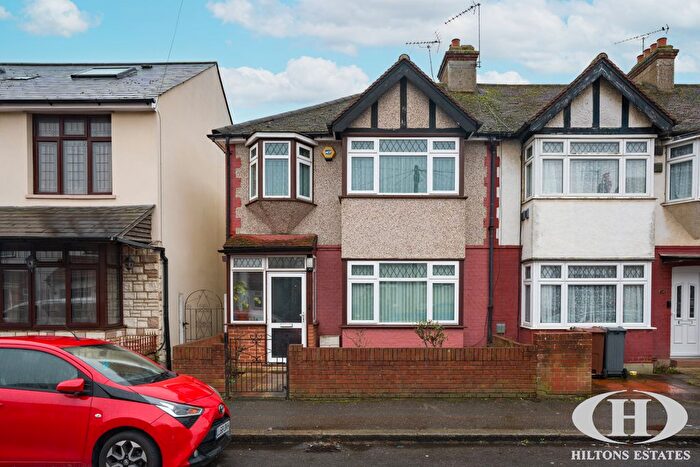
Properties for sale near UB2
![]()
If you are looking to sell your house, let it out, or receive a property valuation, an expert can help you.
Click the button below to get started.
Frequently Asked Questions about UB2
What is the average price for a property for sale in UB2?
The average price for a property for sale in UB2 is £451,151. There are 16 property listings for sale in UB2.
Which areas are included in the UB2 postcode district?
The main area within UB2 is Southall.
What are the most common property types in UB2?
The most common property types in UB2 are Terraced Houses, Flats, Semi Detached Houses and Detached Houses.
What has been the average sold property price in UB2 over the last three years?
Terraced Houses in UB2 have an average sold price of £490,901, while Flats have an average of £281,593. Semi Detached Houses have an average of £613,595 and Detached Houses have an average of £915,715. The average sold property price in UB2 over the last three years is approximately £452,246.
Which train stations are available in UB2?
The train station available in UB2 is Southall Station..