
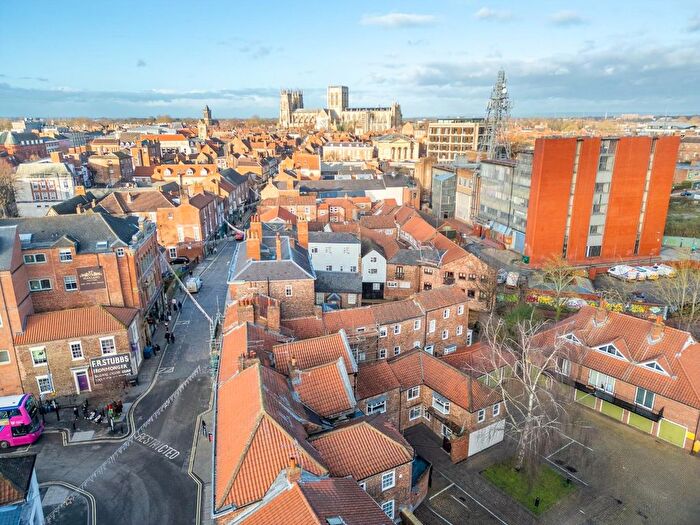
Properties for sale in YO1
York City Centre
- Info
- Price Paid By Year
- Property Type Price
- Transport
House Prices in YO1
Properties in YO1 have an average house price of £393,755.00 and had 322 Property Transactions within the last 3 years.
The most expensive property was sold for £4,126,915.00.
Property Price Paid in YO1 by Year
The average sold property price by year was:
| Year | Average Sold Price | Sold Properties |
|---|---|---|
| 2025 | £313,017.00 | 85 Properties |
| 2024 | £370,749.00 | 117 Properties |
| 2023 | £473,376.00 | 120 Properties |
| 2022 | £354,002.00 | 139 Properties |
| 2021 | £392,108.00 | 180 Properties |
| 2020 | £290,296.00 | 113 Properties |
| 2019 | £279,630.00 | 216 Properties |
| 2018 | £299,632.00 | 211 Properties |
| 2017 | £266,254.00 | 324 Properties |
| 2016 | £341,194.00 | 152 Properties |
| 2015 | £285,285.00 | 153 Properties |
| 2014 | £238,222.00 | 164 Properties |
| 2013 | £259,687.00 | 105 Properties |
| 2012 | £236,549.00 | 116 Properties |
| 2011 | £241,436.00 | 86 Properties |
| 2010 | £217,361.00 | 124 Properties |
| 2009 | £199,877.00 | 137 Properties |
| 2008 | £223,553.00 | 94 Properties |
| 2007 | £226,640.00 | 144 Properties |
| 2006 | £201,533.00 | 157 Properties |
| 2005 | £200,663.00 | 214 Properties |
| 2004 | £199,451.00 | 176 Properties |
| 2003 | £155,175.00 | 172 Properties |
| 2002 | £139,419.00 | 131 Properties |
| 2001 | £117,156.00 | 137 Properties |
| 2000 | £103,340.00 | 133 Properties |
| 1999 | £109,240.00 | 144 Properties |
| 1998 | £88,237.00 | 136 Properties |
| 1997 | £127,385.00 | 127 Properties |
| 1996 | £77,496.00 | 69 Properties |
| 1995 | £63,109.00 | 50 Properties |
Property Price per Property Type in YO1
Here you can find historic sold price data in order to help with your property search.
The average Property Paid Price for specific property types in the last three years are:
| Property Type | Average Sold Price | Sold Properties |
|---|---|---|
| Semi Detached House | £472,656.00 | 8 Semi Detached Houses |
| Detached House | £451,666.00 | 3 Detached Houses |
| Terraced House | £625,558.00 | 87 Terraced Houses |
| Flat | £300,131.00 | 224 Flats |
Transport near YO1

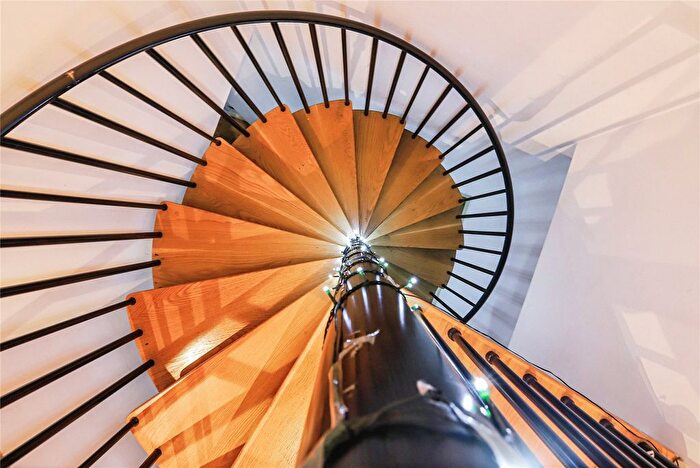
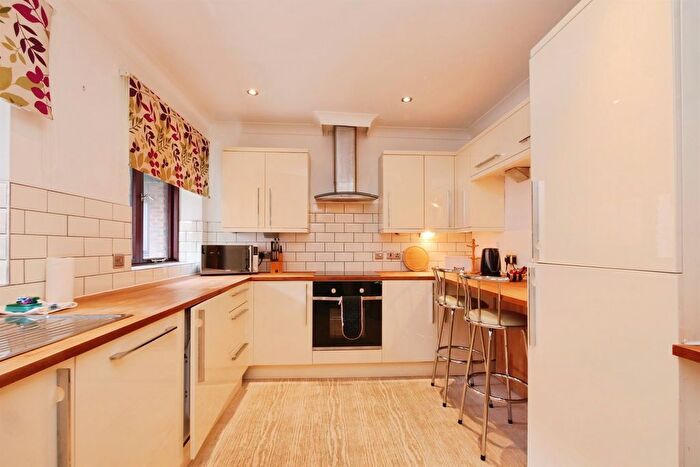
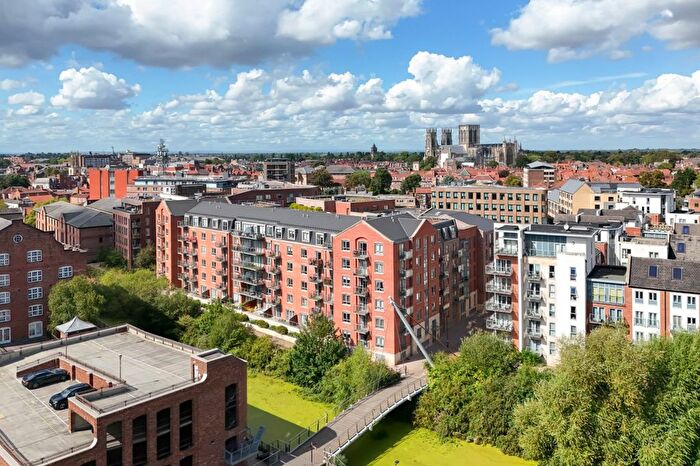
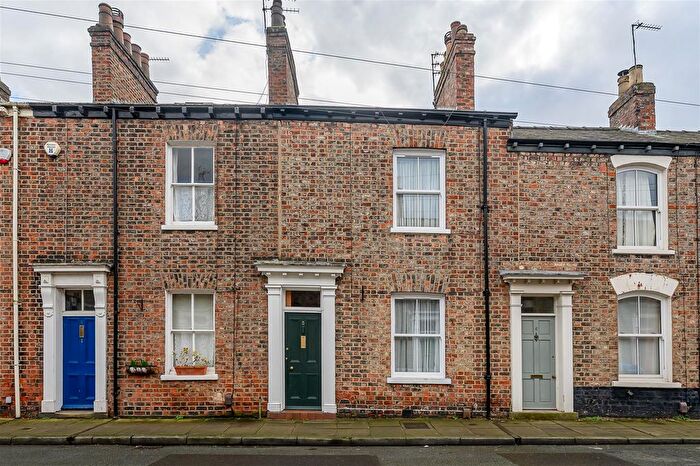
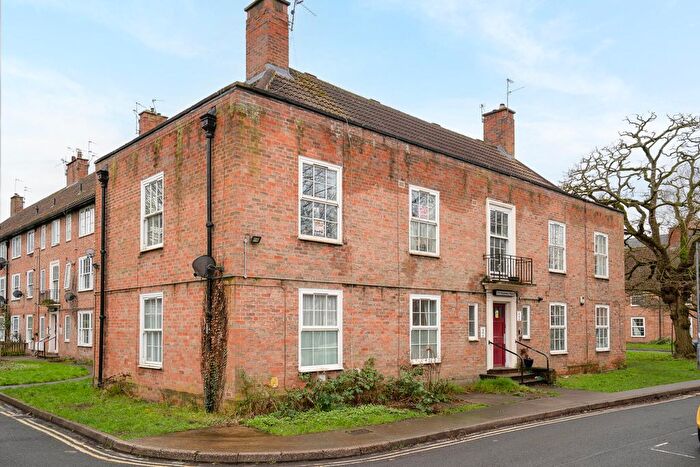
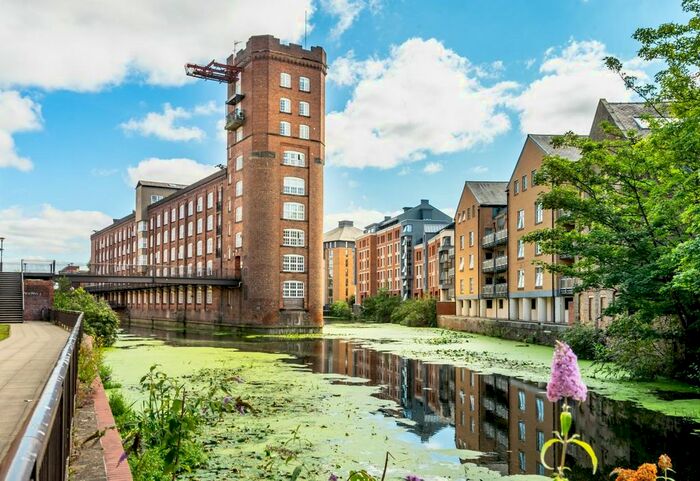
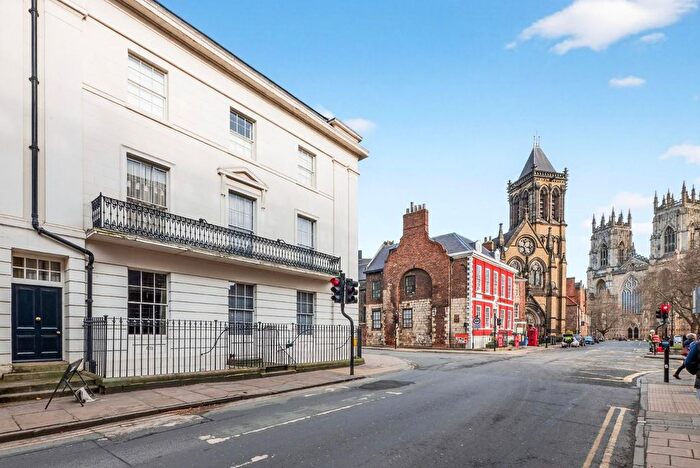
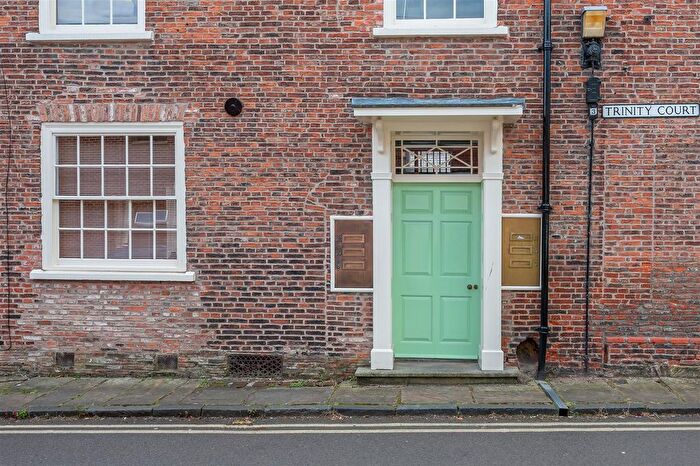
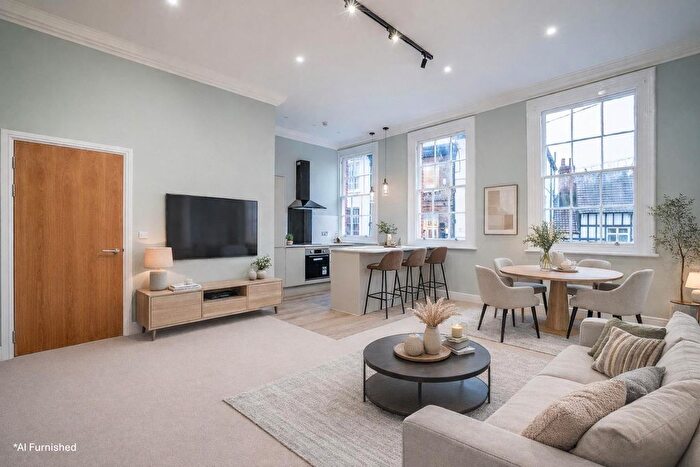
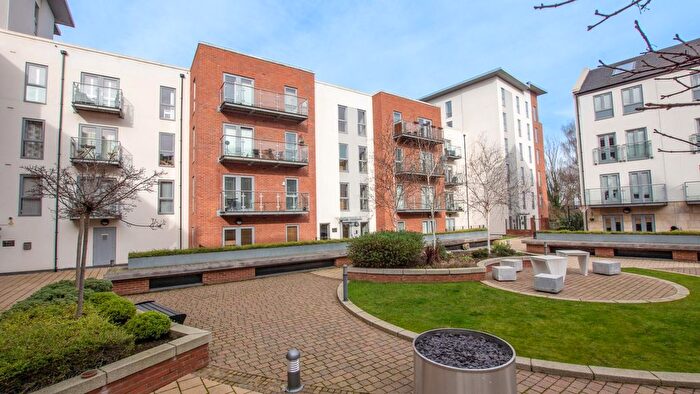
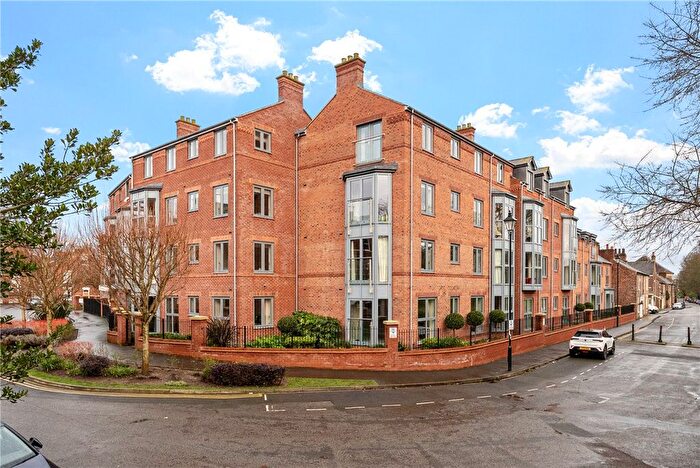
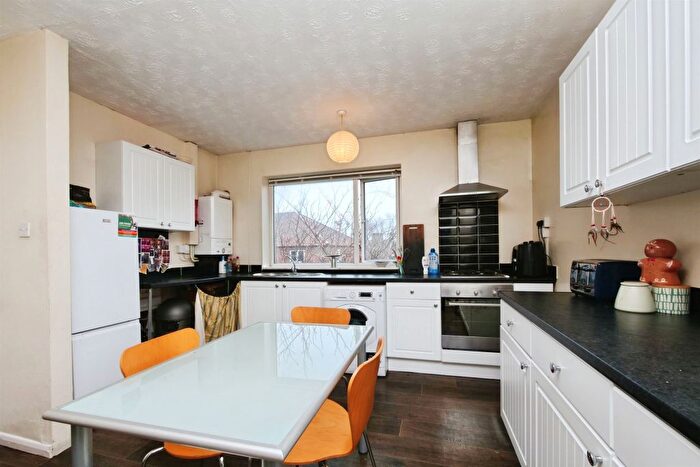
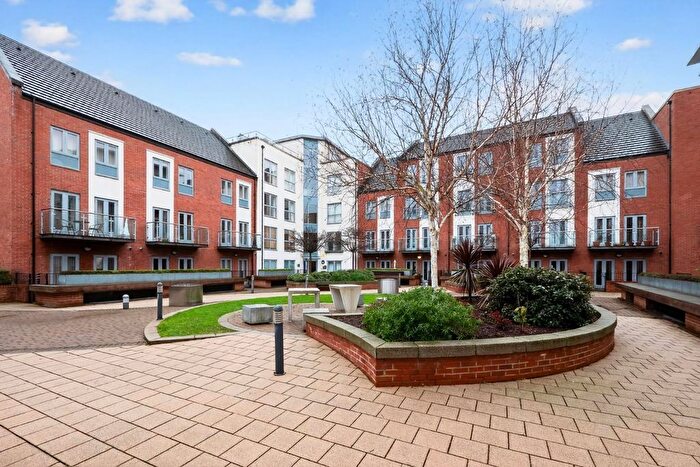
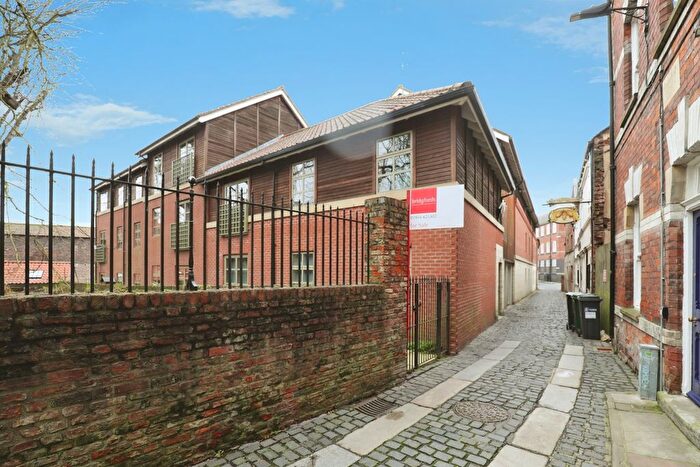
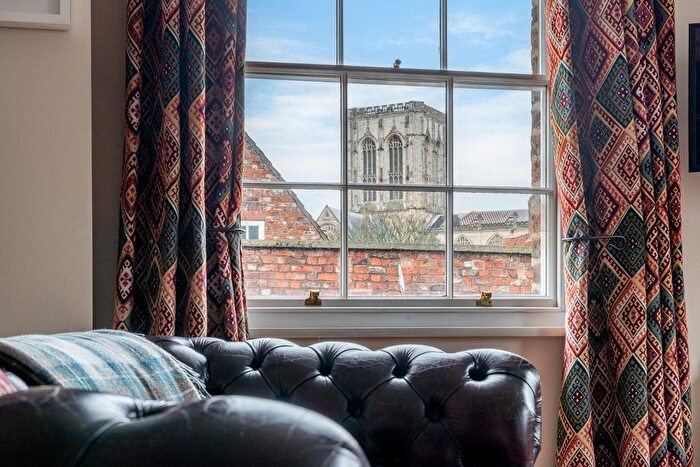
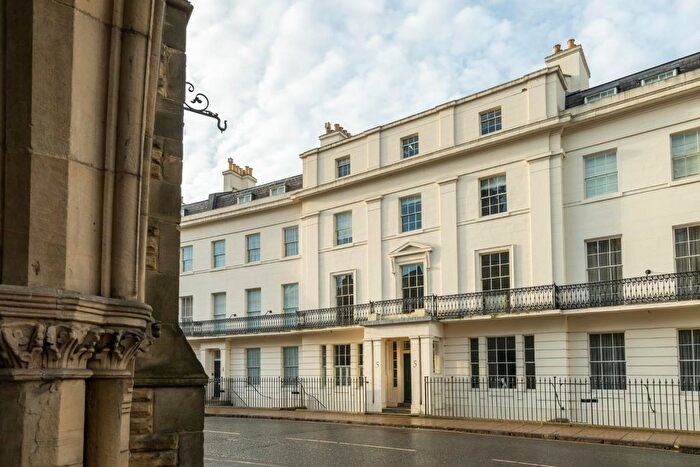
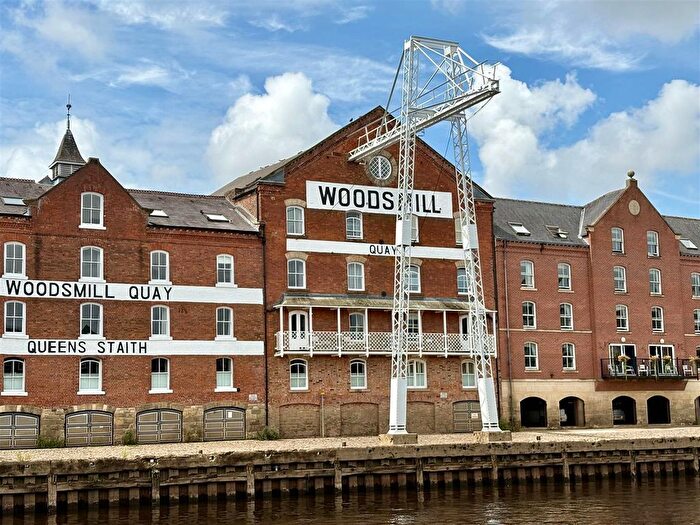
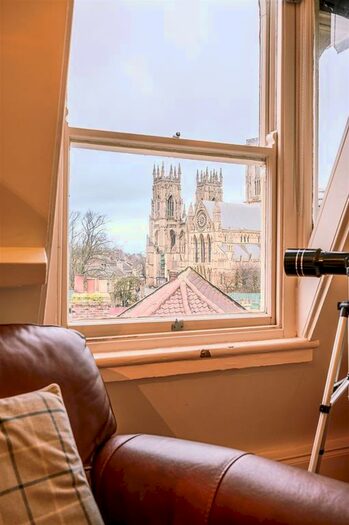
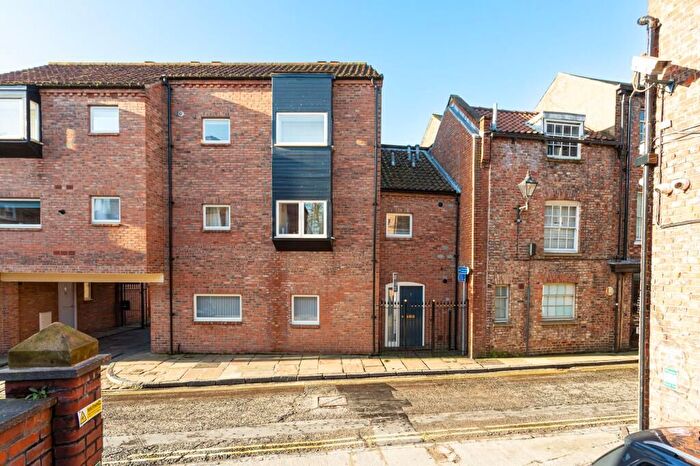
Houses and Flats for sale in YO1, York City Centre
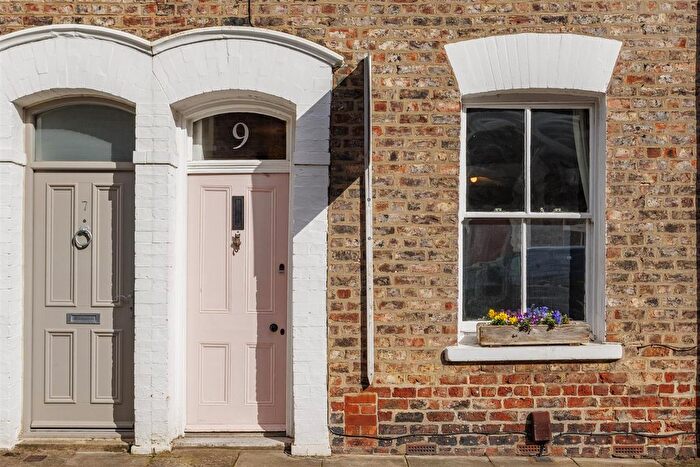
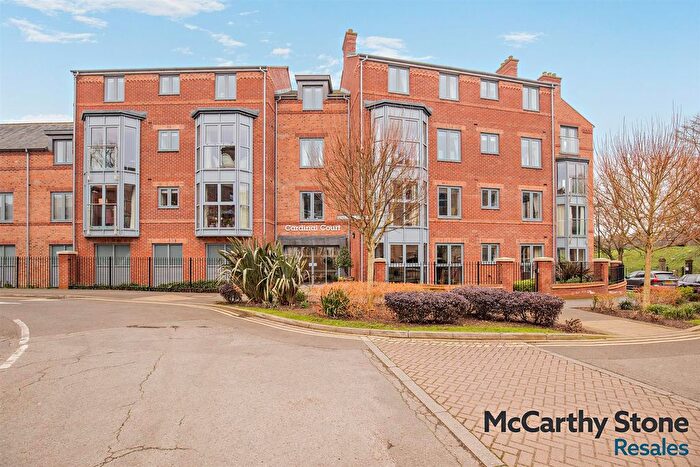
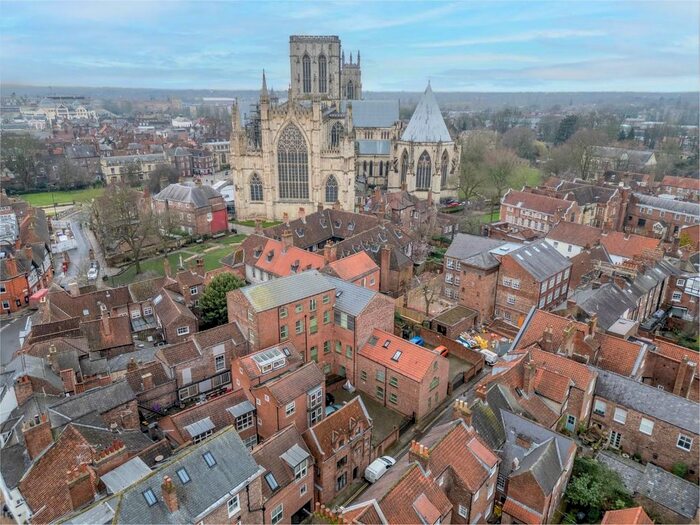
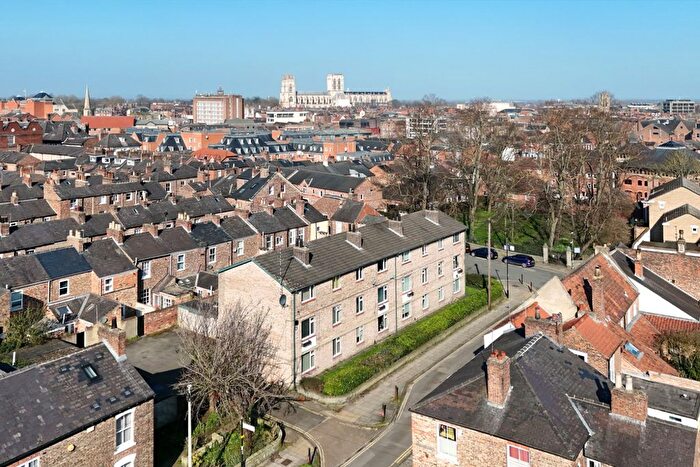
![]()
If you are looking to sell your house, let it out, or receive a property valuation, an expert can help you.
Click the button below to get started.
Frequently Asked Questions about YO1
What is the average price for a property for sale in YO1?
The average price for a property for sale in YO1 is £393,755. There are 37 property listings for sale in YO1.
Which areas are included in the YO1 postcode district?
The main area within YO1 is York City Centre.
What are the most common property types in YO1?
The most common property types in YO1 are Flats, Terraced Houses, Semi Detached Houses and Detached Houses.
What has been the average sold property price in YO1 over the last three years?
Flats in YO1 have an average sold price of £300,131, while Terraced Houses have an average of £625,558. Semi Detached Houses have an average of £472,656 and Detached Houses have an average of £451,666. The average sold property price in YO1 over the last three years is approximately £385,714.
Which train stations are available in YO1?
The train stations available in YO1 are Bempton Station, Bridlington Station, Filey Station, Hunmanby Station, Malton Station, Scarborough Station and Seamer Station..