
Properties for sale in YO10
Fishergate, Fulford, Heslington, Osbaldwick, Tang Hall
- Info
- Price Paid By Year
- Property Type Price
- Transport
House Prices in YO10
Properties in YO10 have an average house price of £318,926.00 and had 892 Property Transactions within the last 3 years.
The most expensive property was sold for £1,450,000.00.
Property Price Paid in YO10 by Year
The average sold property price by year was:
| Year | Average Sold Price | Sold Properties |
|---|---|---|
| 2026 | £340,826.00 | 19 Properties |
| 2025 | £320,287.00 | 291 Properties |
| 2024 | £310,204.00 | 319 Properties |
| 2023 | £326,416.00 | 263 Properties |
| 2022 | £303,567.00 | 360 Properties |
| 2021 | £288,777.00 | 462 Properties |
| 2020 | £259,994.00 | 300 Properties |
| 2019 | £252,743.00 | 370 Properties |
| 2018 | £238,650.00 | 395 Properties |
| 2017 | £211,006.00 | 528 Properties |
| 2016 | £240,023.00 | 398 Properties |
| 2015 | £224,418.00 | 397 Properties |
| 2014 | £202,230.00 | 427 Properties |
| 2013 | £206,005.00 | 385 Properties |
| 2012 | £215,820.00 | 326 Properties |
| 2011 | £188,149.00 | 357 Properties |
| 2010 | £186,788.00 | 310 Properties |
| 2009 | £184,812.00 | 278 Properties |
| 2008 | £174,528.00 | 272 Properties |
| 2007 | £189,588.00 | 548 Properties |
| 2006 | £188,674.00 | 636 Properties |
| 2005 | £169,277.00 | 515 Properties |
| 2004 | £163,525.00 | 734 Properties |
| 2003 | £140,901.00 | 643 Properties |
| 2002 | £114,633.00 | 593 Properties |
| 2001 | £97,523.00 | 563 Properties |
| 2000 | £80,009.00 | 451 Properties |
| 1999 | £65,799.00 | 497 Properties |
| 1998 | £65,040.00 | 431 Properties |
| 1997 | £59,389.00 | 503 Properties |
| 1996 | £59,978.00 | 405 Properties |
| 1995 | £57,495.00 | 331 Properties |
Property Price per Property Type in YO10
Here you can find historic sold price data in order to help with your property search.
The average Property Paid Price for specific property types in the last three years are:
| Property Type | Average Sold Price | Sold Properties |
|---|---|---|
| Semi Detached House | £347,696.00 | 301 Semi Detached Houses |
| Detached House | £479,108.00 | 90 Detached Houses |
| Terraced House | £318,890.00 | 311 Terraced Houses |
| Flat | £197,532.00 | 190 Flats |
Transport near YO10

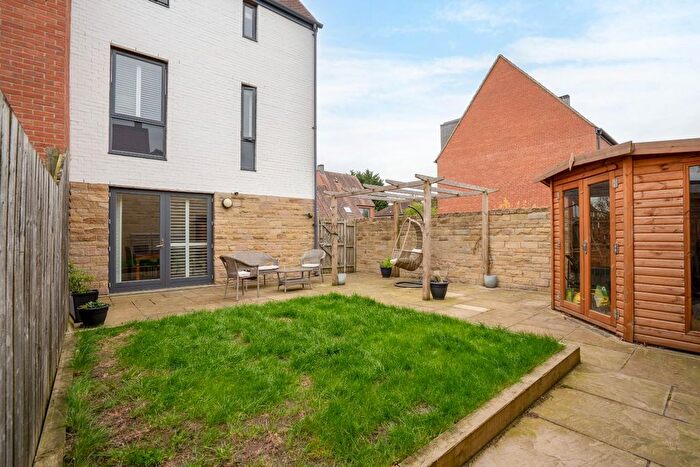
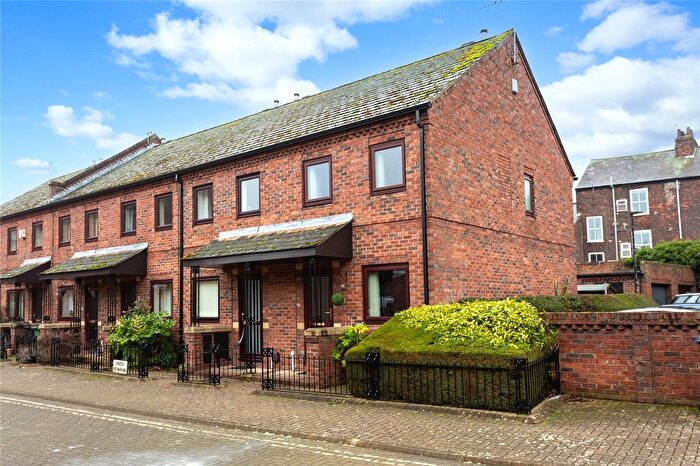
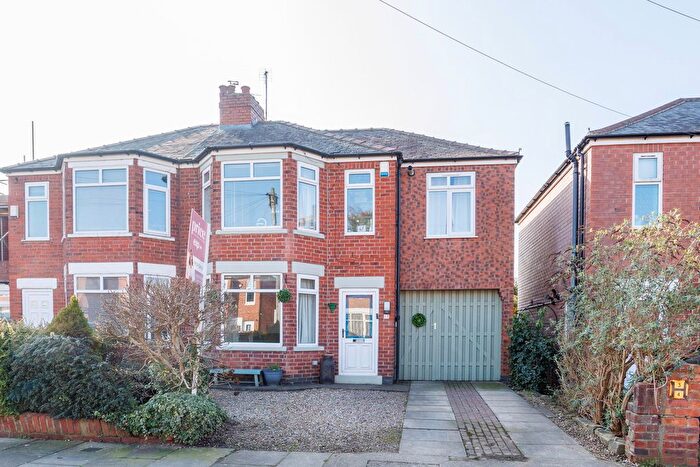
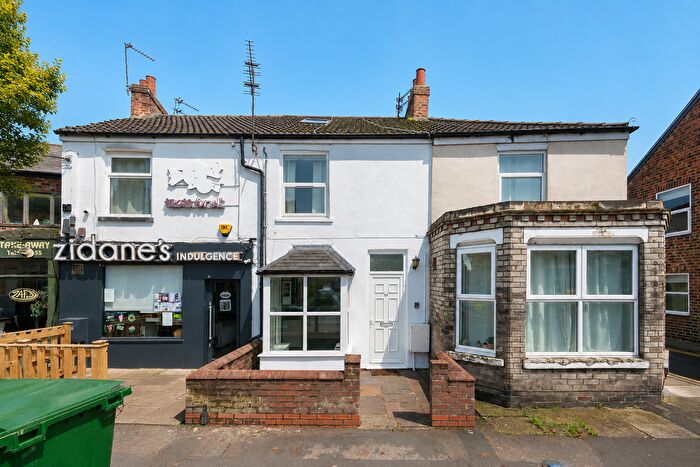
Houses and Flats for sale in YO10, Fishergate, Fulford, Heslington, Osbaldwick
Frequently Asked Questions about YO10
What is the average price for a property for sale in YO10?
The average price for a property for sale in YO10 is £318,926. There are 28 property listings for sale in YO10.
Which areas are included in the YO10 postcode district?
The main areas within YO10 include Fishergate, Fulford, Heslington, Osbaldwick and Tang Hall.
What are the most common property types in YO10?
The most common property types in YO10 are Terraced Houses, Semi Detached Houses, Flats and Detached Houses.
What has been the average sold property price in YO10 over the last three years?
Terraced Houses in YO10 have an average sold price of £318,890, while Semi Detached Houses have an average of £347,696. Flats have an average of £197,532 and Detached Houses have an average of £479,108. The average sold property price in YO10 over the last three years is approximately £323,772.