
Properties for sale in YO17
Norton
- Info
- Price Paid By Year
- Property Type Price
- Transport
House Prices in YO17
Properties in YO17 have an average house price of £293,563.00 and had 933 Property Transactions within the last 3 years.
The most expensive property was sold for £1,503,450.00.
Property Price Paid in YO17 by Year
The average sold property price by year was:
| Year | Average Sold Price | Sold Properties |
|---|---|---|
| 2026 | £290,430.00 | 32 Properties |
| 2025 | £276,475.00 | 308 Properties |
| 2024 | £297,545.00 | 311 Properties |
| 2023 | £308,192.00 | 282 Properties |
| 2022 | £280,412.00 | 392 Properties |
| 2021 | £269,007.00 | 386 Properties |
| 2020 | £258,591.00 | 398 Properties |
| 2019 | £227,428.00 | 445 Properties |
| 2018 | £225,134.00 | 416 Properties |
| 2017 | £221,014.00 | 434 Properties |
| 2016 | £208,980.00 | 430 Properties |
| 2015 | £196,635.00 | 379 Properties |
| 2014 | £190,791.00 | 437 Properties |
| 2013 | £187,017.00 | 348 Properties |
| 2012 | £179,371.00 | 245 Properties |
| 2011 | £183,104.00 | 250 Properties |
| 2010 | £197,382.00 | 260 Properties |
| 2009 | £177,452.00 | 230 Properties |
| 2008 | £190,465.00 | 230 Properties |
| 2007 | £202,820.00 | 430 Properties |
| 2006 | £198,127.00 | 425 Properties |
| 2005 | £180,736.00 | 339 Properties |
| 2004 | £174,937.00 | 360 Properties |
| 2003 | £138,826.00 | 411 Properties |
| 2002 | £114,019.00 | 425 Properties |
| 2001 | £97,025.00 | 419 Properties |
| 2000 | £82,360.00 | 446 Properties |
| 1999 | £73,219.00 | 405 Properties |
| 1998 | £65,260.00 | 366 Properties |
| 1997 | £67,676.00 | 383 Properties |
| 1996 | £63,830.00 | 357 Properties |
| 1995 | £60,654.00 | 302 Properties |
Property Price per Property Type in YO17
Here you can find historic sold price data in order to help with your property search.
The average Property Paid Price for specific property types in the last three years are:
| Property Type | Average Sold Price | Sold Properties |
|---|---|---|
| Semi Detached House | £267,575.00 | 332 Semi Detached Houses |
| Detached House | £411,834.00 | 314 Detached Houses |
| Terraced House | £206,427.00 | 243 Terraced Houses |
| Flat | £126,866.00 | 44 Flats |

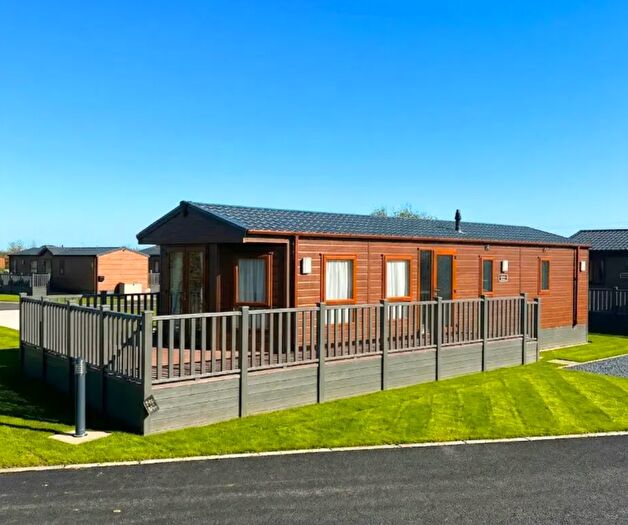
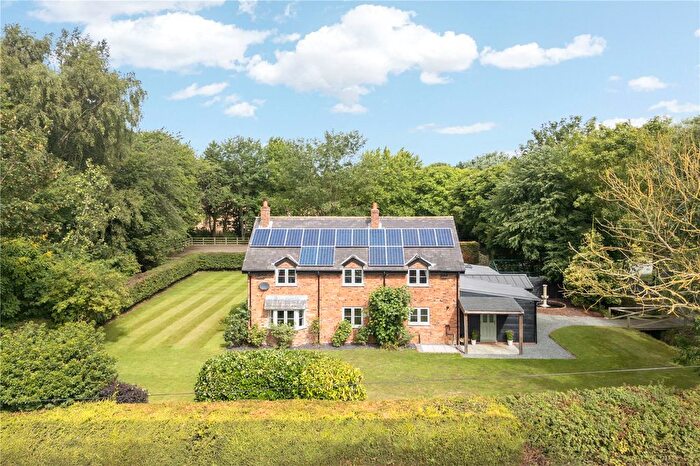
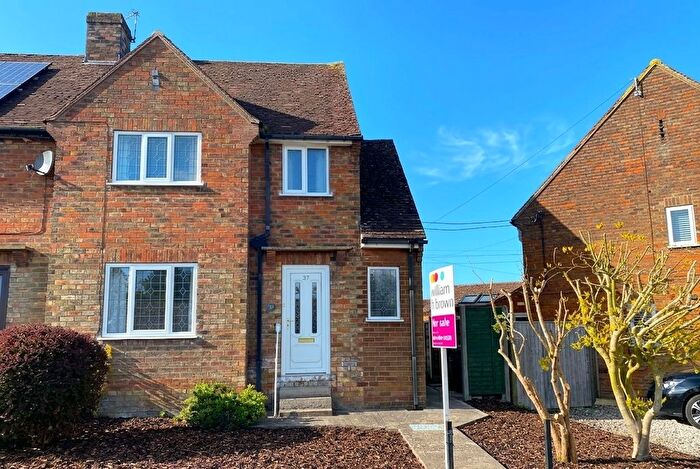
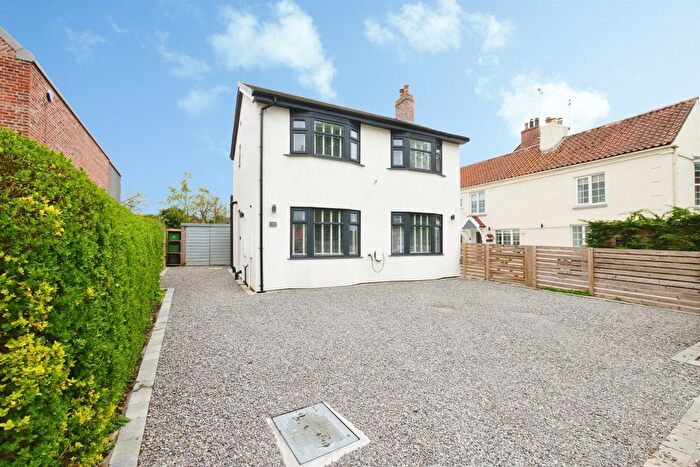
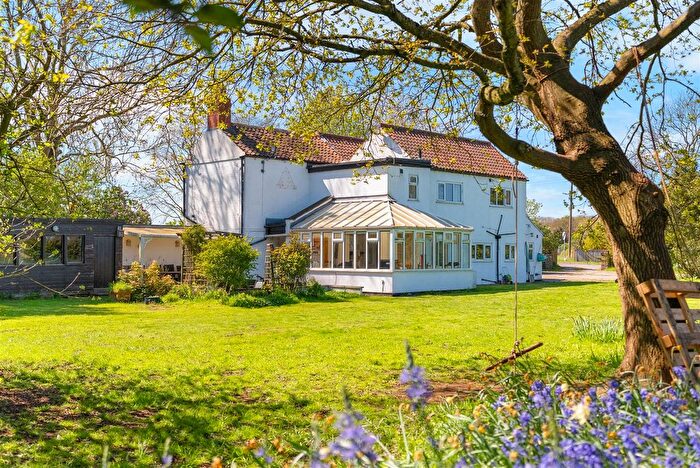
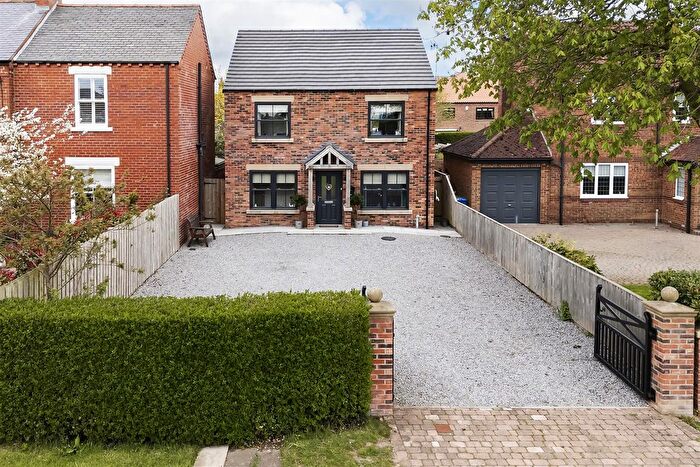
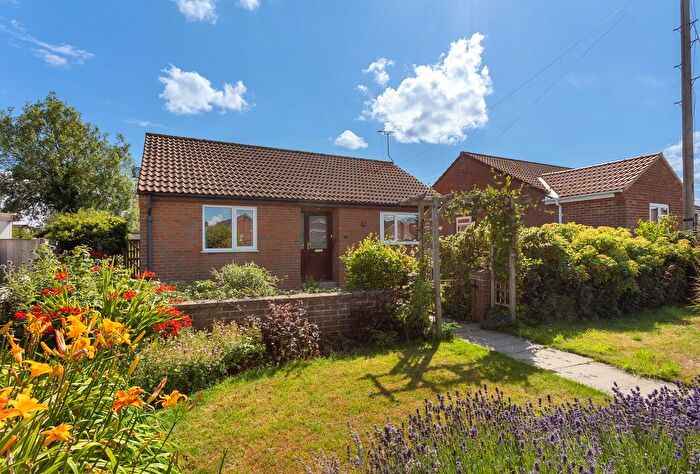
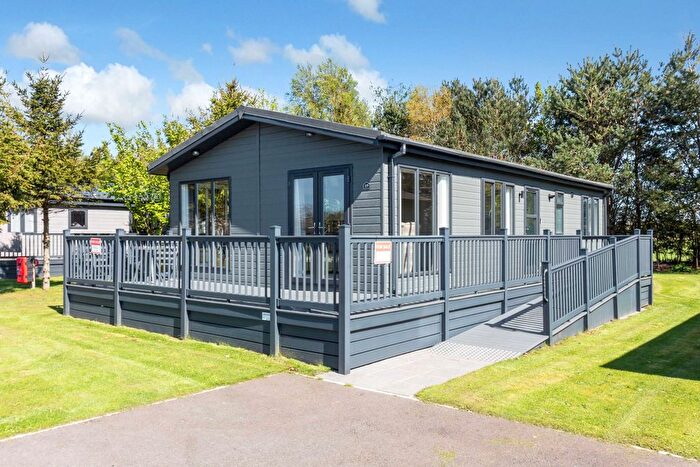
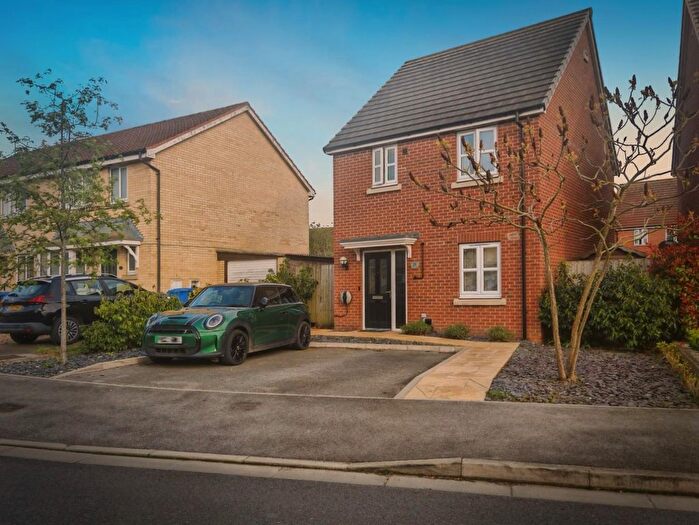
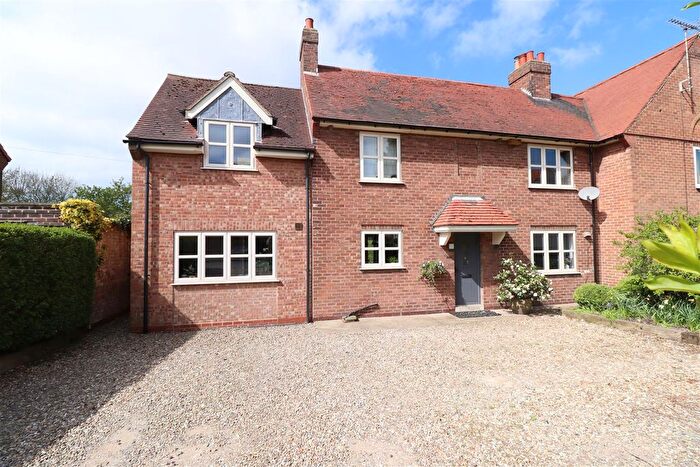
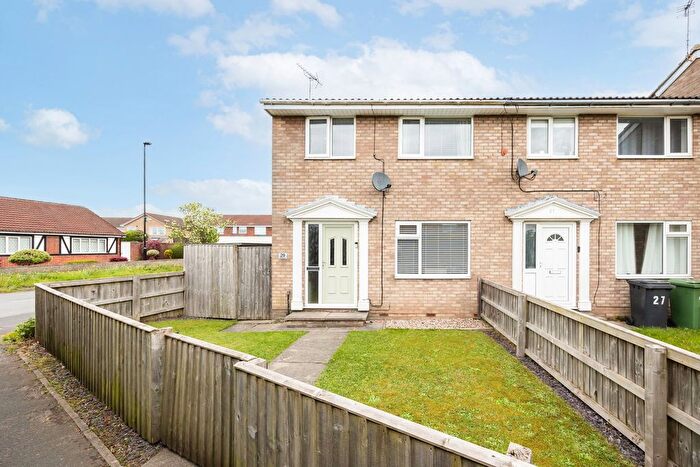
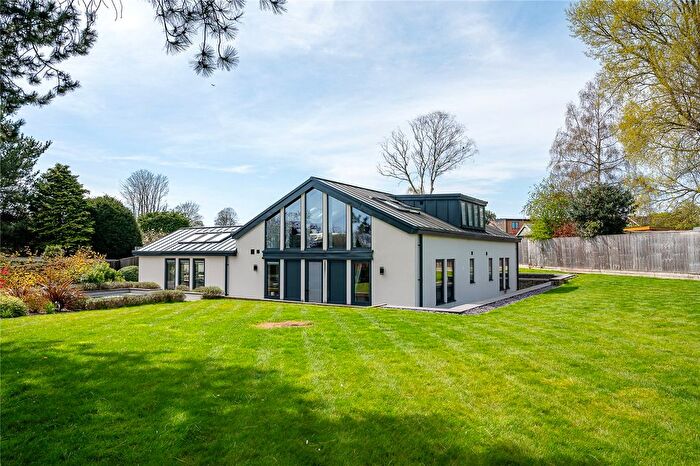
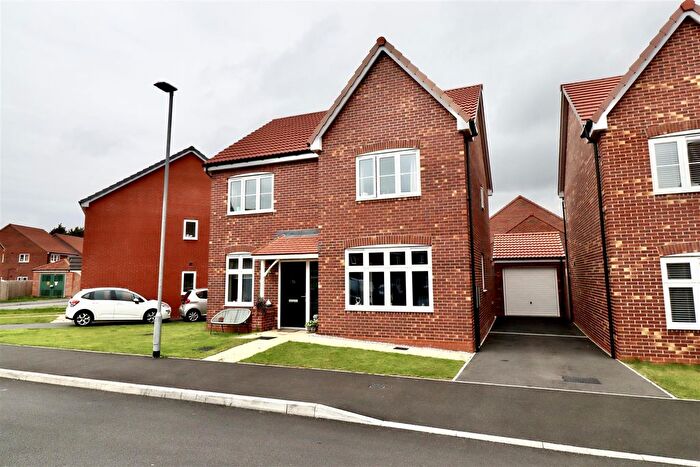
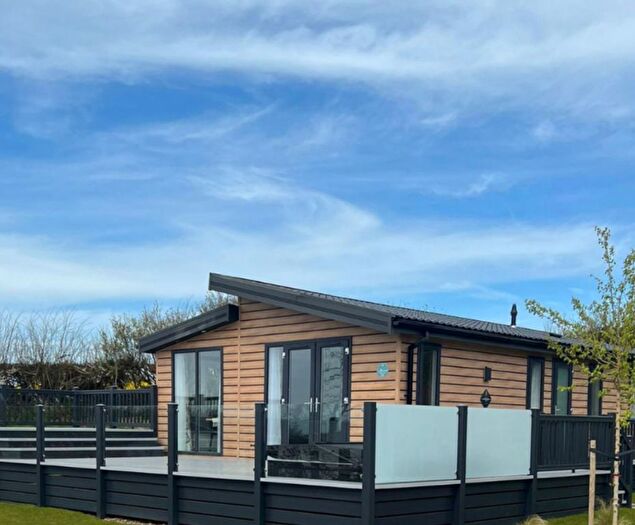
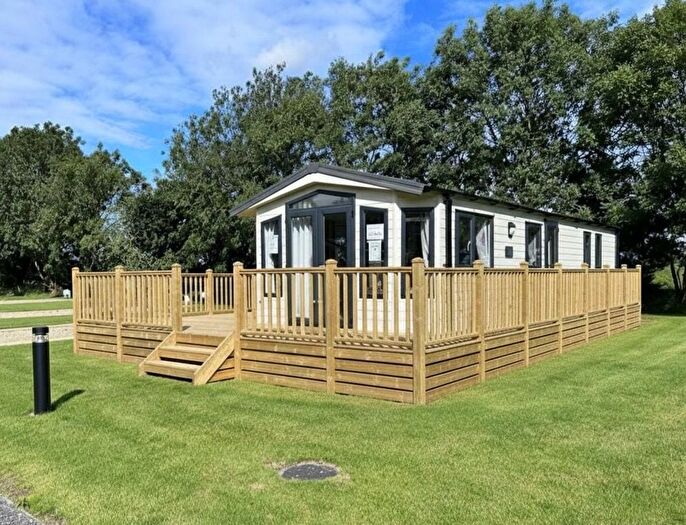
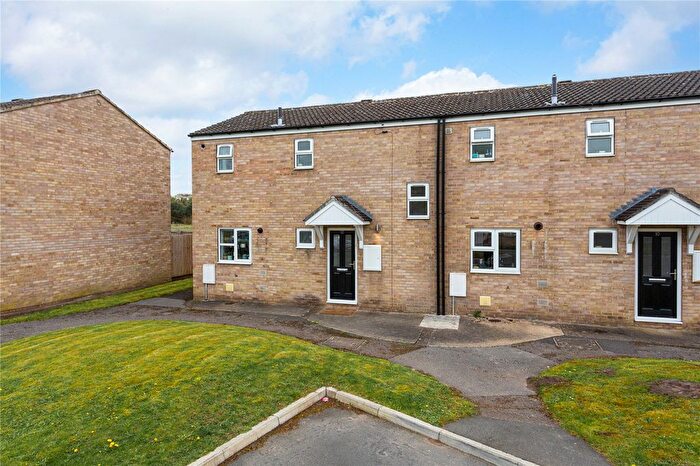
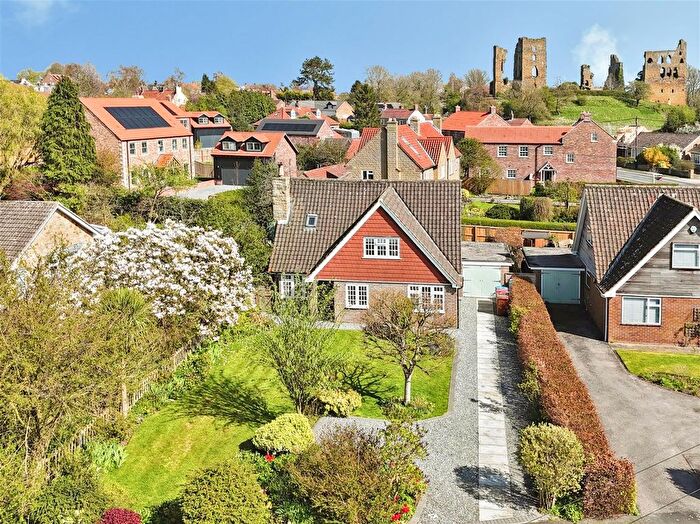
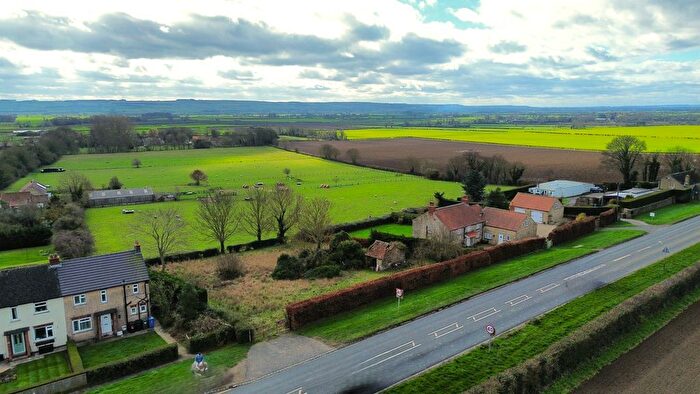
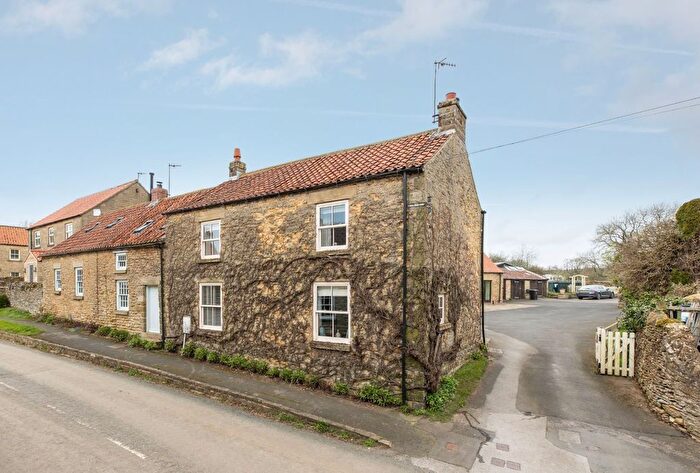
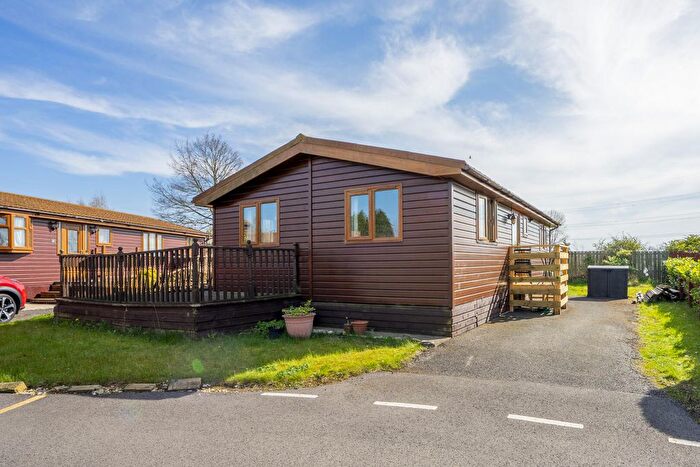
Properties for sale near YO17
![]()
If you are looking to sell your house, let it out, or receive a property valuation, an expert can help you.
Click the button below to get started.
Frequently Asked Questions about YO17
What is the average price for a property for sale in YO17?
The average price for a property for sale in YO17 is £293,563. There are 20 property listings for sale in YO17.
Which areas are included in the YO17 postcode district?
The main area within YO17 is Norton.
What are the most common property types in YO17?
The most common property types in YO17 are Semi Detached Houses, Detached Houses, Terraced Houses and Flats.
What has been the average sold property price in YO17 over the last three years?
Semi Detached Houses in YO17 have an average sold price of £267,575, while Detached Houses have an average of £411,834. Terraced Houses have an average of £206,427 and Flats have an average of £126,866. The average sold property price in YO17 over the last three years is approximately £288,150.
Which train stations are available in YO17?
The train station available in YO17 is Malton Station..