
Properties for sale in YO23
South Bank, Bishopthorpe, Copmanthorpe, Rufforth
- Info
- Price Paid By Year
- Property Type Price
- Transport
House Prices in YO23
Properties in YO23 have an average house price of £398,147.00 and had 948 Property Transactions within the last 3 years.
The most expensive property was sold for £1,650,000.00.
Property Price Paid in YO23 by Year
The average sold property price by year was:
| Year | Average Sold Price | Sold Properties |
|---|---|---|
| 2026 | £434,000.00 | 7 Properties |
| 2025 | £396,327.00 | 305 Properties |
| 2024 | £403,854.00 | 346 Properties |
| 2023 | £392,387.00 | 290 Properties |
| 2022 | £403,218.00 | 380 Properties |
| 2021 | £375,150.00 | 506 Properties |
| 2020 | £337,028.00 | 311 Properties |
| 2019 | £337,291.00 | 382 Properties |
| 2018 | £334,475.00 | 386 Properties |
| 2017 | £341,494.00 | 513 Properties |
| 2016 | £330,565.00 | 460 Properties |
| 2015 | £274,441.00 | 424 Properties |
| 2014 | £275,824.00 | 406 Properties |
| 2013 | £237,454.00 | 392 Properties |
| 2012 | £232,069.00 | 327 Properties |
| 2011 | £229,861.00 | 346 Properties |
| 2010 | £231,252.00 | 293 Properties |
| 2009 | £220,761.00 | 317 Properties |
| 2008 | £240,324.00 | 232 Properties |
| 2007 | £252,411.00 | 480 Properties |
| 2006 | £212,042.00 | 527 Properties |
| 2005 | £209,700.00 | 429 Properties |
| 2004 | £201,327.00 | 402 Properties |
| 2003 | £168,823.00 | 505 Properties |
| 2002 | £149,588.00 | 538 Properties |
| 2001 | £116,436.00 | 546 Properties |
| 2000 | £99,720.00 | 596 Properties |
| 1999 | £87,731.00 | 571 Properties |
| 1998 | £79,366.00 | 487 Properties |
| 1997 | £73,021.00 | 574 Properties |
| 1996 | £68,508.00 | 441 Properties |
| 1995 | £67,171.00 | 337 Properties |
Property Price per Property Type in YO23
Here you can find historic sold price data in order to help with your property search.
The average Property Paid Price for specific property types in the last three years are:
| Property Type | Average Sold Price | Sold Properties |
|---|---|---|
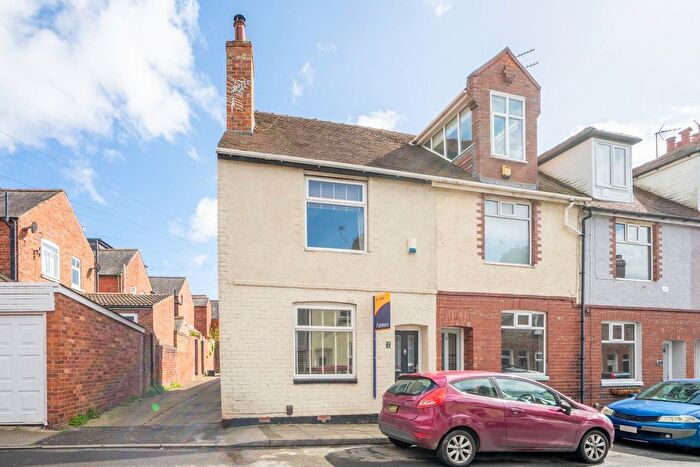
| Semi Detached House | £390,066.00 | 179 Semi Detached Houses |
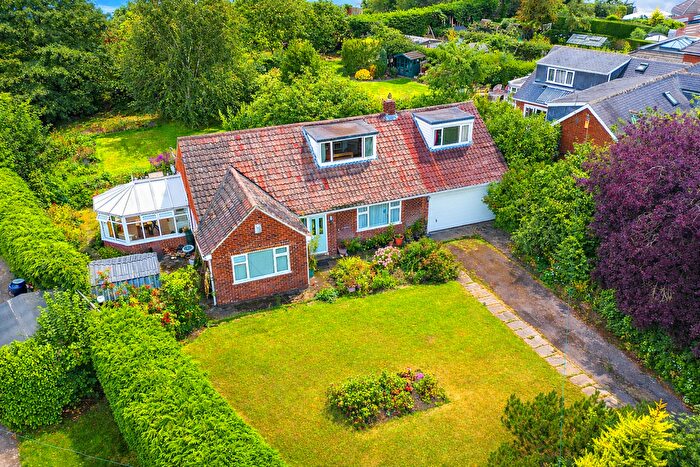
| Detached House | £527,465.00 | 231 Detached Houses |
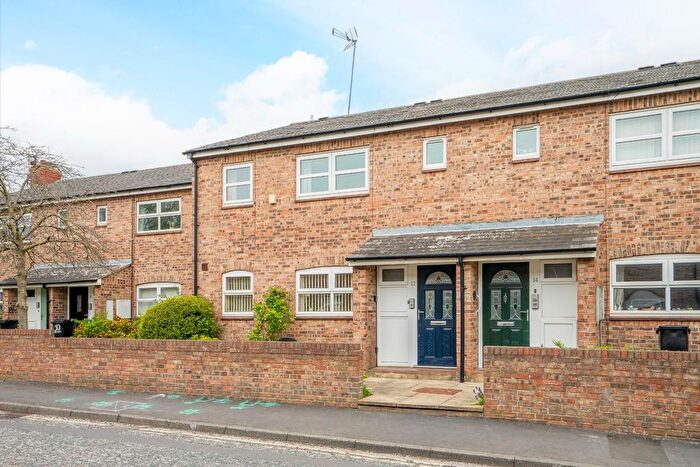
| Terraced House | £359,399.00 | 432 Terraced Houses |
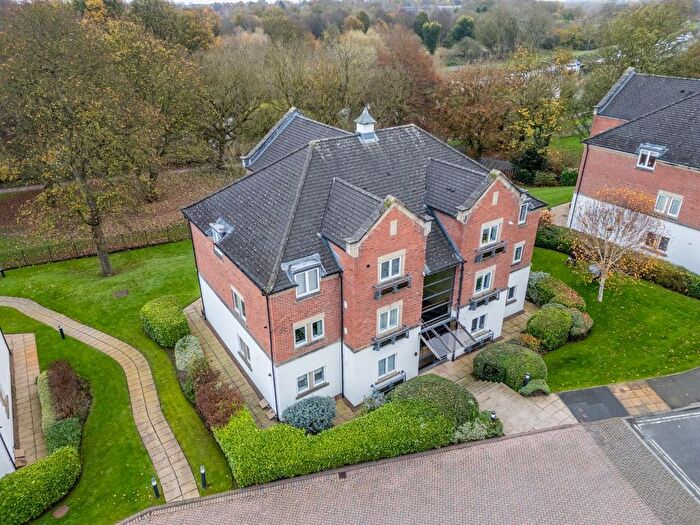
| Flat | £287,894.00 | 106 Flats |
Transport near YO23

Houses and Flats for sale in YO23, South Bank, Bishopthorpe, Copmanthorpe, Rufforth
![]()
If you are looking to sell your house, let it out, or receive a property valuation, an expert can help you.
Click the button below to get started.
Frequently Asked Questions about YO23
What is the average price for a property for sale in YO23?
The average price for a property for sale in YO23 is £398,147. There are 105 property listings for sale in YO23.
Which areas are included in the YO23 postcode district?
The main areas within YO23 include South Bank, Bishopthorpe, Copmanthorpe and Rufforth.
What are the most common property types in YO23?
The most common property types in YO23 are Terraced Houses, Detached Houses, Semi Detached Houses and Flats.
What has been the average sold property price in YO23 over the last three years?
Terraced Houses in YO23 have an average sold price of £359,399, while Detached Houses have an average of £527,465. Semi Detached Houses have an average of £390,066 and Flats have an average of £287,894. The average sold property price in YO23 over the last three years is approximately £411,394.