
Properties to rent in ML9
Netherburn, Stonehouse, Ashgill
There are 104 results. Rental prices in ML9 range from £650 pcm to £2k pcm with an average price of £979 pcm.
Houses and Flats to rent in ML9, Netherburn, Stonehouse, Ashgill


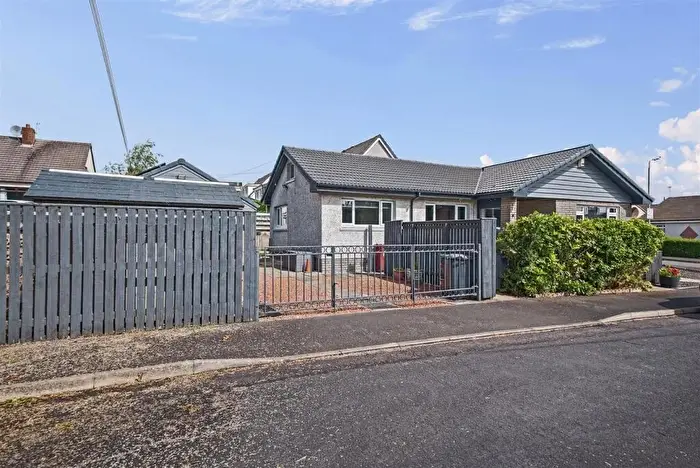

 4 Bedrooms
 2 Bathrooms



Save this search to be notified as soon as new listings are available.


Properties to rent near ML9


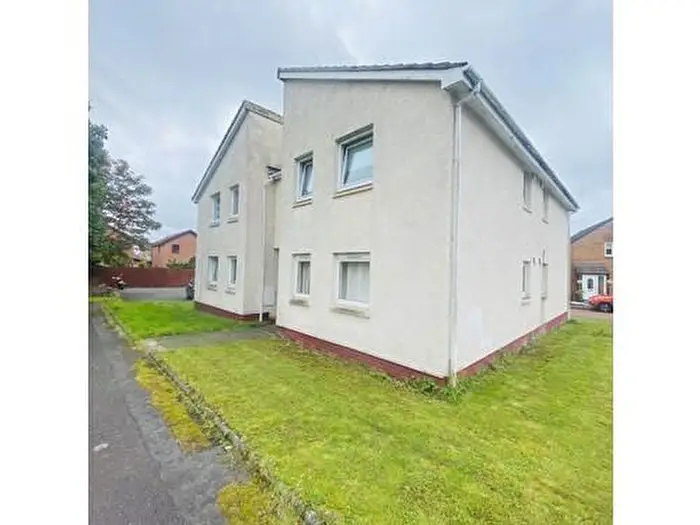

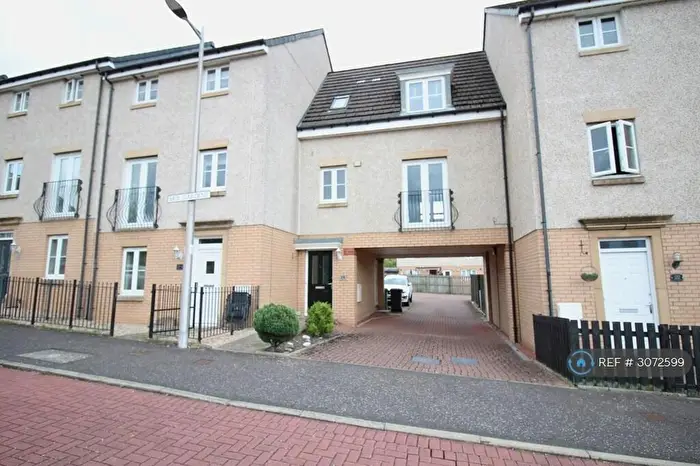

Save this search to be notified as soon as new listings are available.




Rental market in ML9
What's to rent
11 homes · share, count and typical rentHow many bedrooms
share, count and typical rentRent bands
11 homesAsking rents over time
typical rent of the homes first listed each quarter · +19.3% since 2024 Q4Rents in and around ML9
typical rent, cheapest firstGetting to know ML9
stations in ML9Based on 11 homes to rent on Houses now, 147 listings that left the market in the last 12 months, the asking rents of the homes listed over the last two years. Sold prices: HM Land Registry Price Paid Data, Aug 2025 to Jul 2026 (Crown copyright). Schools: Ofsted. Updated October 2026.
Frequently asked questions about renting in ML9
What is the average rent in ML9?
The average rent for a home in ML9 is £850 a month. A typical home, the one in the middle of the range, is £875 a month. This is based on the 11 homes to rent on Houses right now.
What is the price range of rental homes in ML9?
Most rents in ML9 are between £650 and £1,500 a month, leaving out the very cheapest and most expensive. One in five rents for less than £700 a month, and one in five £1,000 a month or more.
How many homes are available to rent in ML9?
There are 10 homes to rent in ML9 on Houses right now, plus 2 already let agreed. 19 new listings came onto the market in the last 30 days.
Are rents going up in ML9?
Yes. Homes put up to rent in ML9 over the last 12 months were advertised at a typical £850 a month, 6.6% higher than the year before (£795 a month). By size, 1-bedroom homes are up 20% and 3-bedroom homes are up 11%.
How quickly do rental homes let in ML9?
Most rental homes are let or taken off the market within about 2 weeks. About 76% go within the first month.
What rental yield can I get in ML9?
Around 6.8% gross. That compares a typical rent of £875 a month with a typical sold price of £155,000. Running costs, voids and mortgage interest are not taken off.
What type of homes can I rent in ML9?
Flats and apartments are the most common, about 4 in 10 homes to rent in ML9. Semi-detached houses come next, followed by terraced houses.
Where is it cheaper to rent near ML9?
Of the areas around ML9, ML8 is the cheapest, with a typical rent of £650 a month, followed by ML2 (£775 a month) and ML1 (£850 a month). ML9 itself is £875 a month.
Which train stations are in or near ML9?
Stations in ML9 include Larkhall and Merryton.