
Properties for sale in AB43
Crimond
- Info
- Price Paid By Year
- Transport
House Prices in AB43
Properties in AB43 have an average house price of £157,439.00 and had 820 Property Transactions within the last 3 years.
The most expensive property was sold for £975,000.00.
Property Price Paid in AB43 by Year
Loading ...
The average sold property price by year was:
| Year | Average Sold Price | Sold Properties |
|---|---|---|
| 2023 | £151,381.00 | 46 Properties |
| 2022 | £158,517.00 | 354 Properties |
| 2021 | £157,193.00 | 420 Properties |
| 2020 | £142,002.00 | 288 Properties |
| 2019 | £153,464.00 | 315 Properties |
| 2018 | £151,638.00 | 303 Properties |
| 2017 | £145,539.00 | 370 Properties |
| 2016 | £158,921.00 | 363 Properties |
| 2015 | £154,681.00 | 316 Properties |
| 2014 | £135,773.00 | 389 Properties |
| 2013 | £132,662.00 | 324 Properties |
| 2012 | £136,864.00 | 293 Properties |
| 2011 | £136,008.00 | 269 Properties |
| 2010 | £127,725.00 | 278 Properties |
| 2009 | £140,264.00 | 270 Properties |
| 2008 | £121,218.00 | 400 Properties |
| 2007 | £109,242.00 | 450 Properties |
| 2006 | £80,290.00 | 417 Properties |
| 2005 | £67,969.00 | 501 Properties |
| 2004 | £61,835.00 | 483 Properties |
| 2003 | £51,308.00 | 481 Properties |
| 2002 | £56,656.00 | 562 Properties |
| 2001 | £40,410.00 | 20 Properties |

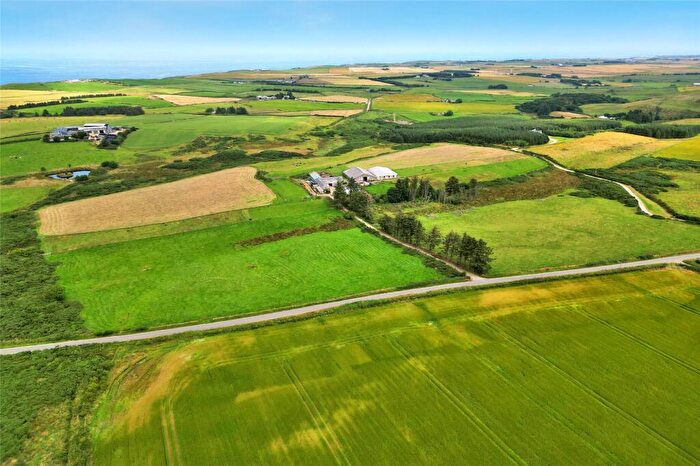
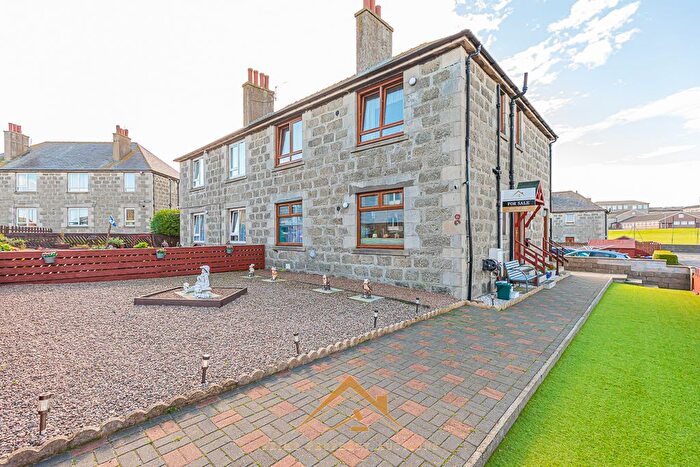
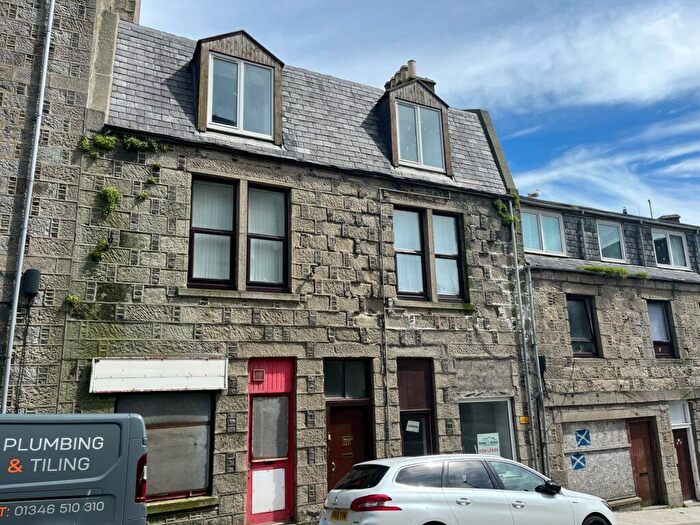
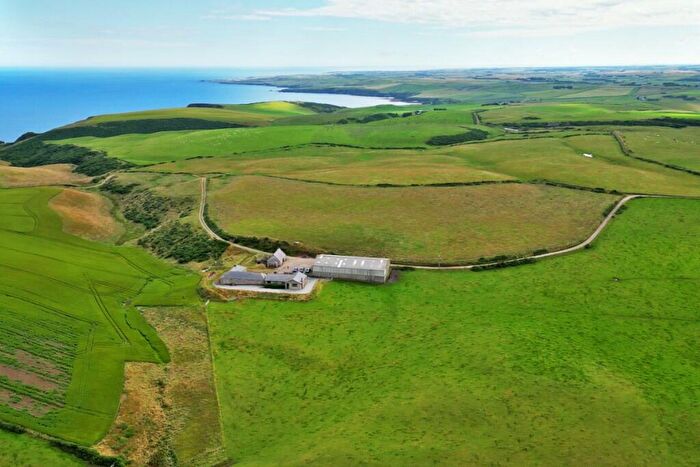
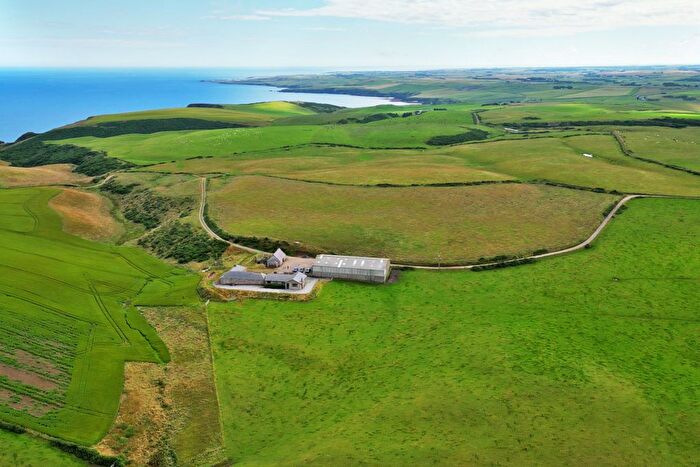
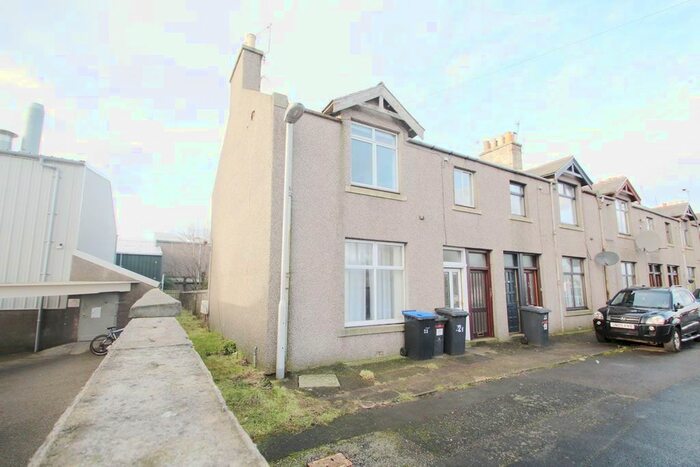
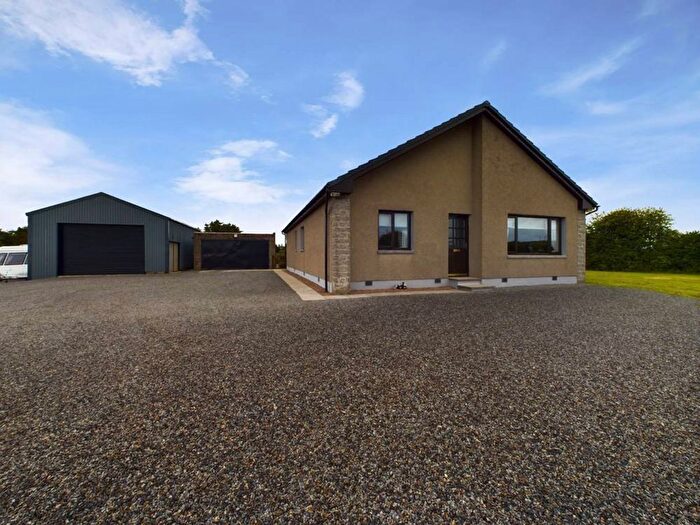
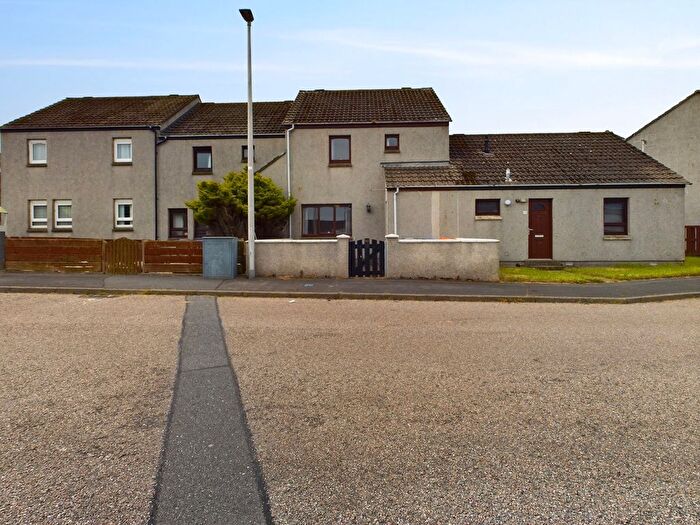
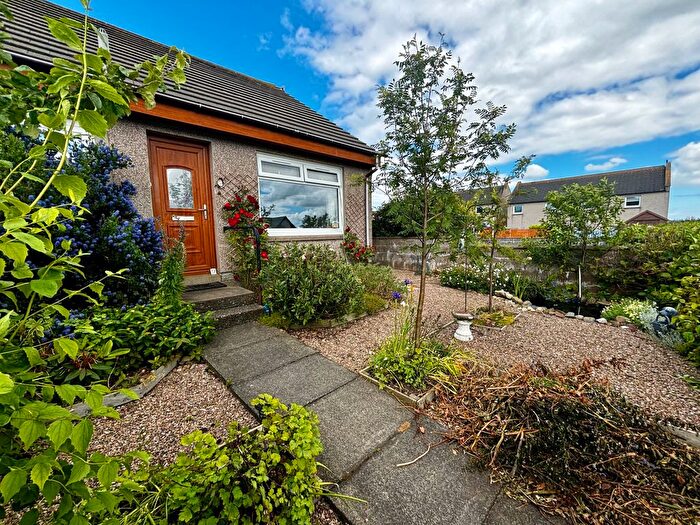
Houses and Flats for sale in AB43, Crimond


![]()
Save this search to be notified as soon as new listings are available.


Frequently Asked Questions about AB43
What is the average price for a property for sale in AB43?
The average price for a property for sale in AB43 is £157,439. There are 60 property listings for sale in AB43.
Which areas are included in the AB43 postcode district?
The main area within AB43 is Crimond.
What are the most common property types in AB43?
The most common property types in AB43 are Unknowns.
What has been the average sold property price in AB43 over the last three years?
Unknowns in AB43 have an average sold price of £157,439. The average sold property price in AB43 over the last three years is approximately £155,697.