
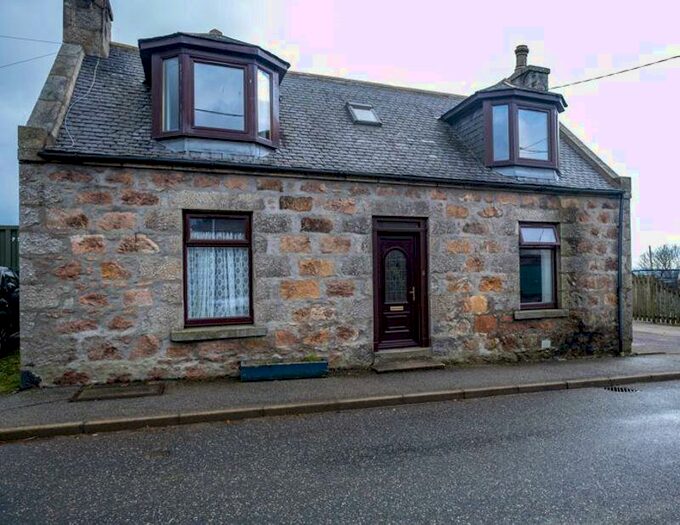
Houses for sale & to rent in Central Buchan, Turriff
House Prices in Central Buchan
Properties in Central Buchan have an average house price of £198,320.00 and had 50 Property Transactions within the last 3 years¹.
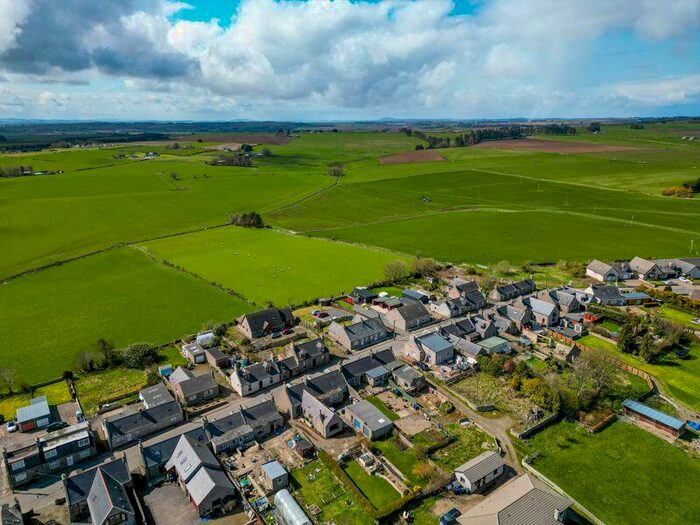
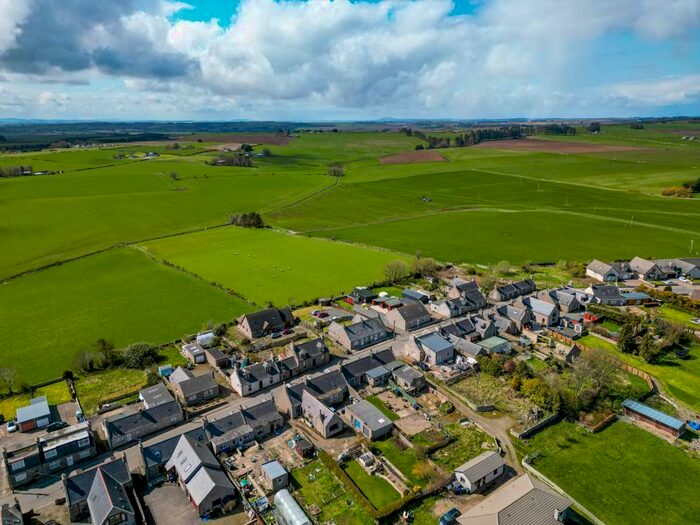
Central Buchan is an area in Turriff, Aberdeenshire with 533 households², where the most expensive property was sold for £450,000.00.
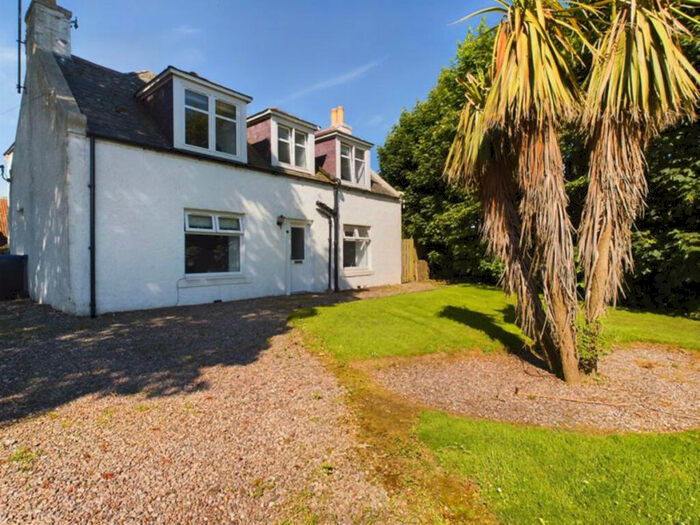
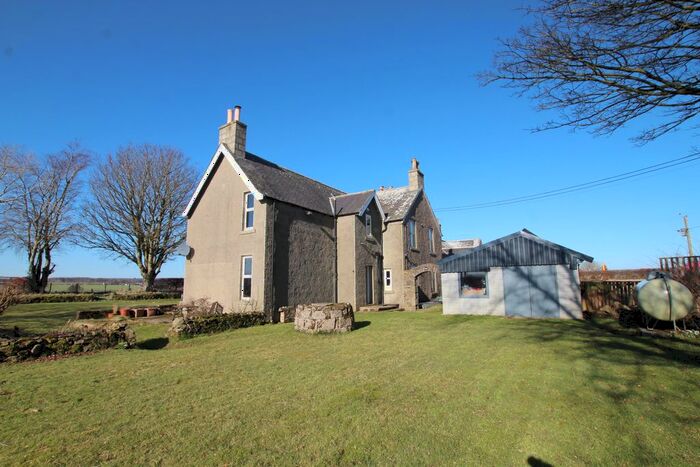
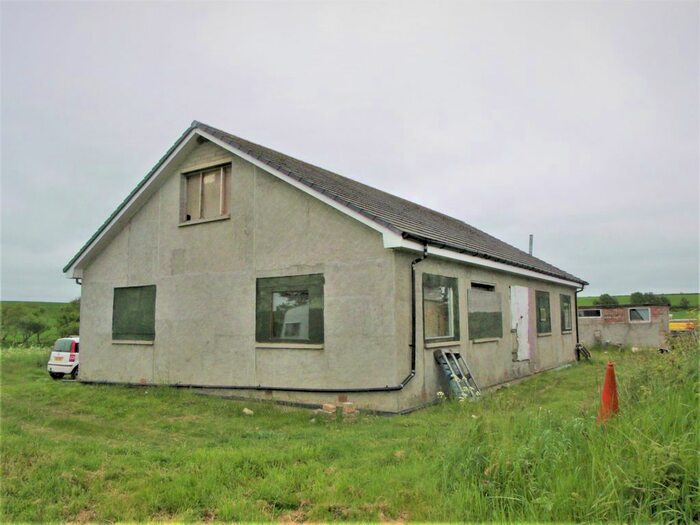
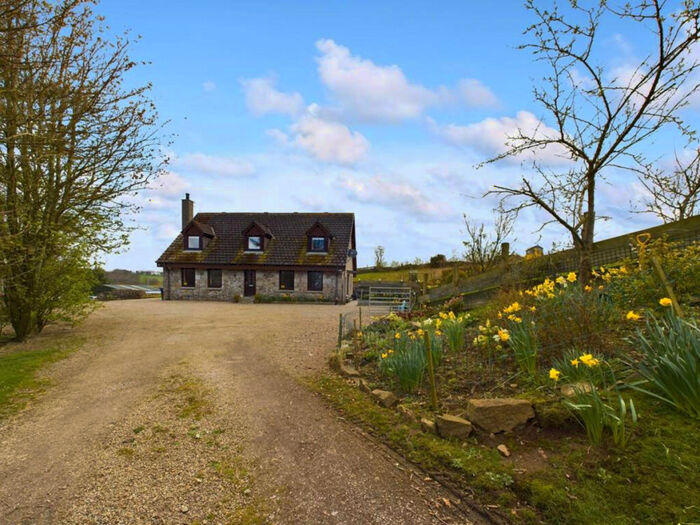
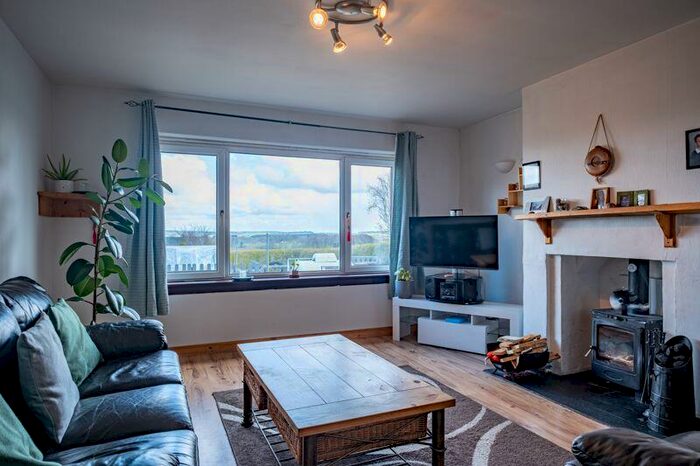
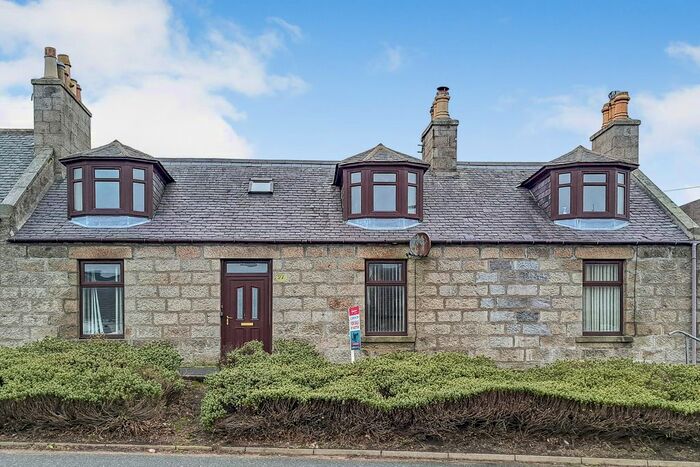
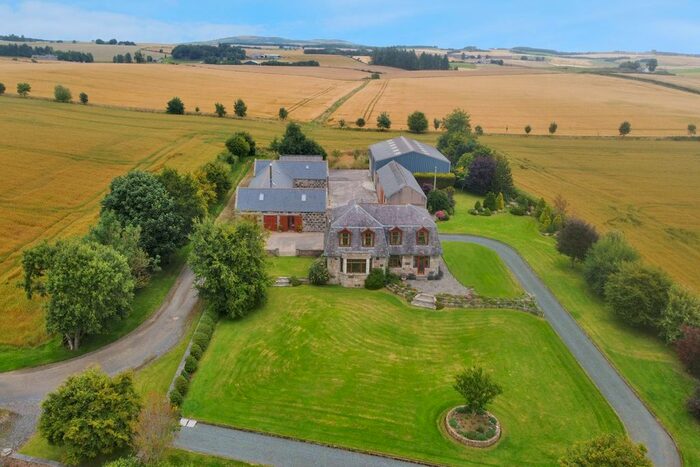
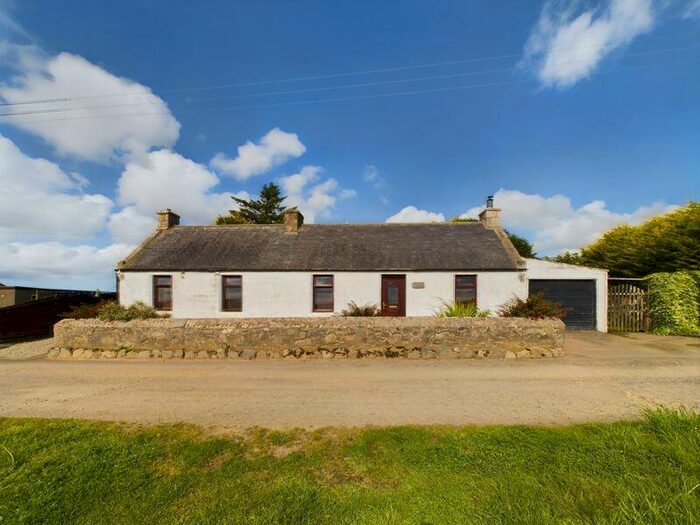
Properties for sale in Central Buchan


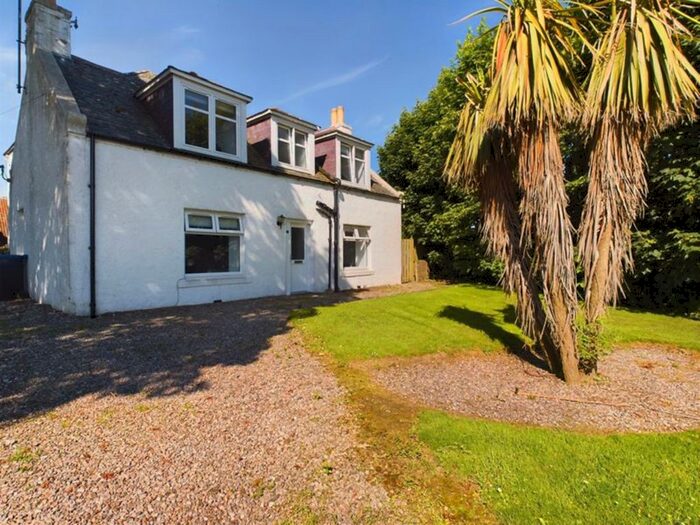
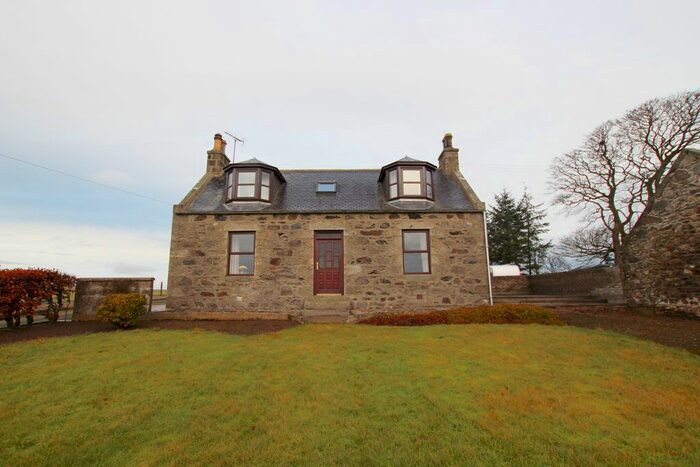
Previously listed properties in Central Buchan


Roads and Postcodes in Central Buchan
Navigate through our locations to find the location of your next house in Central Buchan, Turriff for sale or to rent.
Transport near Central Buchan

- FAQ
- Price Paid By Year
Frequently asked questions about Central Buchan
What is the average price for a property for sale in Central Buchan?
The average price for a property for sale in Central Buchan is £198,320. This amount is 8% higher than the average price in Turriff. There are 45 property listings for sale in Central Buchan.
What streets have the most expensive properties for sale in Central Buchan?
The streets with the most expensive properties for sale in Central Buchan are Pirie Road at an average of £270,000, Stoneybank Gardens at an average of £227,500 and Fordyce Terrace at an average of £205,166.
What streets have the most affordable properties for sale in Central Buchan?
The streets with the most affordable properties for sale in Central Buchan are Stoneybank Terrace at an average of £94,000, Fordyce Road at an average of £132,000 and Main Street at an average of £137,666.
Which train stations are available in or near Central Buchan?
Some of the train stations available in or near Central Buchan are Inverurie, Insch and Huntly.
Property Price Paid in Central Buchan by Year
The average sold property price by year was:
| Year | Average Sold Price | Price Change |
Sold Properties
|
|---|---|---|---|
| 2023 | £153,500 | -44% |
2 Properties |
| 2022 | £221,160 | 23% |
28 Properties |
| 2021 | £170,825 | 4% |
20 Properties |
| 2020 | £164,666 | 5% |
21 Properties |
| 2019 | £156,728 | -2% |
23 Properties |
| 2018 | £160,211 | 1% |
19 Properties |
| 2017 | £159,179 | -17% |
24 Properties |
| 2016 | £185,894 | 1% |
14 Properties |
| 2015 | £183,416 | 7% |
32 Properties |
| 2014 | £170,175 | -10% |
29 Properties |
| 2013 | £187,780 | 24% |
23 Properties |
| 2012 | £143,358 | -34% |
24 Properties |
| 2011 | £191,922 | 26% |
16 Properties |
| 2010 | £141,807 | -2% |
13 Properties |
| 2009 | £143,976 | -8% |
25 Properties |
| 2008 | £154,903 | -22% |
19 Properties |
| 2007 | £189,071 | 30% |
32 Properties |
| 2006 | £131,786 | 14% |
29 Properties |
| 2005 | £113,640 | 8% |
31 Properties |
| 2004 | £104,645 | 30% |
36 Properties |
| 2003 | £72,946 | -25% |
43 Properties |
| 2002 | £91,146 | 38% |
41 Properties |
| 2001 | £56,500 | - |
2 Properties |