
Houses for sale & to rent in Troup, Turriff
House Prices in Troup
Properties in Troup have an average house price of £172,249.00 and had 35 Property Transactions within the last 3 years¹.
Troup is an area in Turriff, Aberdeenshire with 402 households², where the most expensive property was sold for £500,000.00.
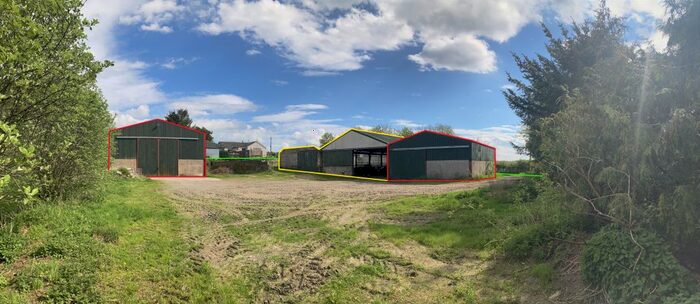
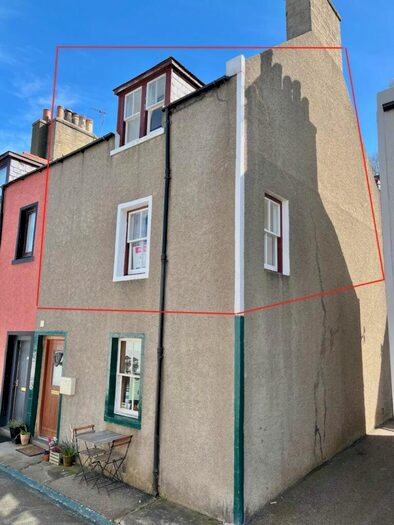
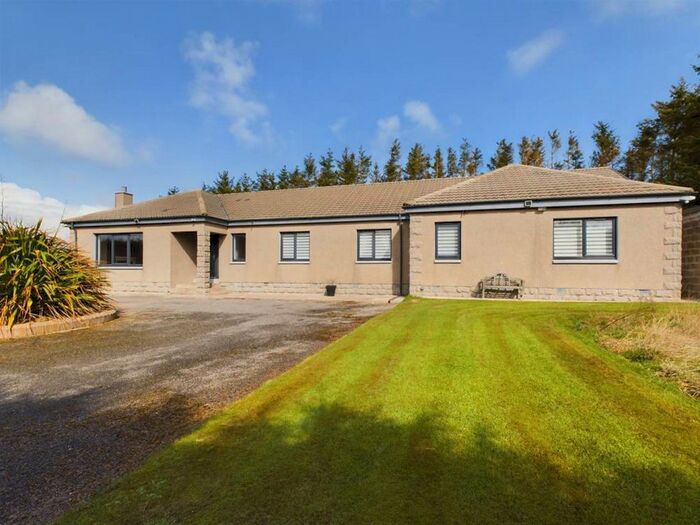
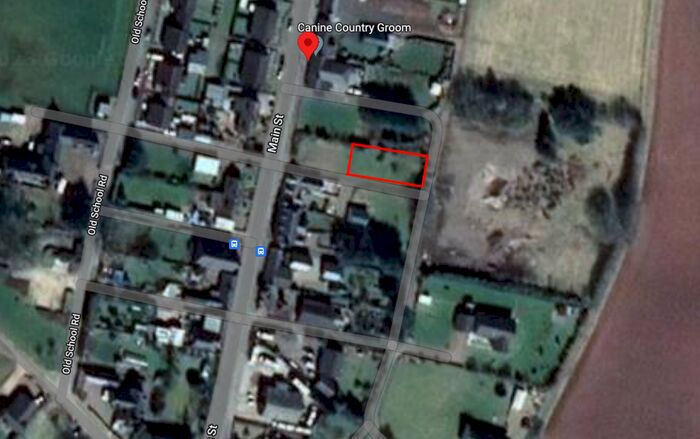
Properties for sale in Troup


Previously listed properties in Troup


Roads and Postcodes in Troup
Navigate through our locations to find the location of your next house in Troup, Turriff for sale or to rent.
| Streets | Postcodes |
|---|---|
| Bridge Street | AB53 5XB |
| Bridge Terrace | AB53 5PB |
| Hawthorn Crescent | AB53 5QF |
| Kirkhill | AB53 5XG |
| Main Street | AB53 5XD |
| Old School Road | AB53 5PD |
| The Square | AB53 5PE |
| Urquhart Road | AB53 5XE |
| AB53 4NH AB53 4NJ AB53 4NL AB53 4NN AB53 4NP AB53 4NQ AB53 4NR AB53 4NS AB53 4NU AB53 5GU AB53 5NT AB53 5PA AB53 5PT AB53 5PU AB53 5PW AB53 5PX AB53 5PY AB53 5QA AB53 5QB AB53 5QD AB53 5QE AB53 5QH AB53 5QJ AB53 5QL AB53 5QN AB53 5QP AB53 5QQ AB53 5QR AB53 5RH AB53 5RJ AB53 5RP AB53 5RR AB53 5RS AB53 5RT AB53 5RW AB53 5RX AB53 5RY AB53 5SA AB53 5SB AB53 5SD AB53 5SE AB53 5SH AB53 5SJ AB53 5SL AB53 5SN AB53 5SQ AB53 5SR AB53 5SS AB53 5ST AB53 5SU AB53 5SW AB53 5SX AB53 5TX AB53 5TY AB53 5UA AB53 5UD AB53 5UJ AB53 5XF AB53 5XH AB53 5XJ AB53 5XL AB53 5XN AB53 5XP AB53 5XQ AB53 5XR AB53 5XS AB53 5XT AB53 5XU |
Transport near Troup

- FAQ
- Price Paid By Year
Frequently asked questions about Troup
What is the average price for a property for sale in Troup?
The average price for a property for sale in Troup is £172,249. This amount is 6% lower than the average price in Turriff. There are 132 property listings for sale in Troup.
What streets have the most expensive properties for sale in Troup?
The streets with the most expensive properties for sale in Troup are Urquhart Road at an average of £205,000 and Bridge Street at an average of £122,428.
What streets have the most affordable properties for sale in Troup?
The streets with the most affordable properties for sale in Troup are Bridge Terrace at an average of £101,000 and Main Street at an average of £120,000.
Which train stations are available in or near Troup?
Some of the train stations available in or near Troup are Huntly, Insch and Inverurie.
Property Price Paid in Troup by Year
The average sold property price by year was:
| Year | Average Sold Price | Price Change |
Sold Properties
|
|---|---|---|---|
| 2023 | £180,000 | -9% |
3 Properties |
| 2022 | £196,357 | 22% |
14 Properties |
| 2021 | £152,207 | 2% |
18 Properties |
| 2020 | £149,503 | -18% |
13 Properties |
| 2019 | £176,500 | 24% |
9 Properties |
| 2018 | £134,508 | -48% |
6 Properties |
| 2017 | £199,000 | 1% |
5 Properties |
| 2016 | £196,125 | 1% |
12 Properties |
| 2015 | £195,071 | 18% |
14 Properties |
| 2014 | £159,602 | -7% |
19 Properties |
| 2013 | £171,016 | 25% |
15 Properties |
| 2012 | £128,888 | -41% |
9 Properties |
| 2011 | £182,055 | 4% |
9 Properties |
| 2010 | £175,562 | 39% |
8 Properties |
| 2009 | £107,900 | -50% |
10 Properties |
| 2008 | £161,726 | -3% |
12 Properties |
| 2007 | £166,658 | 13% |
17 Properties |
| 2006 | £145,161 | 34% |
19 Properties |
| 2005 | £95,369 | -20% |
23 Properties |
| 2004 | £114,728 | 53% |
16 Properties |
| 2003 | £54,062 | -2% |
21 Properties |
| 2002 | £55,070 | -26% |
24 Properties |
| 2001 | £69,625 | - |
2 Properties |