
Houses for sale & to rent in Johnstone, Renfrewshire
House Prices in Johnstone
Properties in Johnstone have an average house price of £180,350.00 and had 1,378 Property Transactions within the last 3 years.¹
Johnstone is an area in Renfrewshire with 15,560 households², where the most expensive property was sold for £775,000.00.
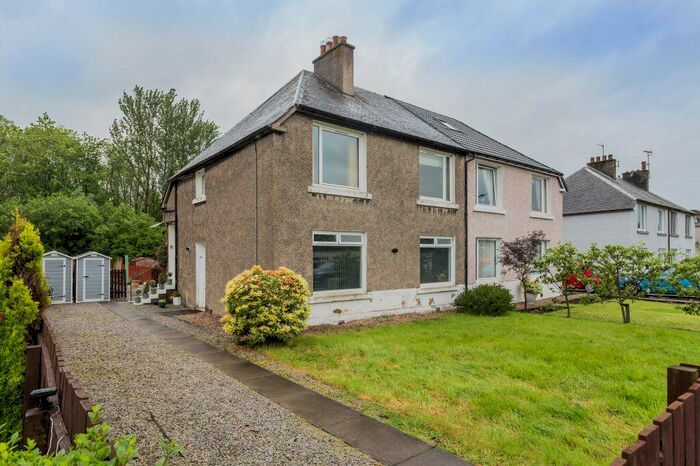
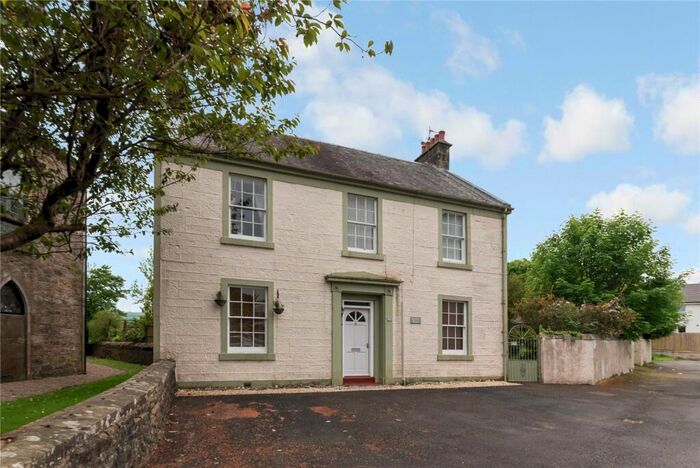
Properties for sale in Johnstone


Neighbourhoods in Johnstone
Navigate through our locations to find the location of your next house in Johnstone, Renfrewshire for sale or to rent.
Transport in Johnstone
Please see below transportation links in this area:

- FAQ
- Price Paid By Year
Frequently asked questions about Johnstone
What is the average price for a property for sale in Johnstone?
The average price for a property for sale in Johnstone is £180,350. This amount is 14% higher than the average price in Renfrewshire. There are more than 10,000 property listings for sale in Johnstone.
What locations have the most expensive properties for sale in Johnstone?
The locations with the most expensive properties for sale in Johnstone are Houston, Crosslee and Linwood at an average of £290,457 and Bishopton, Bridge of Weir and Langbank at an average of £245,000.
What locations have the most affordable properties for sale in Johnstone?
The locations with the most affordable properties for sale in Johnstone are Johnstone South and Elderslie at an average of £144,002 and Johnstone North, Kilbarchan, Howwood and Lochwinnoch at an average of £147,743.
Which train stations are available in or near Johnstone?
Some of the train stations available in or near Johnstone are Johnstone, Milliken Park and Howwood.
Property Price Paid in Johnstone by Year
The average sold property price by year was:
| Year | Average Sold Price | Price Change |
Sold Properties
|
|---|---|---|---|
| 2023 | £186,642 | -5% |
119 Properties |
| 2022 | £196,570 | 17% |
622 Properties |
| 2021 | £163,337 | -7% |
637 Properties |
| 2020 | £174,598 | 1% |
571 Properties |
| 2019 | £172,158 | 2% |
685 Properties |
| 2018 | £167,943 | 10% |
724 Properties |
| 2017 | £150,735 | 2% |
653 Properties |
| 2016 | £148,092 | 2% |
566 Properties |
| 2015 | £145,156 | 7% |
532 Properties |
| 2014 | £134,521 | 7% |
497 Properties |
| 2013 | £124,981 | -10% |
434 Properties |
| 2012 | £136,997 | 7% |
356 Properties |
| 2011 | £127,701 | -4% |
312 Properties |
| 2010 | £132,509 | 3% |
382 Properties |
| 2009 | £128,987 | -12% |
338 Properties |
| 2008 | £144,244 | 4% |
604 Properties |
| 2007 | £138,157 | 12% |
818 Properties |
| 2006 | £121,916 | 1% |
823 Properties |
| 2005 | £121,018 | 15% |
828 Properties |
| 2004 | £103,325 | 27% |
702 Properties |
| 2003 | £75,393 | 5% |
858 Properties |
| 2002 | £71,256 | 16% |
911 Properties |
| 2001 | £60,065 | -108% |
82 Properties |
| 1996 | £125,000 | - |
1 Property |