
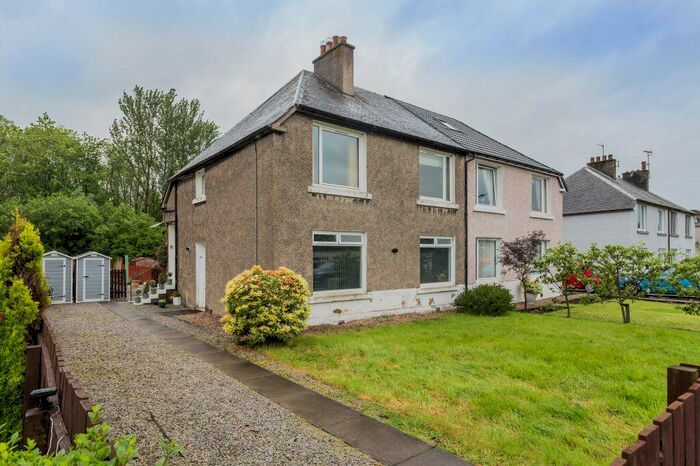
Houses for sale & to rent in Paisley, Renfrewshire
House Prices in Paisley
Properties in Paisley have an average house price of £127,466.00 and had 4,059 Property Transactions within the last 3 years.¹
Paisley is an area in Renfrewshire with 41,749 households², where the most expensive property was sold for £816,000.00.
Properties for sale in Paisley


Neighbourhoods in Paisley
Navigate through our locations to find the location of your next house in Paisley, Renfrewshire for sale or to rent.
Transport in Paisley
Please see below transportation links in this area:
-
 Paisley Canal Station
 -
Paisley Gilmour Street Station
-
Paisley St.James Station
-
Hawkhead Station
-
Hillington West Station
-
Crookston Glasgow Station
-
Johnstone Station
-
Barrhead Station
- FAQ
- Price Paid By Year
Frequently asked questions about Paisley
What is the average price for a property for sale in Paisley?
The average price for a property for sale in Paisley is £127,466. This amount is 20% lower than the average price in Renfrewshire. There are more than 10,000 property listings for sale in Paisley.
What locations have the most expensive properties for sale in Paisley?
The locations with the most expensive properties for sale in Paisley are Johnstone South and Elderslie at an average of £206,849, Paisley Northeast and Ralston at an average of £161,741 and Paisley Southeast at an average of £139,123.
What locations have the most affordable properties for sale in Paisley?
The locations with the most affordable properties for sale in Paisley are Houston, Crosslee and Linwood at an average of £95,844, Paisley Northwest at an average of £101,456 and Renfrew South and Gallowhill at an average of £105,228.
Which train stations are available in or near Paisley?
Some of the train stations available in or near Paisley are Paisley Canal, Paisley Gilmour Street and Paisley St.James.
Property Price Paid in Paisley by Year
The average sold property price by year was:
| Year | Average Sold Price | Price Change |
Sold Properties
|
|---|---|---|---|
| 2023 | £120,244 | -9% |
335 Properties |
| 2022 | £131,299 | 5% |
1,731 Properties |
| 2021 | £125,350 | 3% |
1,993 Properties |
| 2020 | £122,209 | 4% |
1,406 Properties |
| 2019 | £117,077 | 5% |
1,721 Properties |
| 2018 | £111,792 | 2% |
1,599 Properties |
| 2017 | £109,812 | -1% |
1,681 Properties |
| 2016 | £111,080 | -2% |
1,705 Properties |
| 2015 | £113,479 | 7% |
1,495 Properties |
| 2014 | £105,010 | 6% |
1,417 Properties |
| 2013 | £98,616 | 3% |
1,221 Properties |
| 2012 | £95,848 | -10% |
1,067 Properties |
| 2011 | £105,559 | 2% |
941 Properties |
| 2010 | £103,043 | 4% |
981 Properties |
| 2009 | £99,401 | -22% |
1,100 Properties |
| 2008 | £121,335 | 2% |
1,745 Properties |
| 2007 | £119,021 | -4% |
2,164 Properties |
| 2006 | £124,246 | 26% |
2,618 Properties |
| 2005 | £91,998 | 6% |
2,626 Properties |
| 2004 | £86,504 | 16% |
2,430 Properties |
| 2003 | £72,340 | 23% |
2,399 Properties |
| 2002 | £55,351 | 16% |
2,346 Properties |
| 2001 | £46,488 | - |
167 Properties |