
Houses for sale & to rent in Tredegar, Caerffili - Caerphilly
House Prices in Tredegar
Properties in Tredegar have an average house price of £125,651.00 and had 209 Property Transactions within the last 3 years.¹
Tredegar is an area in Caerffili - Caerphilly with 3,031 households², where the most expensive property was sold for £495,000.00.
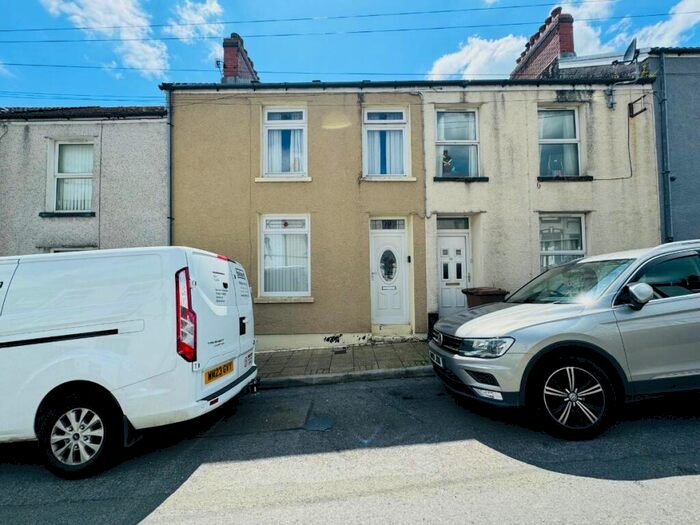
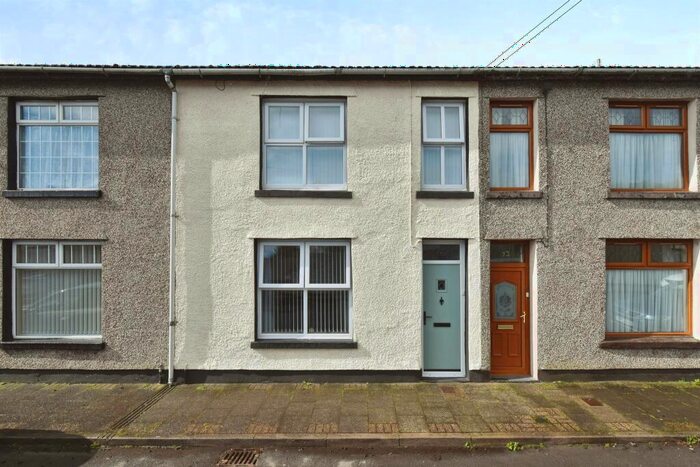
Properties for sale in Tredegar


Neighbourhoods in Tredegar
Navigate through our locations to find the location of your next house in Tredegar, Caerffili - Caerphilly for sale or to rent.
Transport in Tredegar
Please see below transportation links in this area:
-
 Rhymney Station
 -
Pontlottyn Station
-
Tir-Phil Station
-
Ebbw Vale Town Station
-
Ebbw Vale Parkway Station
-
Brithdir Station
-
Pentre-Bach Station
-
Merthyr Tydfil Station
-
Troed-Y-Rhiw Station
- FAQ
- Price Paid By Year
- Property Type Price
Frequently asked questions about Tredegar
What is the average price for a property for sale in Tredegar?
The average price for a property for sale in Tredegar is £125,651. This amount is 36% lower than the average price in Caerffili - Caerphilly. There are 930 property listings for sale in Tredegar.
What locations have the most expensive properties for sale in Tredegar?
The locations with the most expensive properties for sale in Tredegar are Pontlottyn at an average of £210,000 and Twyn Carno at an average of £125,125.
What locations have the most affordable properties for sale in Tredegar?
The location with the most affordable properties for sale in Tredegar is Moriah at an average of £124,721.
Which train stations are available in or near Tredegar?
Some of the train stations available in or near Tredegar are Rhymney, Pontlottyn and Tir-Phil.
Property Price Paid in Tredegar by Year
The average sold property price by year was:
| Year | Average Sold Price | Price Change |
Sold Properties
|
|---|---|---|---|
| 2024 | £152,200 | 8% |
5 Properties |
| 2023 | £139,378 | 9% |
41 Properties |
| 2022 | £126,951 | 10% |
88 Properties |
| 2021 | £114,852 | 10% |
75 Properties |
| 2020 | £103,281 | 1% |
55 Properties |
| 2019 | £101,973 | 1% |
63 Properties |
| 2018 | £101,193 | 11% |
64 Properties |
| 2017 | £90,019 | 8% |
68 Properties |
| 2016 | £82,757 | 7% |
52 Properties |
| 2015 | £77,295 | -14% |
37 Properties |
| 2014 | £88,099 | 17% |
72 Properties |
| 2013 | £72,843 | -2% |
39 Properties |
| 2012 | £74,401 | -25% |
44 Properties |
| 2011 | £93,211 | 19% |
38 Properties |
| 2010 | £75,066 | -5% |
30 Properties |
| 2009 | £79,108 | -14% |
31 Properties |
| 2008 | £90,320 | 5% |
41 Properties |
| 2007 | £86,182 | 16% |
66 Properties |
| 2006 | £72,192 | -6% |
74 Properties |
| 2005 | £76,697 | 32% |
59 Properties |
| 2004 | £52,443 | 18% |
59 Properties |
| 2003 | £42,759 | 16% |
61 Properties |
| 2002 | £35,779 | 2% |
59 Properties |
| 2001 | £34,918 | 13% |
67 Properties |
| 2000 | £30,281 | -69% |
73 Properties |
| 1999 | £51,129 | 36% |
50 Properties |
| 1998 | £32,537 | 7% |
52 Properties |
| 1997 | £30,284 | -14% |
53 Properties |
| 1996 | £34,480 | 10% |
35 Properties |
| 1995 | £30,976 | - |
39 Properties |
Property Price per Property Type in Tredegar
Here you can find historic sold price data in order to help with your property search.
The average Property Paid Price for specific property types in the last three years are:
| Property Type | Average Sold Price | Sold Properties |
|---|---|---|
| Flat | £57,987.00 | 5 Flats |
| Semi Detached House | £138,441.00 | 29 Semi Detached Houses |
| Terraced House | £106,713.00 | 154 Terraced Houses |
| Detached House | £262,976.00 | 21 Detached Houses |