
Houses for sale & to rent in Aberdovey, Machynlleth
House Prices in Aberdovey
Properties in Aberdovey have an average house price of £251,683.00 and had 30 Property Transactions within the last 3 years¹.
Aberdovey is an area in Machynlleth, Gwynedd - Gwynedd with 195 households², where the most expensive property was sold for £820,000.00.
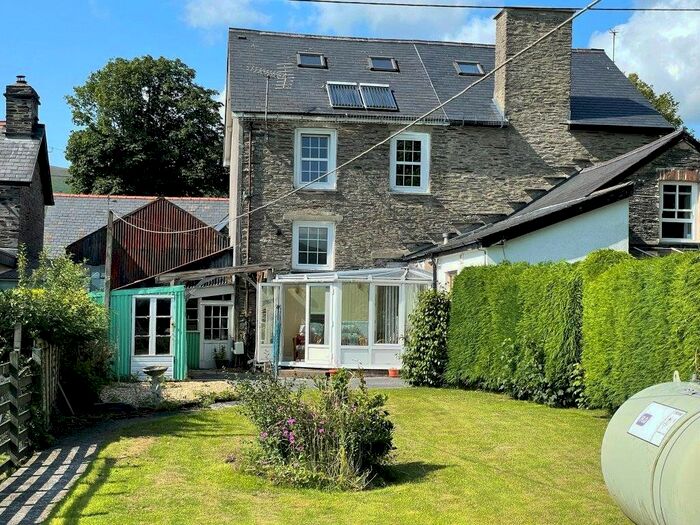
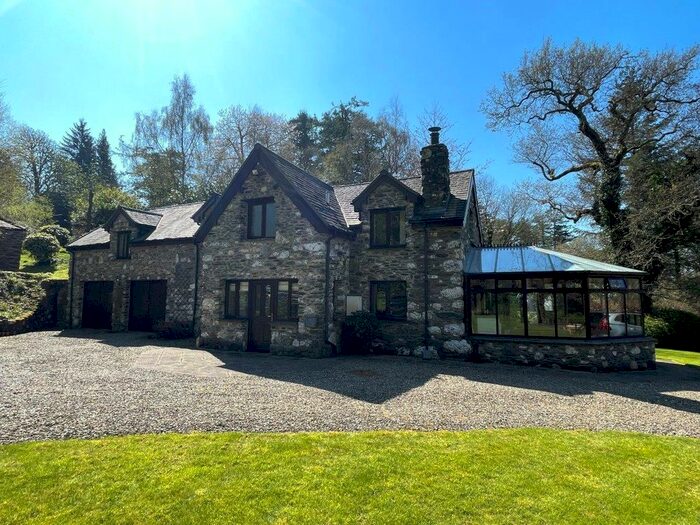
Properties for sale in Aberdovey


![]()
Save this search to be notified as soon as new listings are available.
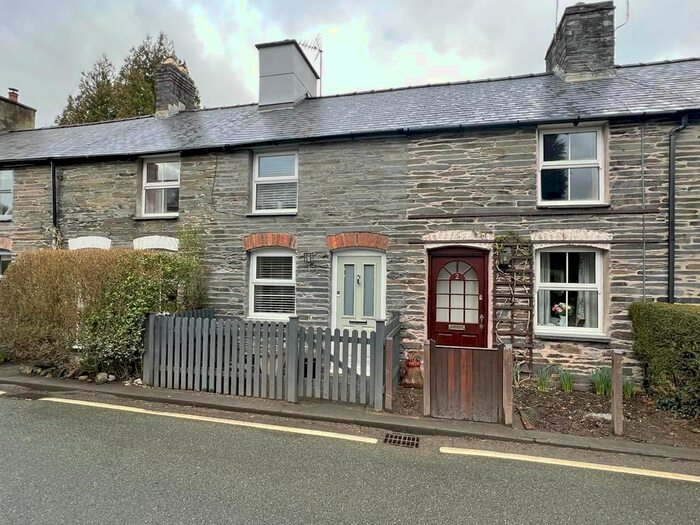
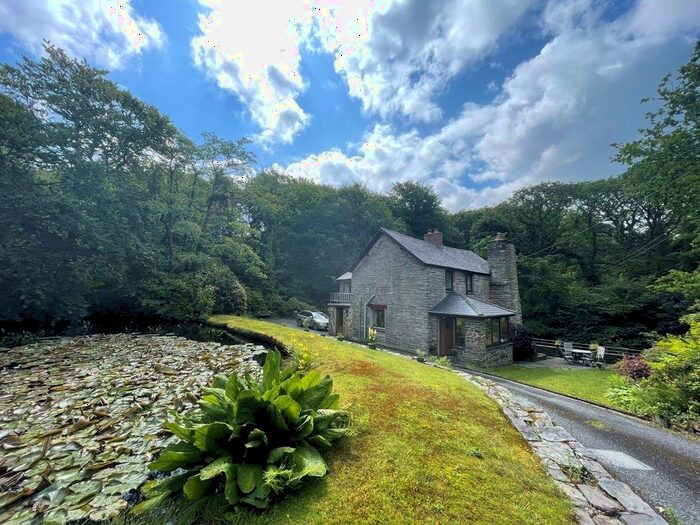
Previously listed properties in Aberdovey

![]()
Save this search to be notified as soon as new listings are available.


Roads and Postcodes in Aberdovey
Navigate through our locations to find the location of your next house in Aberdovey, Machynlleth for sale or to rent.
| Streets | Postcodes |
|---|---|
| Cwrt | SY20 9LA |
| Felindre | SY20 9DZ |
| Ffordd Glyndwr | SY20 9JJ |
| Graiandy | SY20 9DR |
| Maesteg | SY20 9DL |
| Marian Terrace | SY20 9DS |
| Plas Talgarth | SY20 9LG |
| Rhys Terrace | SY20 9DJ |
| Tower Road | SY20 9DP |
| SY20 9DH SY20 9DT SY20 9DU SY20 9DW SY20 9JR SY20 9JS SY20 9JT SY20 9JU SY20 9JX SY20 9JZ SY20 9LB SY20 9LD SY20 8QA SY20 9DX SY20 9DY SY20 9JY SY20 9LE SY20 9LF |
Transport near Aberdovey
-
 Dovey Junction Station
 -
Machynlleth Station
-
Penhelig Station
-
Aberdovey Station
-
Tywyn Station
-
Borth Station
-
Tonfanau Station
-
Llwyngwril Station
-
Fairbourne Station
-
Morfa Mawddach Station
- FAQ
- Price Paid By Year
- Property Type Price
Frequently asked questions about Aberdovey
What is the average price for a property for sale in Aberdovey?
The average price for a property for sale in Aberdovey is £251,683. This amount is 14% higher than the average price in Machynlleth. There are 56 property listings for sale in Aberdovey.
What streets have the most expensive properties for sale in Aberdovey?
The streets with the most expensive properties for sale in Aberdovey are Ffordd Glyndwr at an average of £550,000, Cwrt at an average of £193,250 and Felindre at an average of £186,500.
What streets have the most affordable properties for sale in Aberdovey?
The streets with the most affordable properties for sale in Aberdovey are Marian Terrace at an average of £132,000, Plas Talgarth at an average of £165,500 and Rhys Terrace at an average of £180,000.
Which train stations are available in or near Aberdovey?
Some of the train stations available in or near Aberdovey are Dovey Junction, Machynlleth and Penhelig.
Property Price Paid in Aberdovey by Year
The average sold property price by year was:
| Year | Average Sold Price | Price Change |
Sold Properties
|
|---|---|---|---|
| 2024 | £111,333 | -151% |
3 Properties |
| 2023 | £279,863 | 22% |
11 Properties |
| 2022 | £218,333 | -42% |
9 Properties |
| 2021 | £310,428 | 39% |
7 Properties |
| 2020 | £190,491 | 26% |
6 Properties |
| 2019 | £140,800 | 5% |
5 Properties |
| 2018 | £134,350 | -58% |
10 Properties |
| 2017 | £212,500 | 39% |
8 Properties |
| 2016 | £128,583 | -19% |
6 Properties |
| 2015 | £153,500 | -1% |
8 Properties |
| 2014 | £155,562 | 15% |
4 Properties |
| 2013 | £132,600 | -48% |
5 Properties |
| 2012 | £196,248 | -38% |
3 Properties |
| 2011 | £269,875 | 40% |
4 Properties |
| 2010 | £162,916 | -16% |
6 Properties |
| 2009 | £188,625 | 24% |
4 Properties |
| 2008 | £143,916 | -34% |
6 Properties |
| 2007 | £192,437 | 31% |
8 Properties |
| 2006 | £132,668 | -17% |
8 Properties |
| 2005 | £155,416 | -8% |
12 Properties |
| 2004 | £168,000 | 44% |
1 Property |
| 2003 | £94,888 | 40% |
9 Properties |
| 2002 | £56,570 | -12% |
12 Properties |
| 2001 | £63,368 | -108% |
8 Properties |
| 2000 | £131,600 | 61% |
5 Properties |
| 1999 | £50,700 | 11% |
10 Properties |
| 1998 | £45,000 | 10% |
3 Properties |
| 1997 | £40,690 | -19% |
5 Properties |
| 1996 | £48,395 | -20% |
12 Properties |
| 1995 | £58,250 | - |
4 Properties |
Property Price per Property Type in Aberdovey
Here you can find historic sold price data in order to help with your property search.
The average Property Paid Price for specific property types in the last three years are:
| Property Type | Average Sold Price | Sold Properties |
|---|---|---|
| Semi Detached House | £160,833.00 | 3 Semi Detached Houses |
| Terraced House | £161,400.00 | 10 Terraced Houses |
| Detached House | £355,099.00 | 15 Detached Houses |
| Flat | £63,750.00 | 2 Flats |